Videos
FEATURED
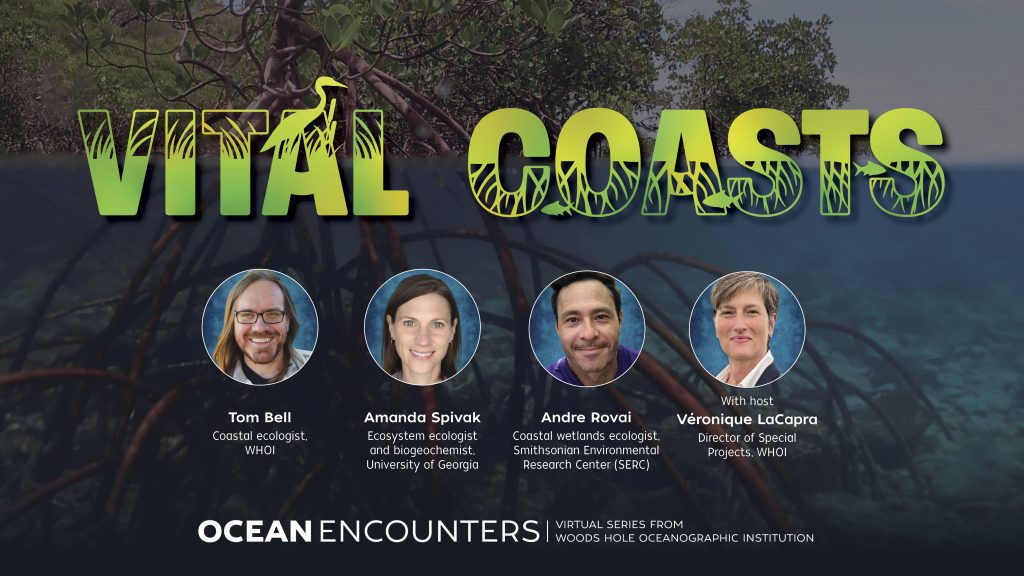
Ocean Encounters: Vital Coasts
Join us for a conversation about the science that helps us understand and protect these remarkable coastal ecosystems.
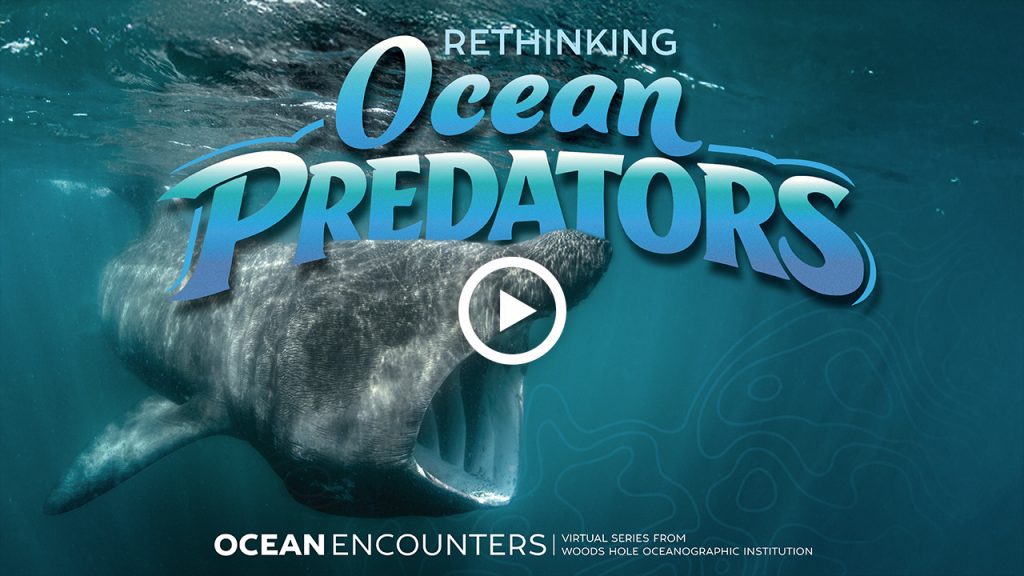
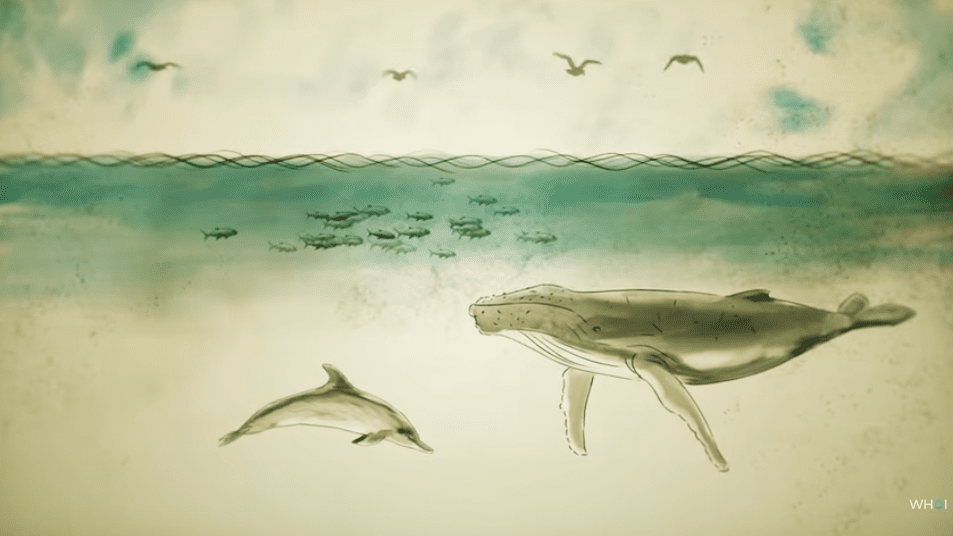
Ocean Encounters: Rethinking Ocean Predators
The ocean is home to many of Earth’s most iconic and often feared predators. But did you know that some of the largest are actually gentle giants that feed on the tiniest prey?
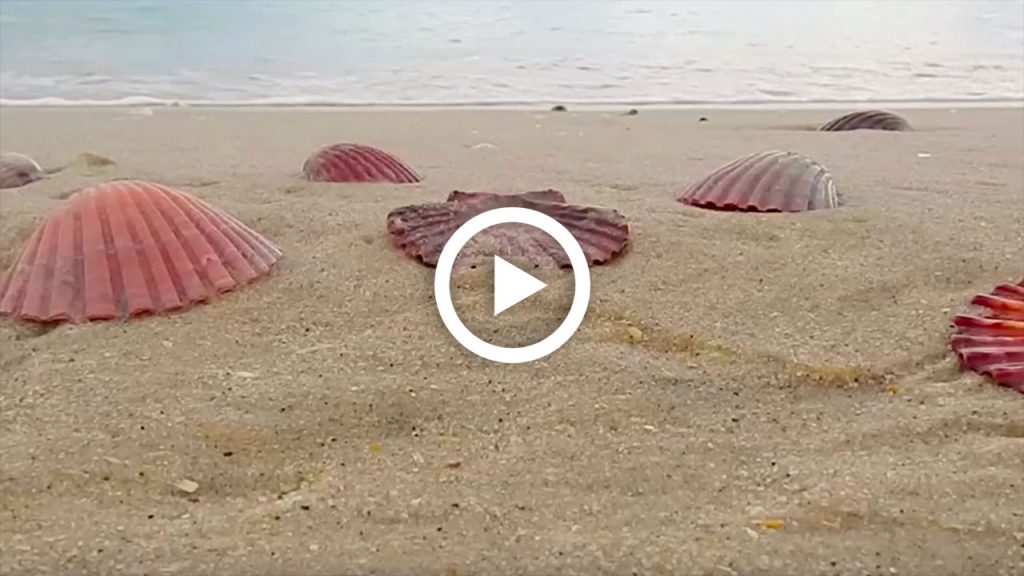
How are seashells made?
One of the most striking features of our beaches is seashells. Their whorls, curves, and shiny iridescent insides are the remains of animals. But where do they come from?
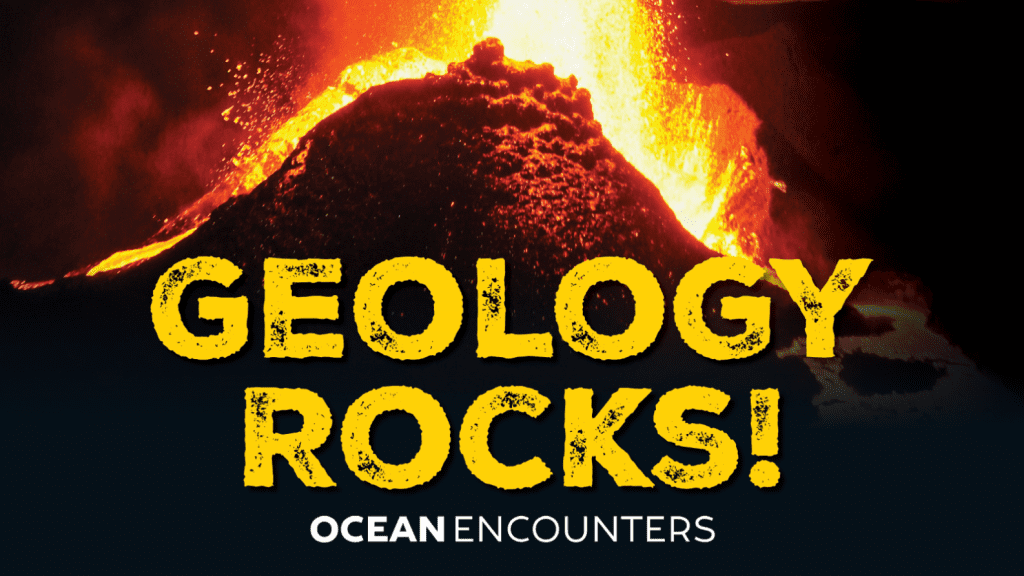
Ocean Encounters: Geology Rocks!
Curious about Earth’s inner workings? Meet three geologists with unique careers studying quakes, volcanoes, and the planet beneath our feet.
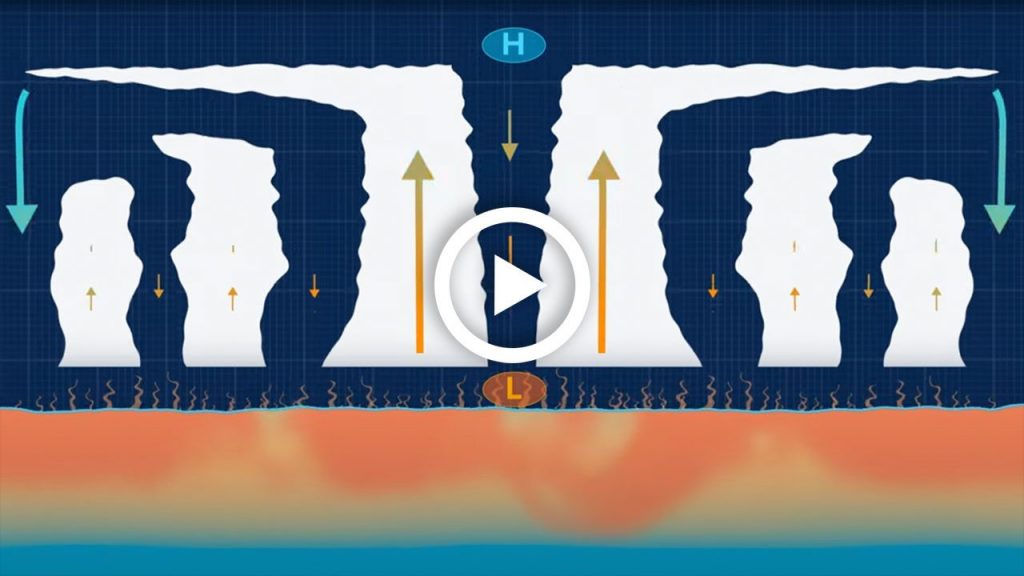
How does the ocean impact hurricanes?
Hurricanes unleash powerful winds, rain, and storm surges on land—but they also stir the ocean, disrupting ecosystems and impacting marine life and currents.
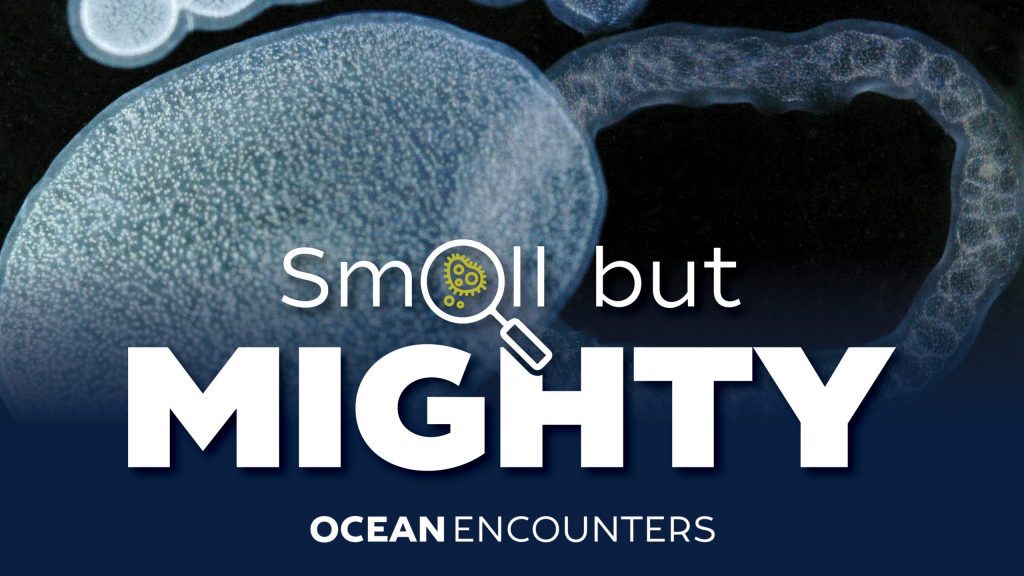
Ocean Encounters: Small but Mighty
Microscopic marine life plays a huge role in our ocean—fueling food webs, shaping climate, and offering clues to life’s origins.
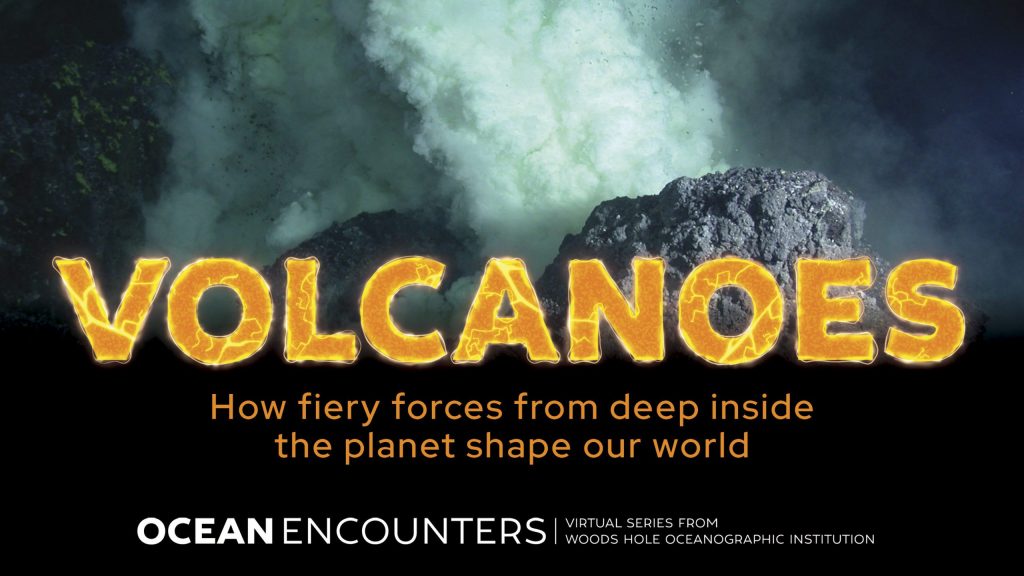
Ocean Encounters: Volcanoes
Learn about volcanoes on the seafloor, the insights they’re revealing, and how they impact our ocean planet.
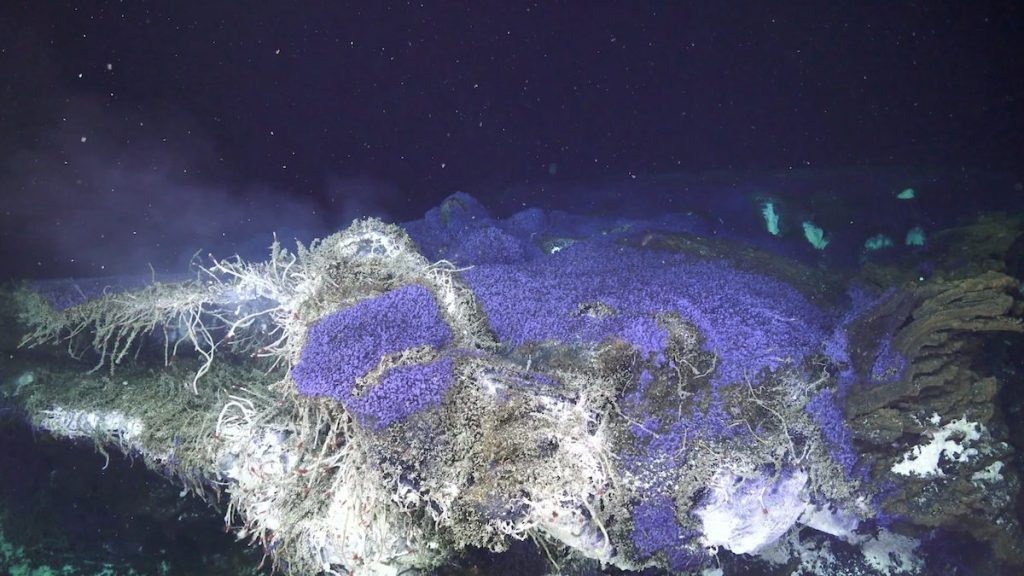
Illuminating the Seafloor
Teamwork between a deep-sea robot and a human-occupied submarine led to the discovery of five new hydrothermal vents on the seafloor of the eastern Tropical Pacific Ocean.
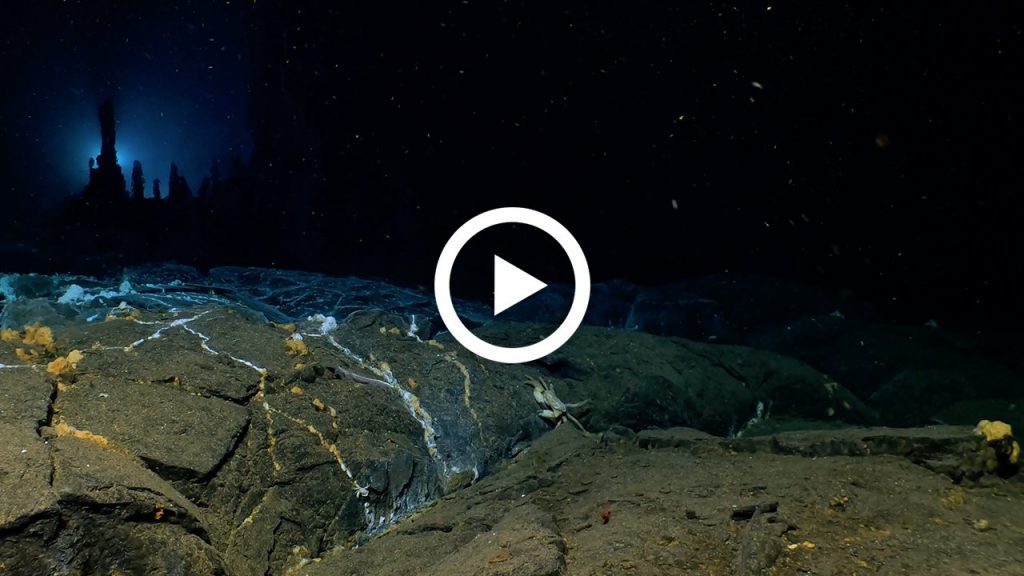
Investigating the world of microbes with ROV Jason
At Axial Seamount, WHOI scientists filmed vibrant life at deep-sea vents—ecosystems powered by chemosynthetic microbes in total darkness.
Rare look at animals in the ocean twilight zone
The ocean is vast, so scientists use two ocean robots to better spot and study elusive creatures from the deep, dark twilight zone.
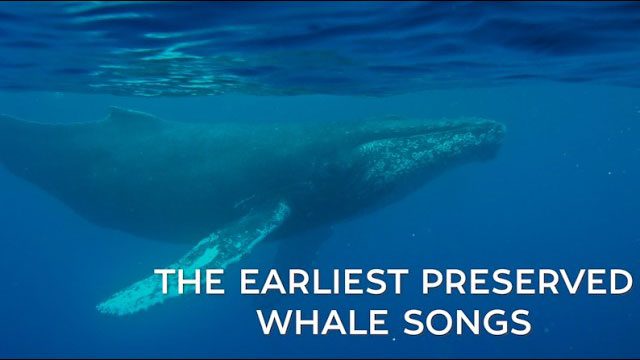
Earliest preserved whale song discovered in the WHOI archives
A 1949 recording of a humpbackwhale, captured near Bermuda during acoustic experiments aboard the original R/V Atlantis, was discovered in the WHOI archives
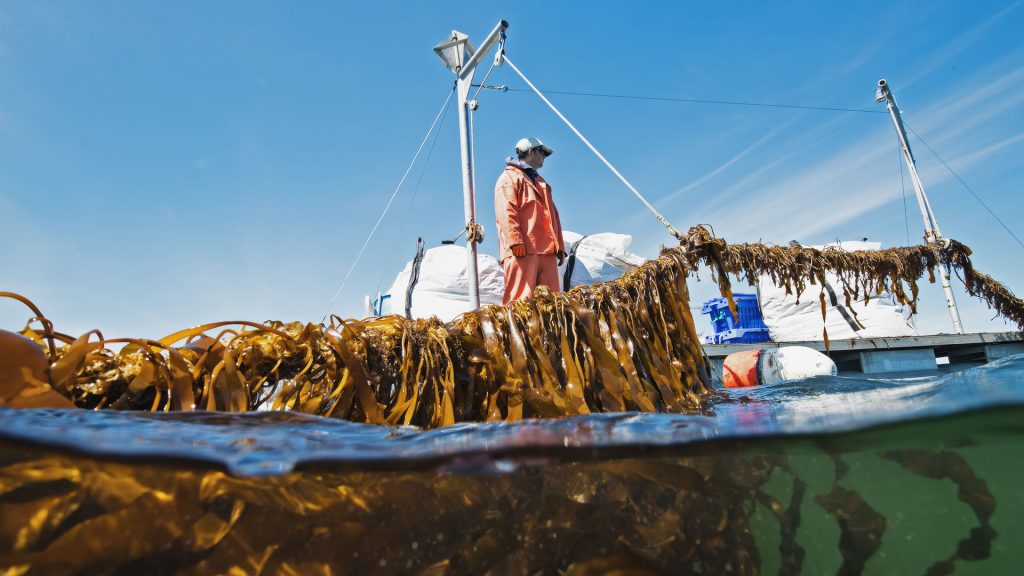
WHOI Kelp Research: Seeding the Blue Economy
As the kelp aquaculture industry works to scale up, our scientists and engineers are helping out with an automated seeder that cuts down on farmers’ time and exposure to the elements.
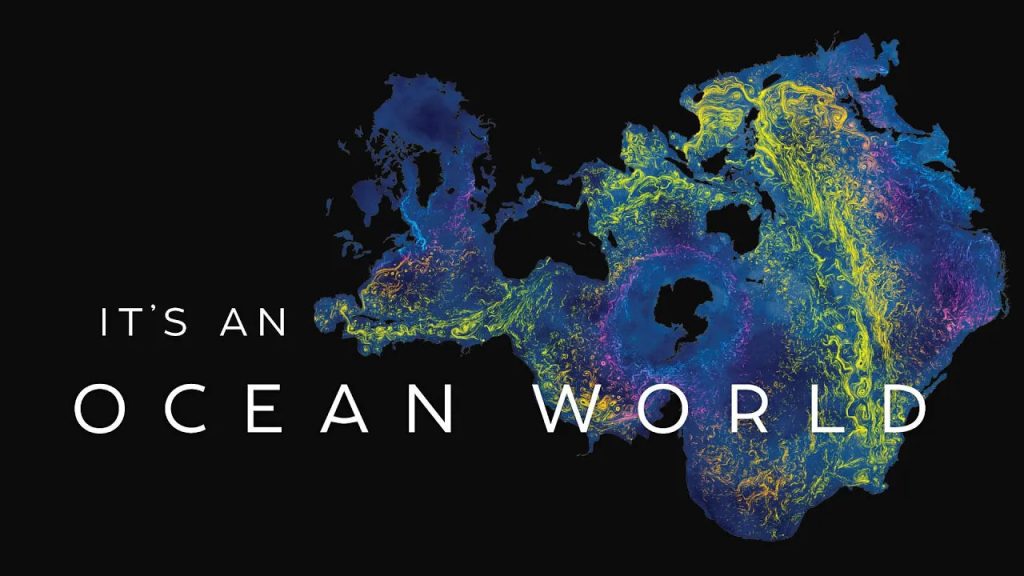
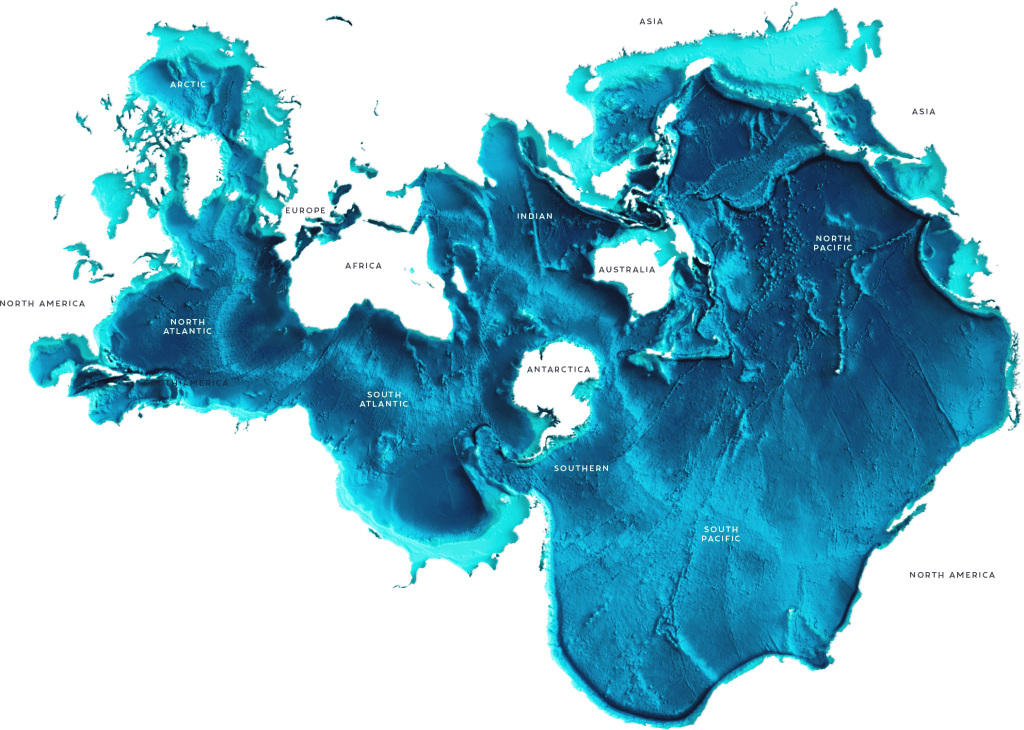
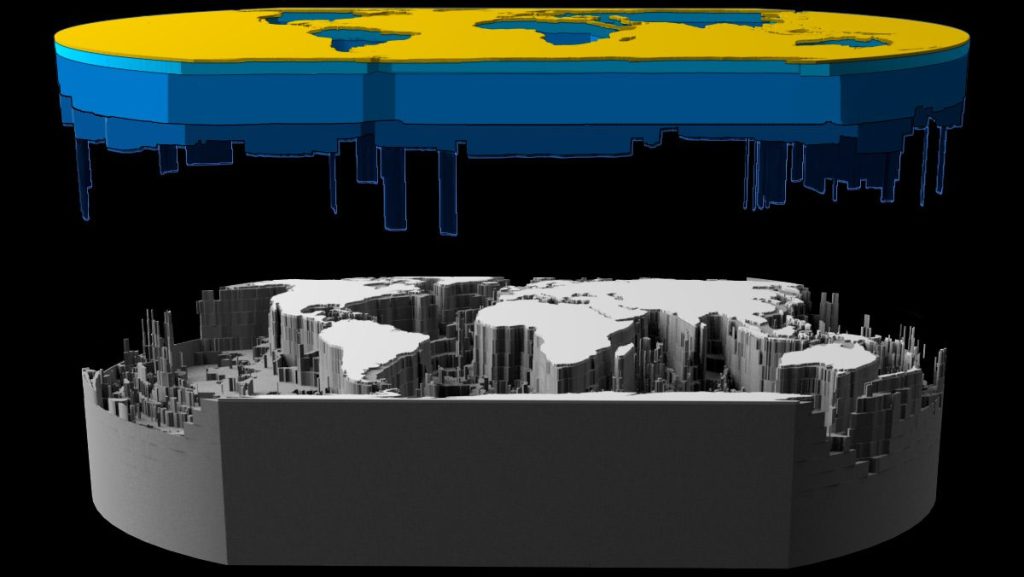
It’s an Ocean World: Explore the Hidden Wonders
We’re used to seeing our planet with land at the center—continents separated by seas. But when we shift our perspective, we see that’s is really one ocean that connects us all.
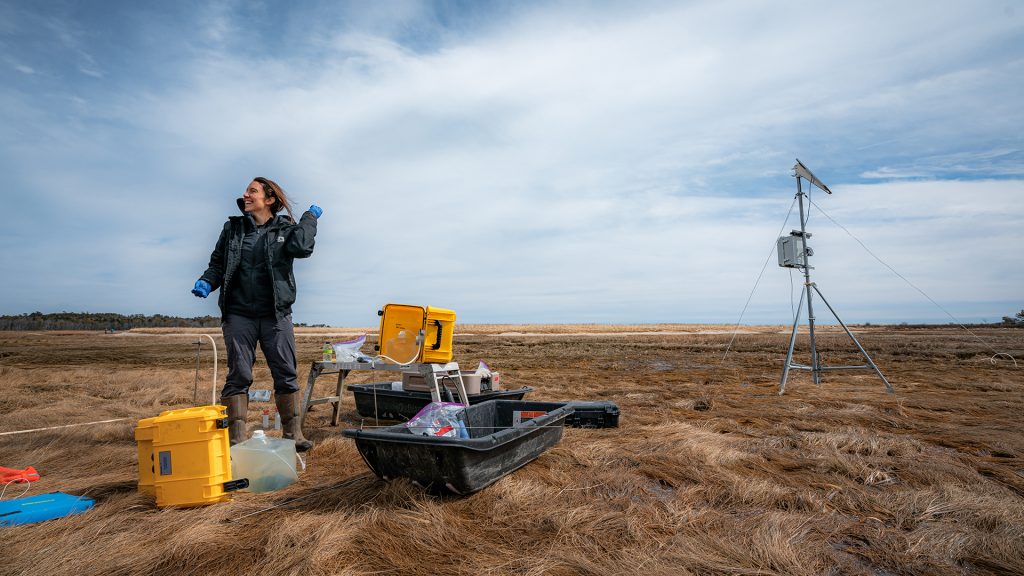
Cold, Quiet, and Carbon Rich: Investigating winter wetlands
Salt marshes are powerful protectors—buffering coastlines from storms, supporting fisheries like lobster and scallops, and…
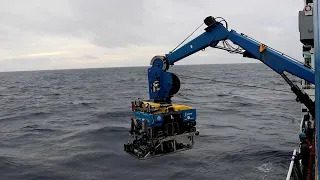
Navigating murky waters—with robots!
How can you collect a precious deep-sea sample if you can’t see?!
What fuels New England’s fisheries?
New England’s famous fisheries rely on tiny but mighty plankton.
Earliest preserved whale song discovered in the WHOI archives
A 1949 recording of a humpbackwhale, captured near Bermuda during acoustic experiments aboard the original R/V Atlantis, was discovered in the WHOI archives
WHOI Kelp Research: Seeding the Blue Economy
As the kelp aquaculture industry works to scale up, our scientists and engineers are helping out with an automated seeder that cuts down on farmers’ time and exposure to the elements.
It’s an Ocean World: Explore the Hidden Wonders
We’re used to seeing our planet with land at the center—continents separated by seas. But when we shift our perspective, we see that’s is really one ocean that connects us all.
Cold, Quiet, and Carbon Rich: Investigating winter wetlands
Salt marshes are powerful protectors—buffering coastlines from storms, supporting fisheries like lobster and scallops, and…
Illustrations
FEATURED
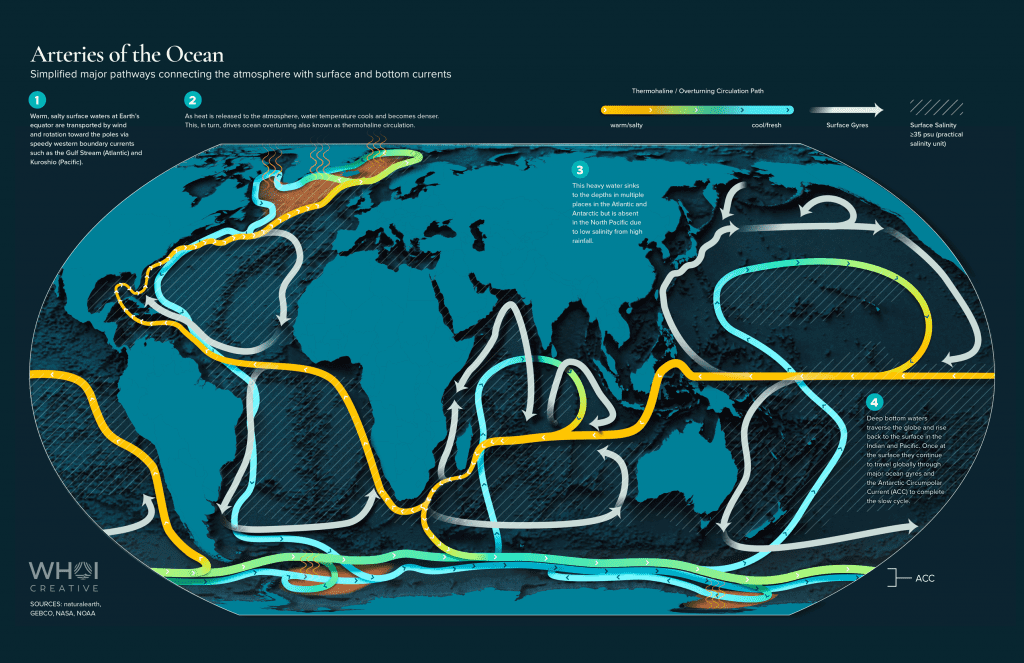
Arteries of the Ocean
Learn more about how the ocean’s complex and chaotic physics define life on our planet.
Change your perspective
Athelstan Spilhaus proposed centering world maps on the ocean, arguing Earth is an interconnected ocean planet—not one defined by London-centric cartography.
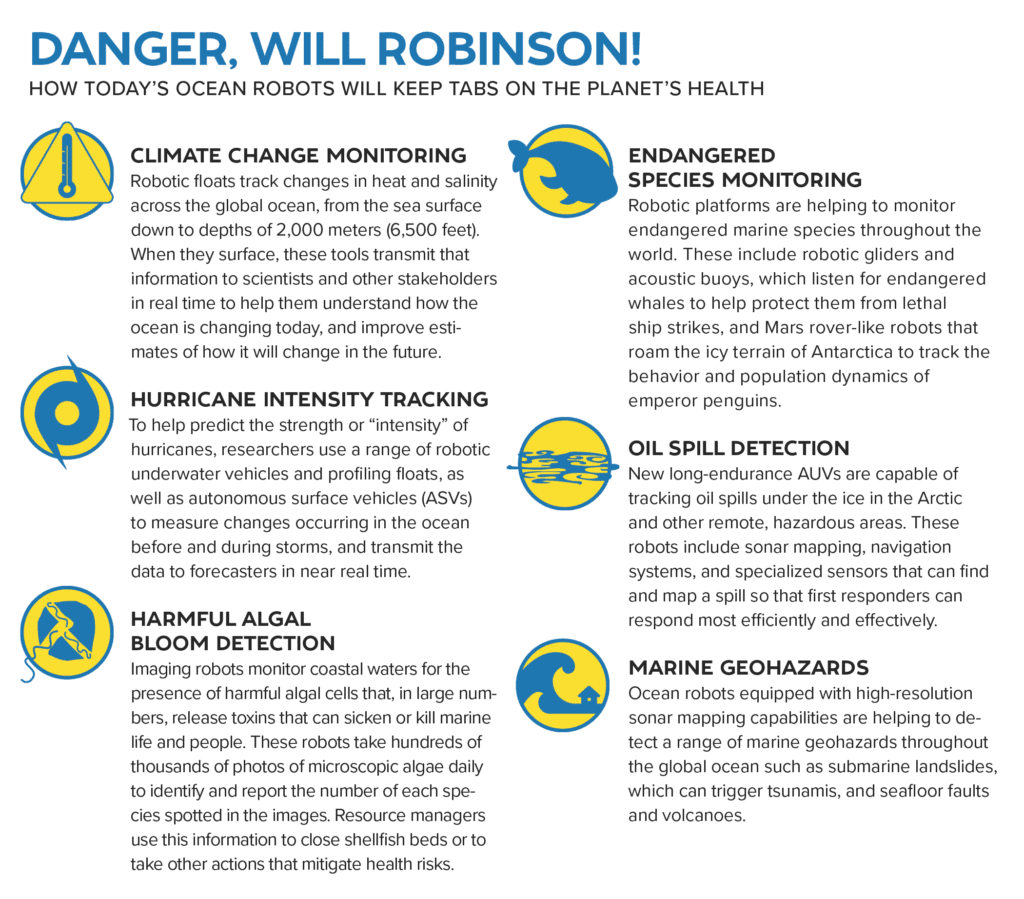
How ocean robots keep tabs on the planet’s health
Learn how the next generation of ocean robots will help solve the planet’s most pressing problems.
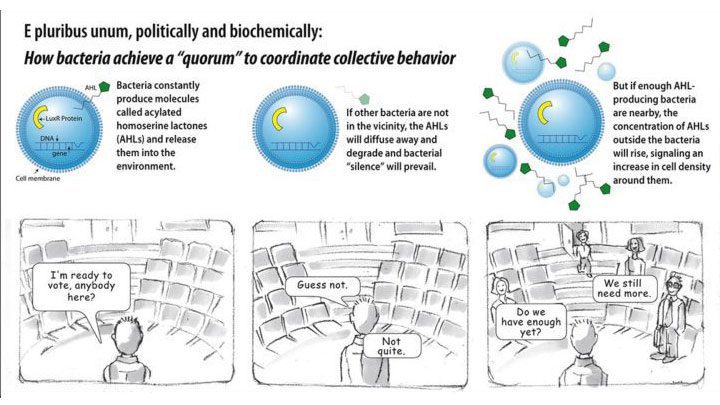
How bacteria achieve a “quorum”
Bacteria utilize quorum sensing to coordinate collective behavior, a process that allows them to communicate and respond as a unified group. This fascinating mechanism plays a crucial role in their survival and adaptation in diverse environments.
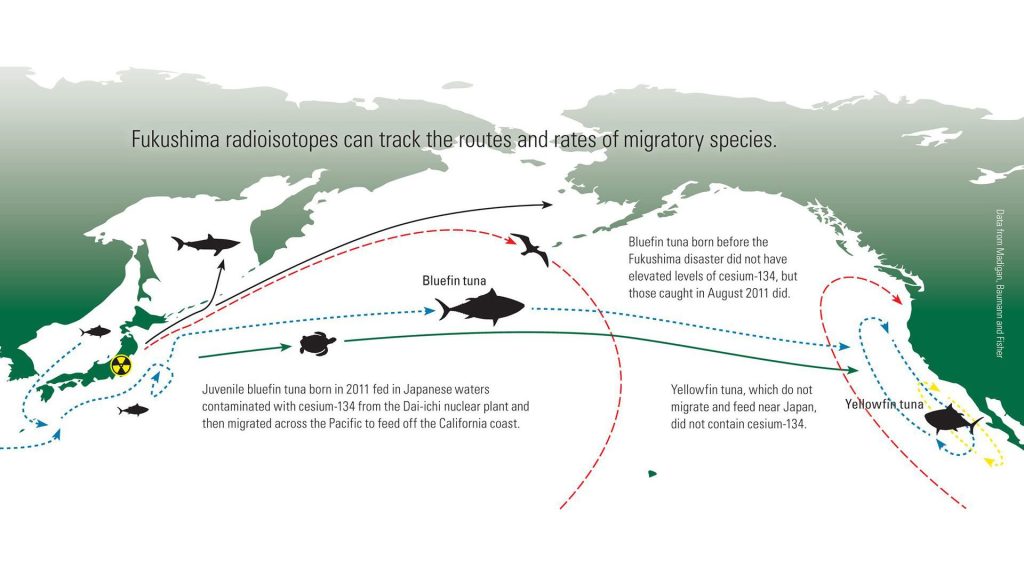
Radioisotopes Tracking Tuna Migration
Bluefin tuna born before the Fukushima disaster did not have elevated levels of cesium-134, but those caught in August 2011 did.
Two subspecies of pilot whales identified
New research reveals that short-finned pilot whales are not one, but two distinct subspecies, changing our understanding of their diversity.
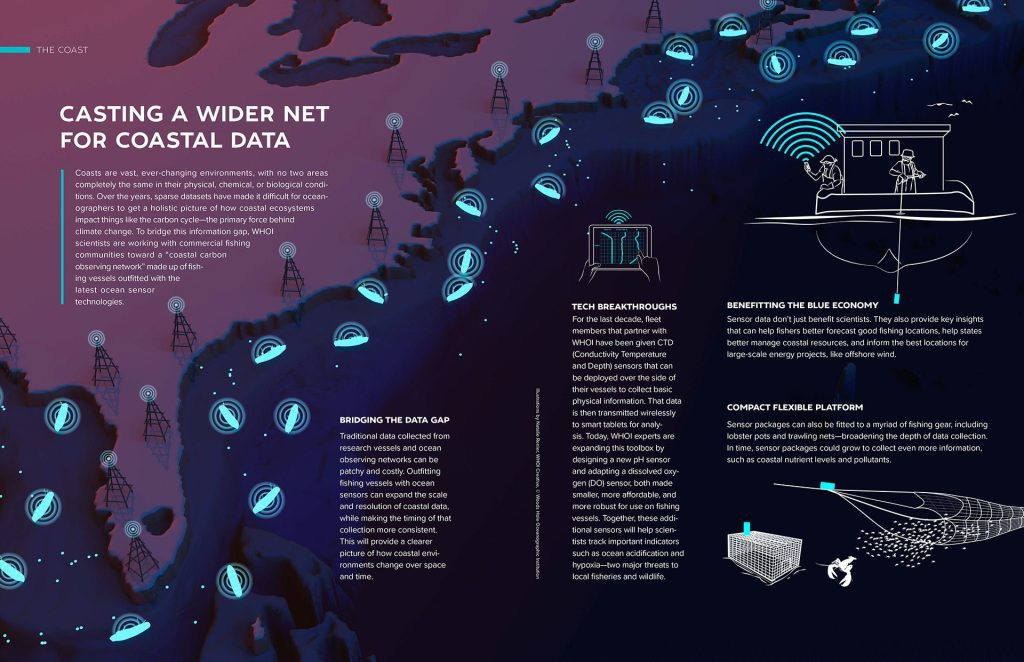
Scope and benefits of a “Coastal Carbon Observing Network”
WHOI scientists are working with fishing communities toward a coastal carbon observing network made up of fishing vessels with the latest ocean technologies.
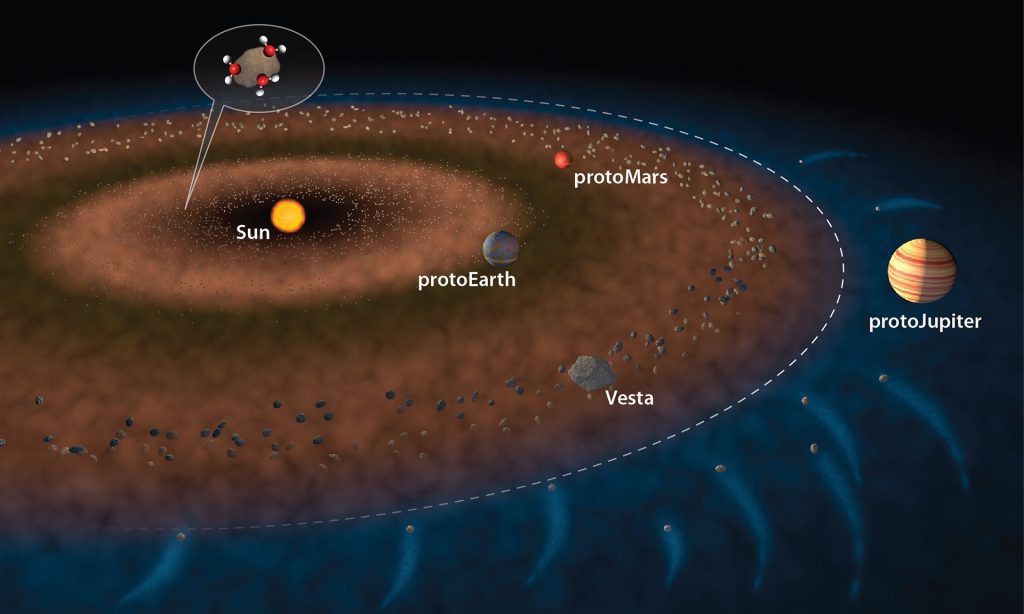
How Earth got its water
Water likely arrived in the inner solar system early on, flung by gravity from proto-Jupiter via meteorites, according to research on asteroid Vesta.
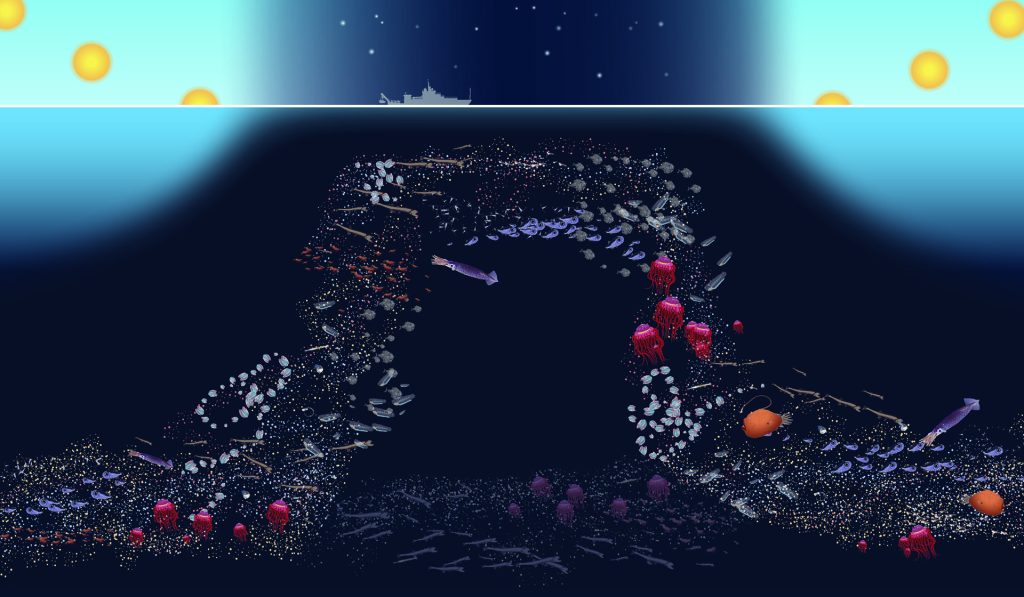
OTZ Mixing Pump and Migration Pump
Each night, millions of ocean animals migrate upward to feed, then descend at dawn, actively transporting carbon from surface waters to the deep in Earth’s largest animal migration.
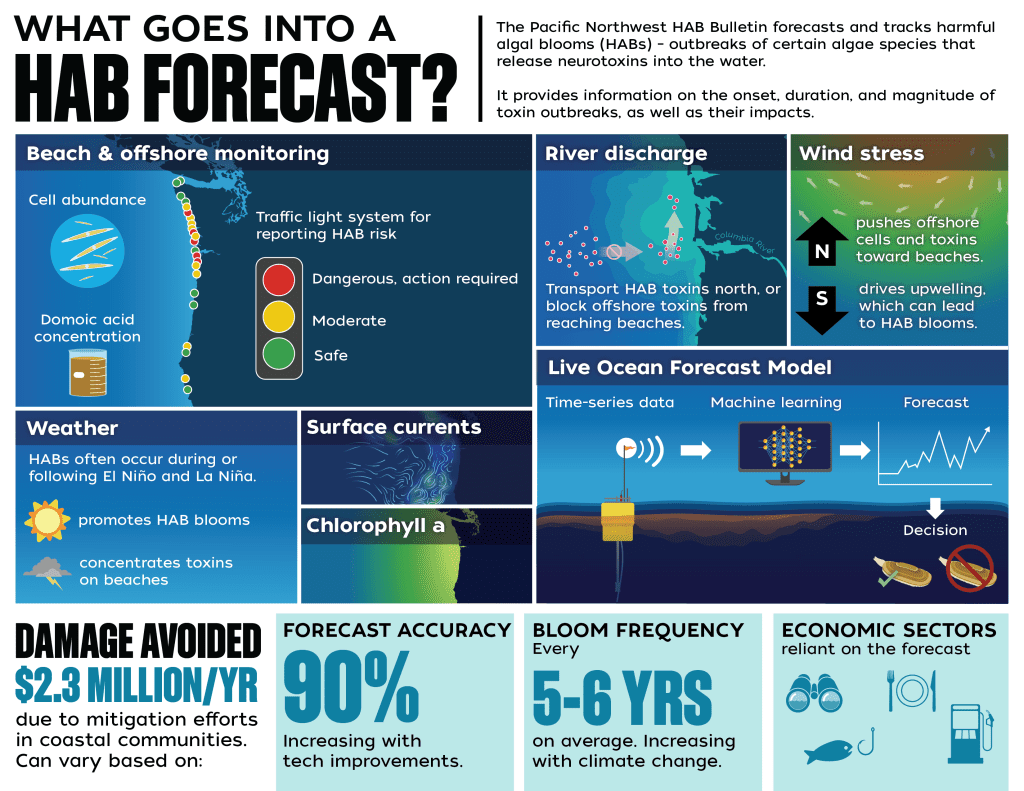
What goes into a HAB forecast?
Harmful algal bloom (HAB) forecasts rely on a combination of satellite data, water samples, and predictive modeling to track the proliferation of toxic algae, essential for protecting coastal ecosystems and public health.
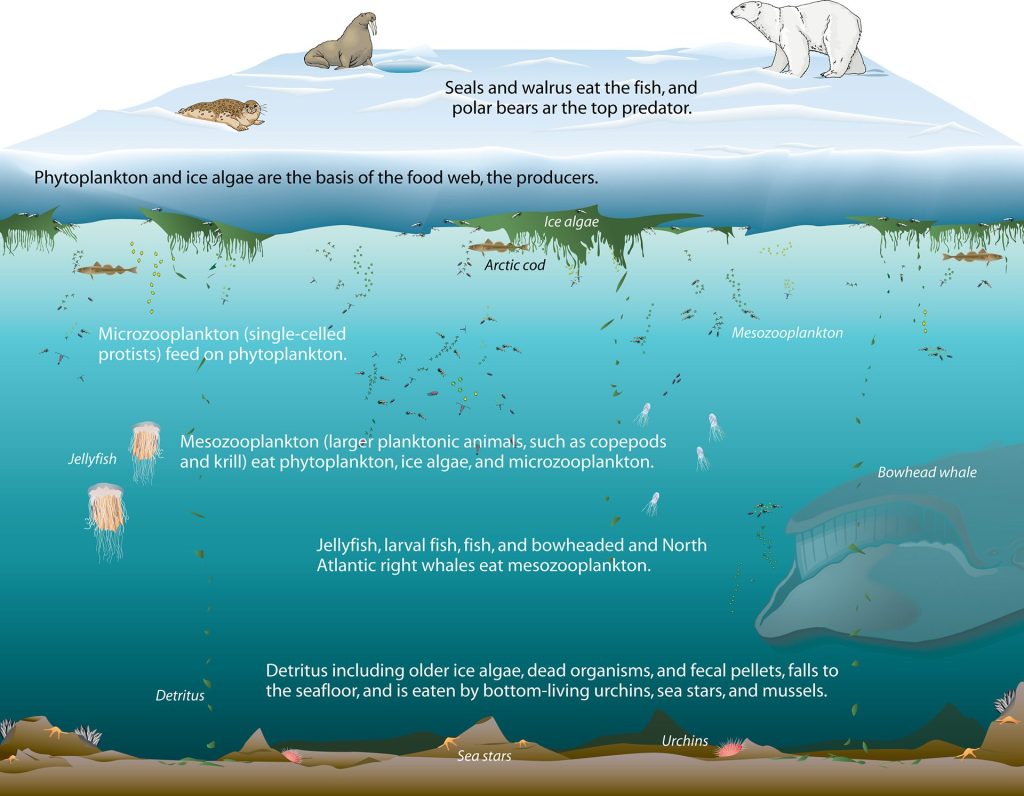
Arctic ecosystem
This abundant ecosystem supports large predators like walruses, polar bears, and whales.
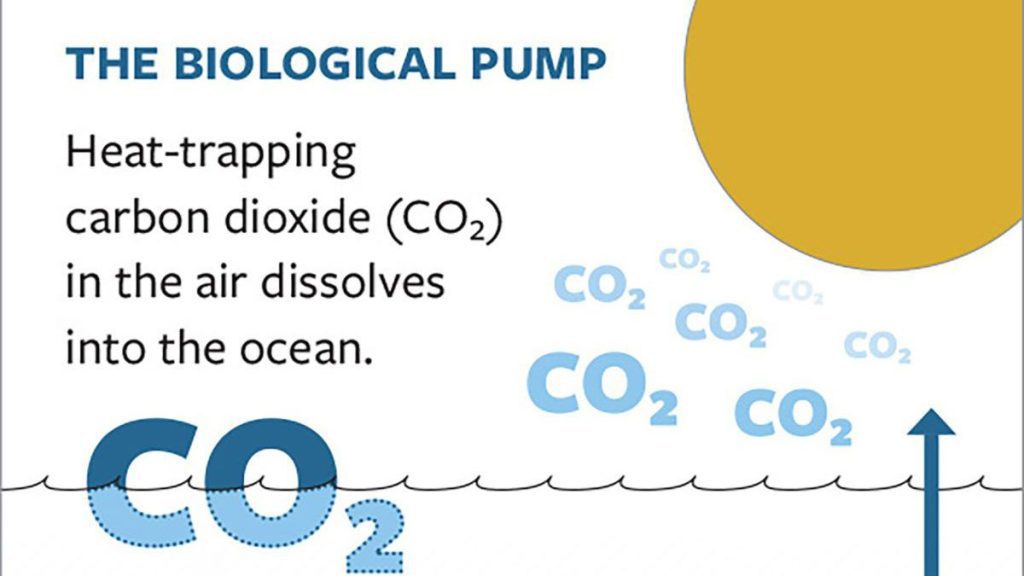
The Biological Pump
The biological pump converts greenhouse gas that warms Earth climate into organic carbon that is then stored in the depths of the ocean.
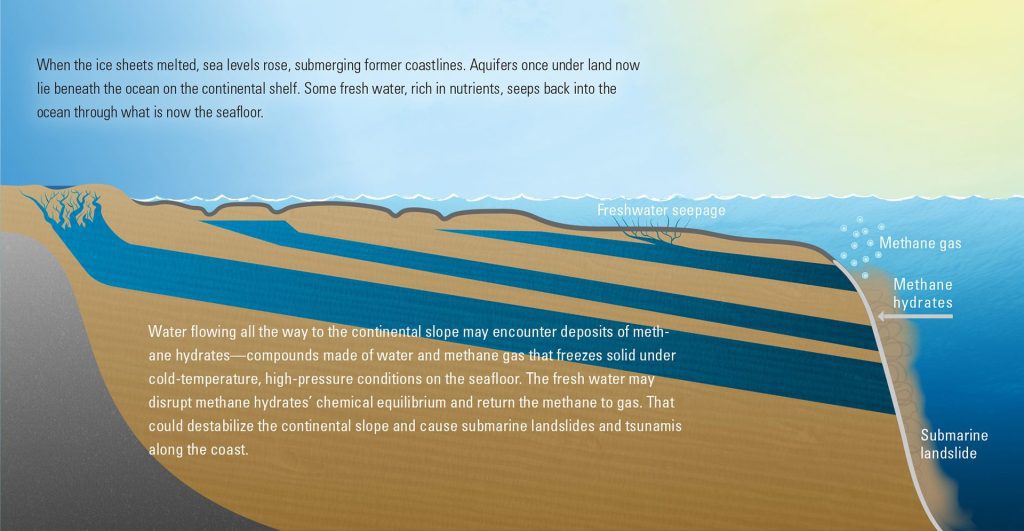
How subterranean water seeps into the continental shelf and into the ocean
When the ice sheets melted, sea levels rose, submerging former coastlines. Aquifers once under land now lie beneath the ocean on the continental shelf.
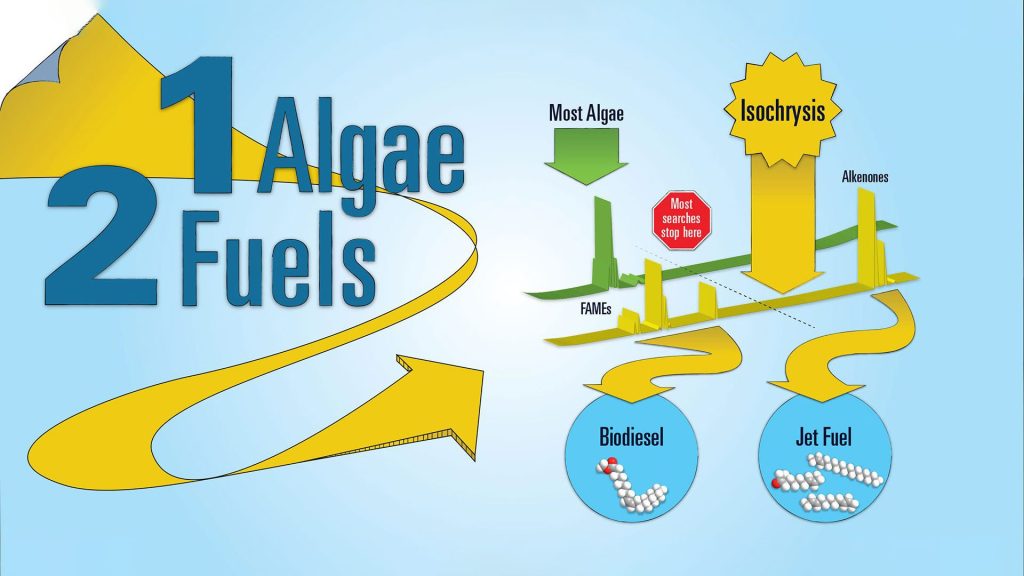
Isochrysis algae to biofuel and jet fuel
Researchers discovered that the algae Isochrysis can produce both biodiesel and jet fuel by utilizing its unique fats, despite its dark, sludgy oil at room temp.
Jet Fuel from Algae?
Scientists have explored a way to make two types of fuel—biodiesel and jet fuel from different compounds in a single type of algae.
What goes into a HAB forecast?
Harmful algal bloom (HAB) forecasts rely on a combination of satellite data, water samples, and predictive modeling to track the proliferation of toxic algae, essential for protecting coastal ecosystems and public health.
Arctic ecosystem
This abundant ecosystem supports large predators like walruses, polar bears, and whales.
The Biological Pump
The biological pump converts greenhouse gas that warms Earth climate into organic carbon that is then stored in the depths of the ocean.
How subterranean water seeps into the continental shelf and into the ocean
When the ice sheets melted, sea levels rose, submerging former coastlines. Aquifers once under land now lie beneath the ocean on the continental shelf.
Interactives
FEATURED
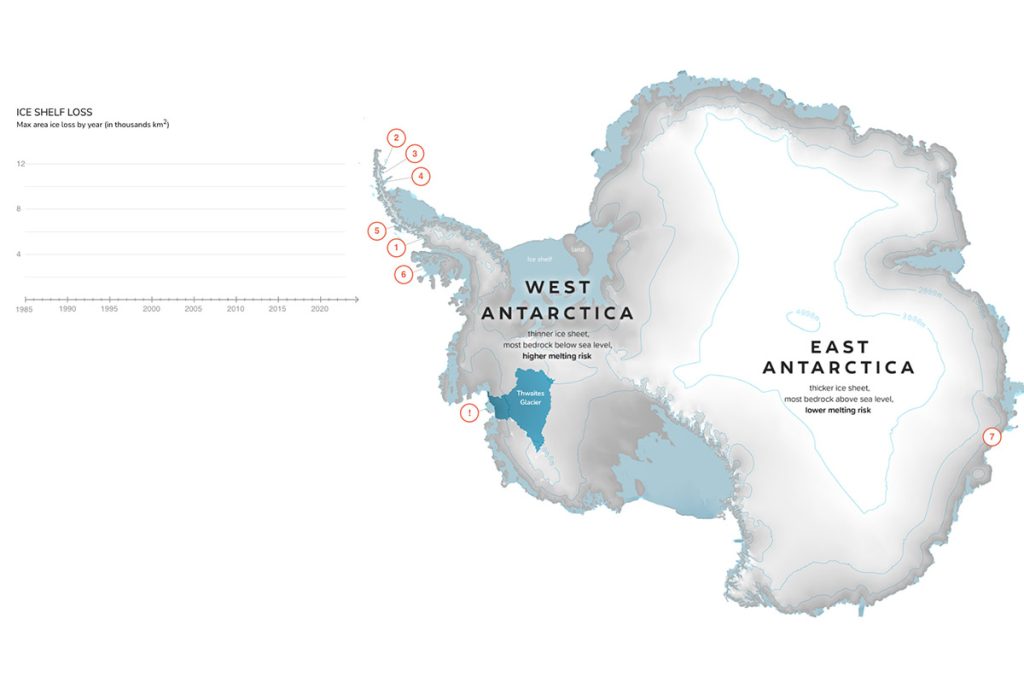
Antarctica’s ice shelf loss
Find out how Antarctica’s seven largest ice shelf collapses size up in this climate.
Plate Boundaries
From earthquakes to hydrothermal vents, see how Earth’s restless plates shape the planet. Click to explore boundaries, fault zones, and seafloor features.
Twilight Zone Basics
The ocean’s twilight zone lies 2001,000 meters deep—cold, dark, and vast. Learn about one of Earth’s largest habitats and a key frontier for ocean science in this interactive.
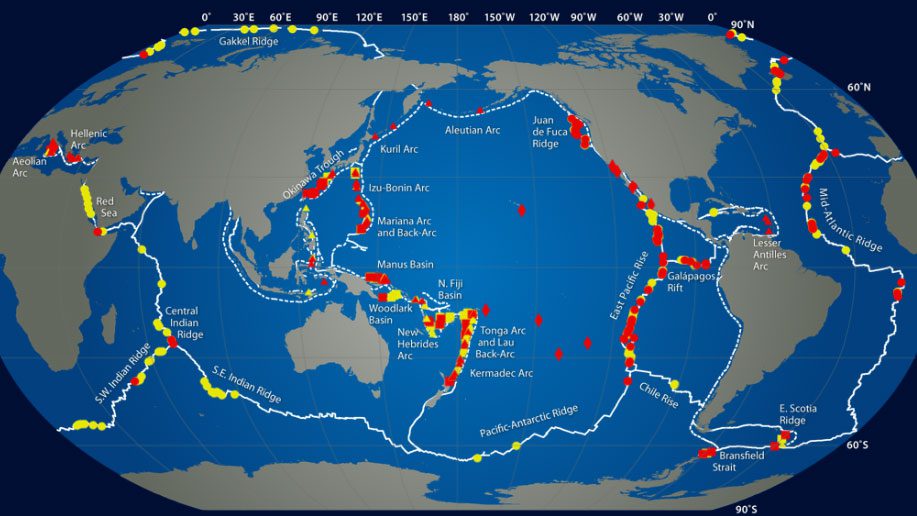
Vents Around the World
Explore global hydrothermal vents—from mid-ocean ridges to arc volcanoes—and see how confirmed and inferred vents are worldwide.
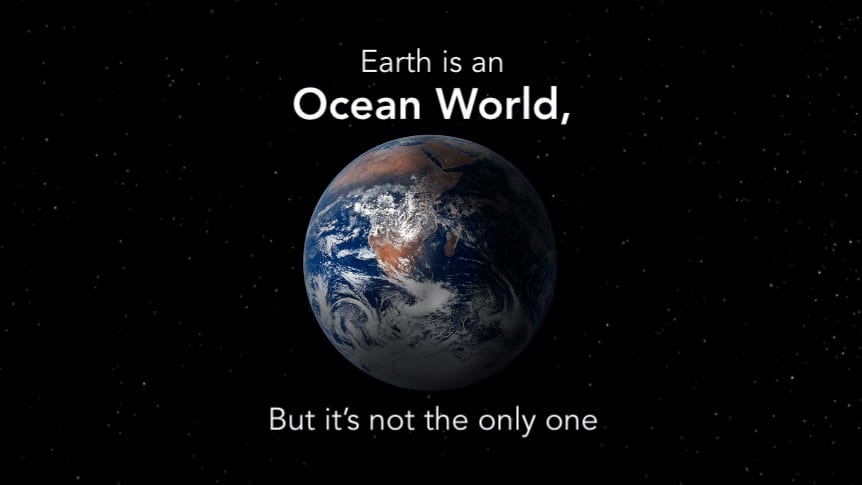
Exploring Ocean Worlds
Ocean worlds may be common in our galaxy. Modeling and exoplanet discoveries suggest many planets could have oceans, some hidden beneath icy shells.
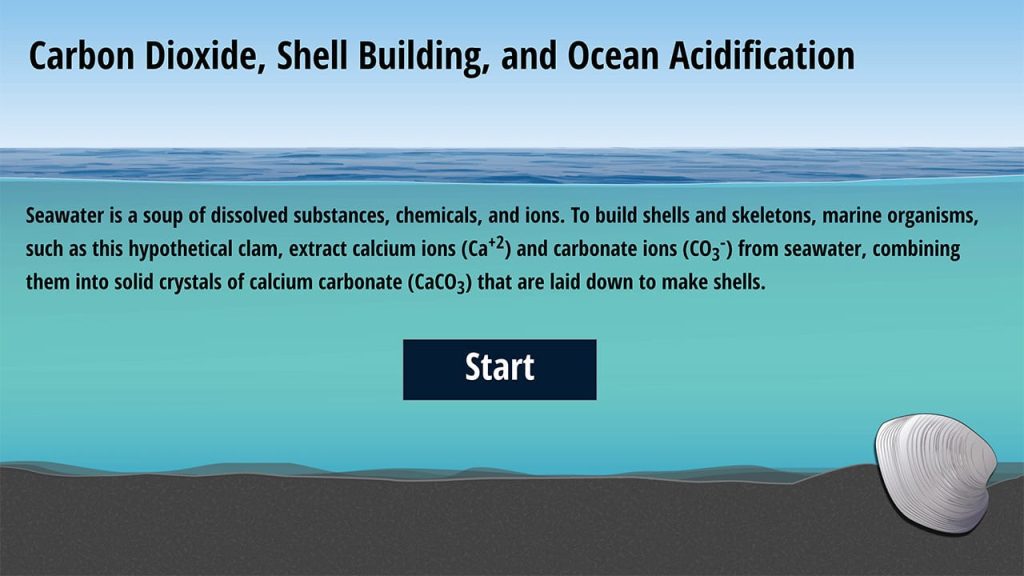
Carbon Dioxide, Shell Building, and Ocean Acidification
To build shells and skeletons, marine organisms extract calcium ions and carbonate ions from seawater to make shells.
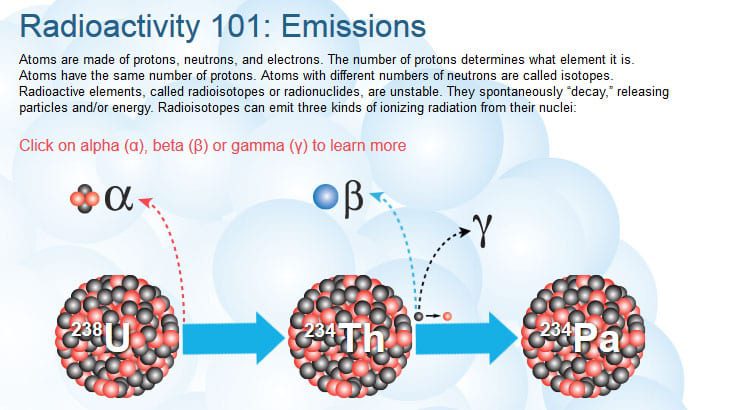
ABCs of Radioactivity
Atoms are made of protons, neutrons, and electrons. Radioactive elements, called radioisotopes or radionuclides, are unstable.
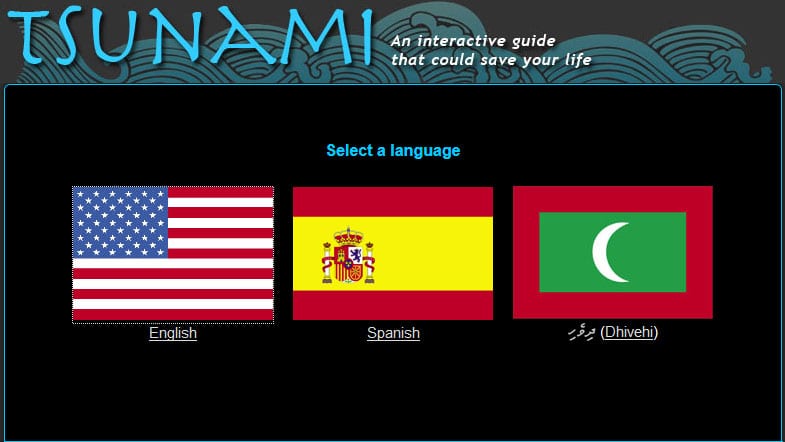
Interactive Tsunami Guide
Learn what causes tsunamis, how warning systems work, and what to do before, during, and after one strikes to stay safe and protect your loved ones.
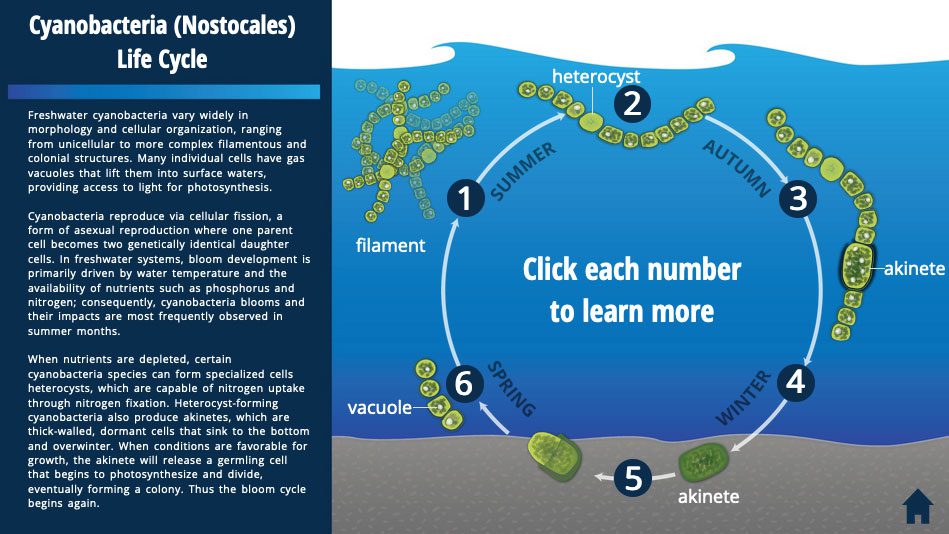
Cyanobacteria Life Cycle
Freshwater cyanobacteria vary widely in morphology and cellular organization, ranging from unicellular to more complex filamentous and colonial structures.
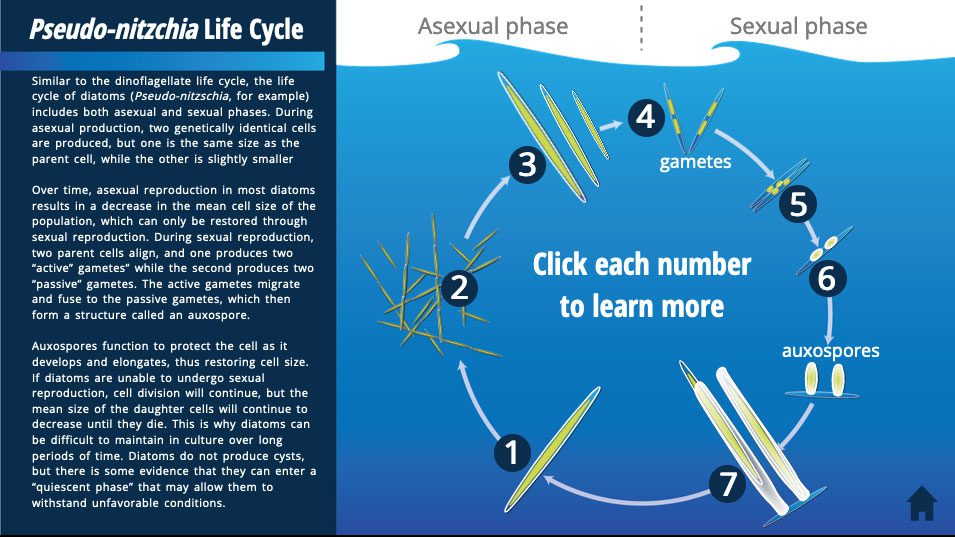
Pseudo nitzchia Life Cycle
Click through the life cycle of Pseudo-nitzschia, a chain-forming diatom that must reproduce sexually to reset its size—and can make a dangerous toxin.
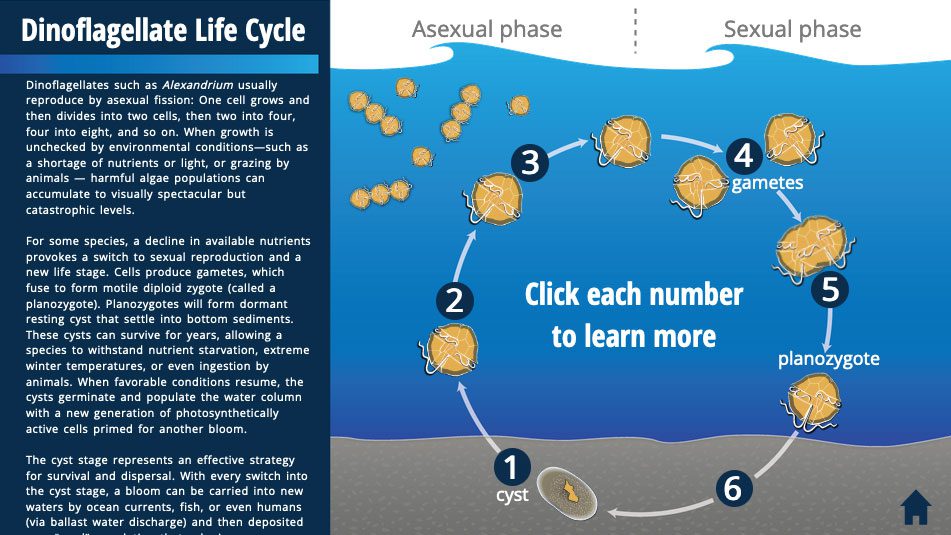
Dinoflagellate Life Cycle
Explore how dinoflagellates such as Alexandrium reproduce by asexual fission: One cell grows and then divides into two cells, then two into four, and so on.
Underwater Vehicles: How much pressure?
Click the numbers to see how pressure increases with depth—and how much force (in pounds per square inch) underwater vehicles and people must withstand.
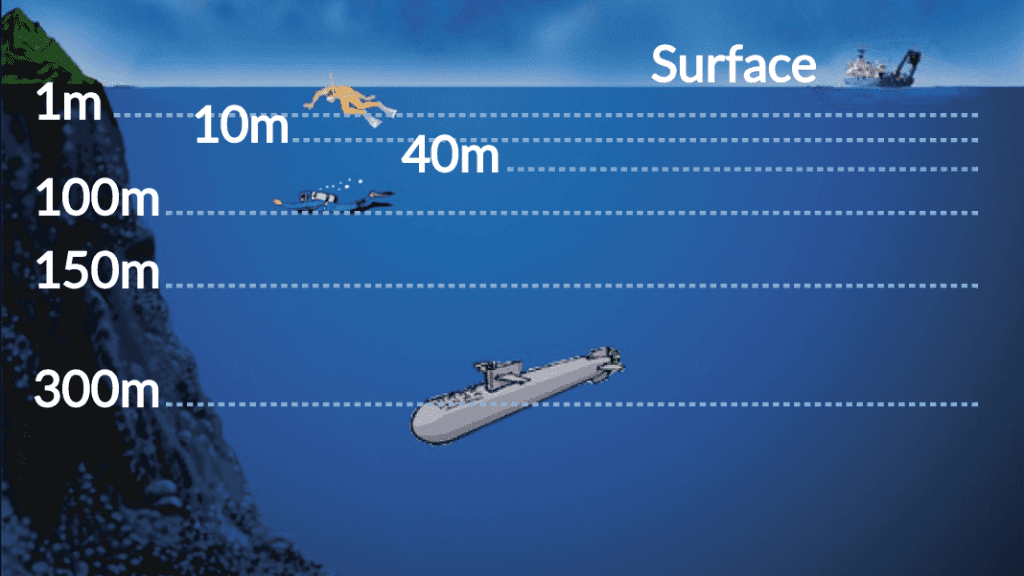
Underwater Vehicles: How deep can we go?
How deep can we go? Dive into ocean depths from 1 meter to over 10,000. Learn how pressure, light, and tech shape what we can explore—and how we do it.
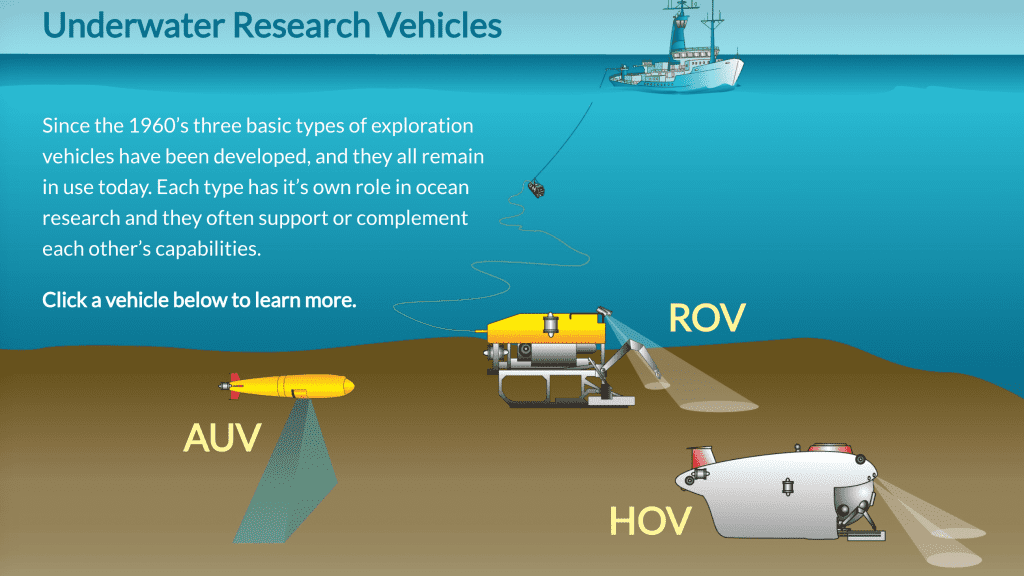
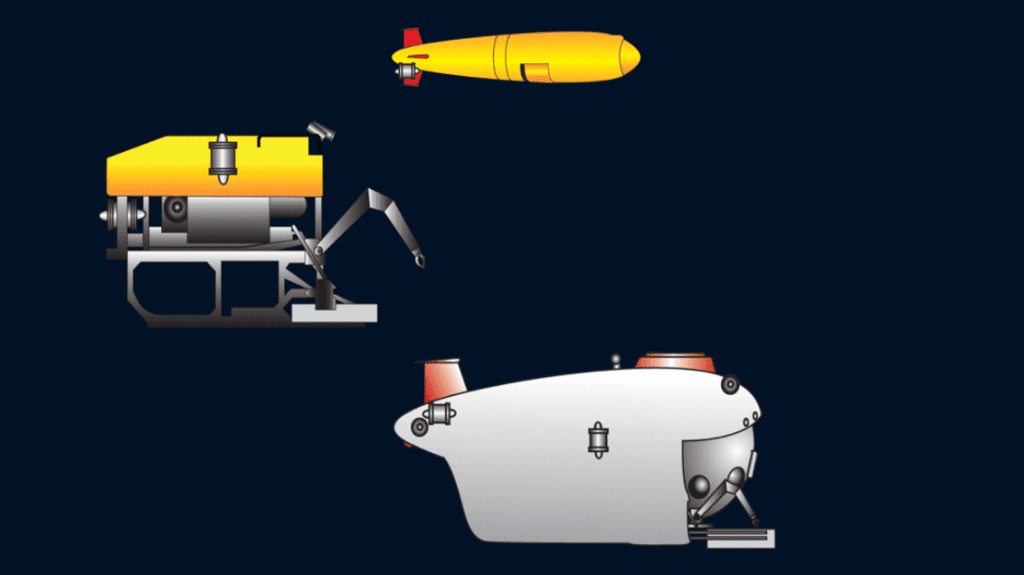
Underwater Research Vehicles
Since the 1960s, three key underwater vehicles—AUVs, ROVs, and HOVs—have helped explore the ocean. Click each to discover how they work and why they matter.
Cyanobacteria Life Cycle
Freshwater cyanobacteria vary widely in morphology and cellular organization, ranging from unicellular to more complex filamentous and colonial structures.
Pseudo nitzchia Life Cycle
Click through the life cycle of Pseudo-nitzschia, a chain-forming diatom that must reproduce sexually to reset its size—and can make a dangerous toxin.
Dinoflagellate Life Cycle
Explore how dinoflagellates such as Alexandrium reproduce by asexual fission: One cell grows and then divides into two cells, then two into four, and so on.
Underwater Vehicles: How much pressure?
Click the numbers to see how pressure increases with depth—and how much force (in pounds per square inch) underwater vehicles and people must withstand.
Infographics
FEATURED
Arteries of the Ocean
Learn more about how the ocean’s complex and chaotic physics define life on our planet.
How bacteria achieve a “quorum”
Bacteria utilize quorum sensing to coordinate collective behavior, a process that allows them to communicate and respond as a unified group. This fascinating mechanism plays a crucial role in their survival and adaptation in diverse environments.
Radioisotopes Tracking Tuna Migration
Bluefin tuna born before the Fukushima disaster did not have elevated levels of cesium-134, but those caught in August 2011 did.
Scope and benefits of a “Coastal Carbon Observing Network”
WHOI scientists are working with fishing communities toward a coastal carbon observing network made up of fishing vessels with the latest ocean technologies.
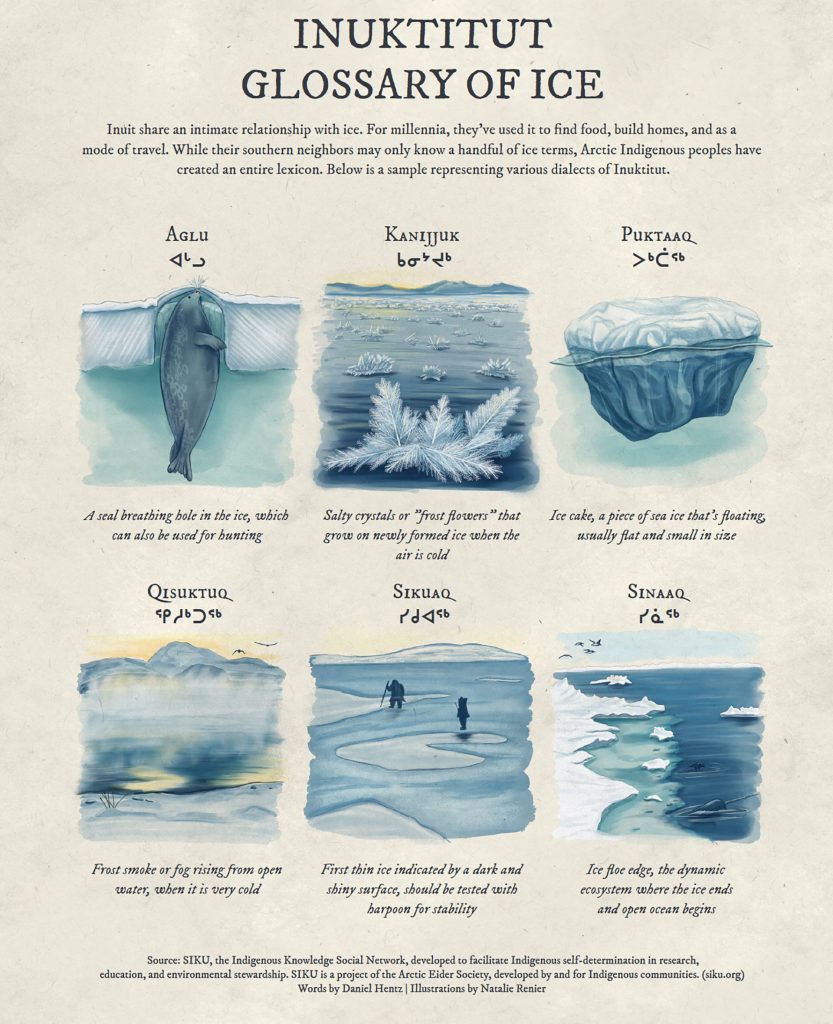
Inuktitut Glossary of Ice
Inuit have created an entire lexicon of words for ice, here are a few examples.
Infographic depicting radioactive decay chains
All radioisotopes lose energy by emitting ionizing particles such as neutrons, protons, electrons, or photons. Each change follows a unique timetable, or half-life.
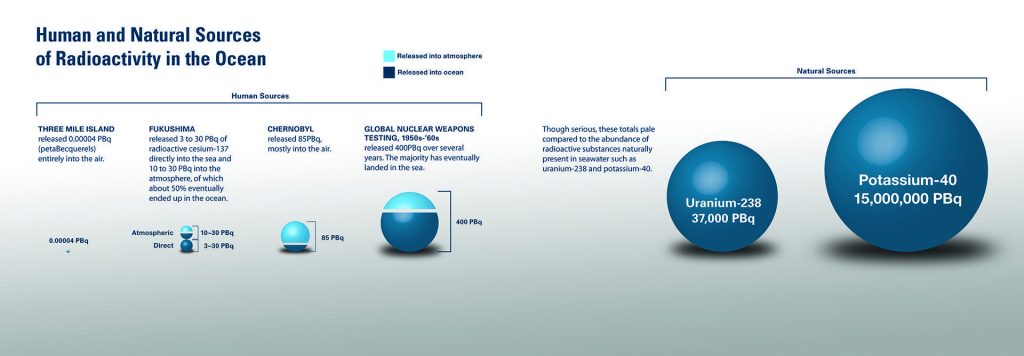
Comparison of radioactivity sources in the ocean
The background level of radiation in the ocean varies around the globe. The primary source has been nuclear weapons testing in the Pacific Ocean.
What goes into a HAB forecast?
Harmful algal bloom (HAB) forecasts rely on a combination of satellite data, water samples, and predictive modeling to track the proliferation of toxic algae, essential for protecting coastal ecosystems and public health.
Arctic ecosystem
This abundant ecosystem supports large predators like walruses, polar bears, and whales.
The Biological Pump
The biological pump converts greenhouse gas that warms Earth climate into organic carbon that is then stored in the depths of the ocean.
How subterranean water seeps into the continental shelf and into the ocean
When the ice sheets melted, sea levels rose, submerging former coastlines. Aquifers once under land now lie beneath the ocean on the continental shelf.
Jet Fuel from Algae?
Scientists have explored a way to make two types of fuel—biodiesel and jet fuel from different compounds in a single type of algae.
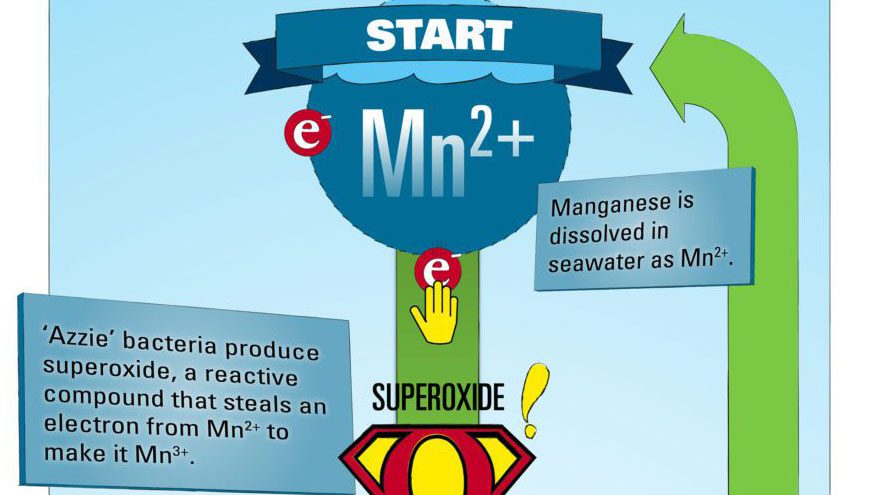
Two Chemical Roads Diverge in an Open Ocean illustration
An exploration of how and why manganese oxide deposits form in the environment
What goes into a HAB forecast?
Harmful algal bloom (HAB) forecasts rely on a combination of satellite data, water samples, and predictive modeling to track the proliferation of toxic algae, essential for protecting coastal ecosystems and public health.
Arctic ecosystem
This abundant ecosystem supports large predators like walruses, polar bears, and whales.
The Biological Pump
The biological pump converts greenhouse gas that warms Earth climate into organic carbon that is then stored in the depths of the ocean.
How subterranean water seeps into the continental shelf and into the ocean
When the ice sheets melted, sea levels rose, submerging former coastlines. Aquifers once under land now lie beneath the ocean on the continental shelf.
Images
FEATURED
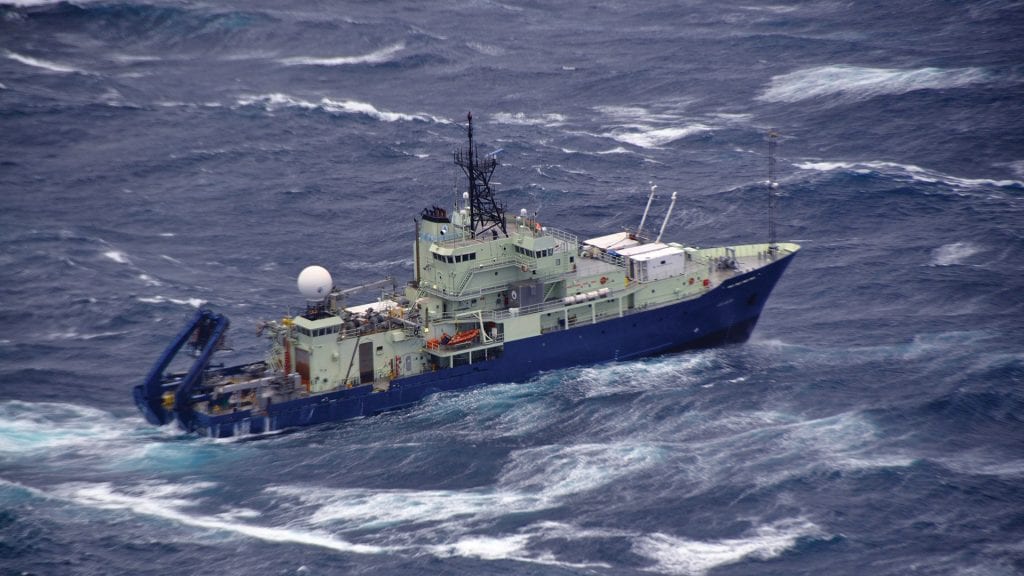
A tenacious ship pushes forward
R/V Atlantis rides out stormy seas in the North Atlantic during NASA’s Aerosols and Marine Ecosystems Study (NAAMES) cruise to study the processes associated with the world’s largest phytoplankton bloom. This image was shot from the NASA C-130 aircraft during a storm at the end of the expedition. (Photo by John Hair, NASA)
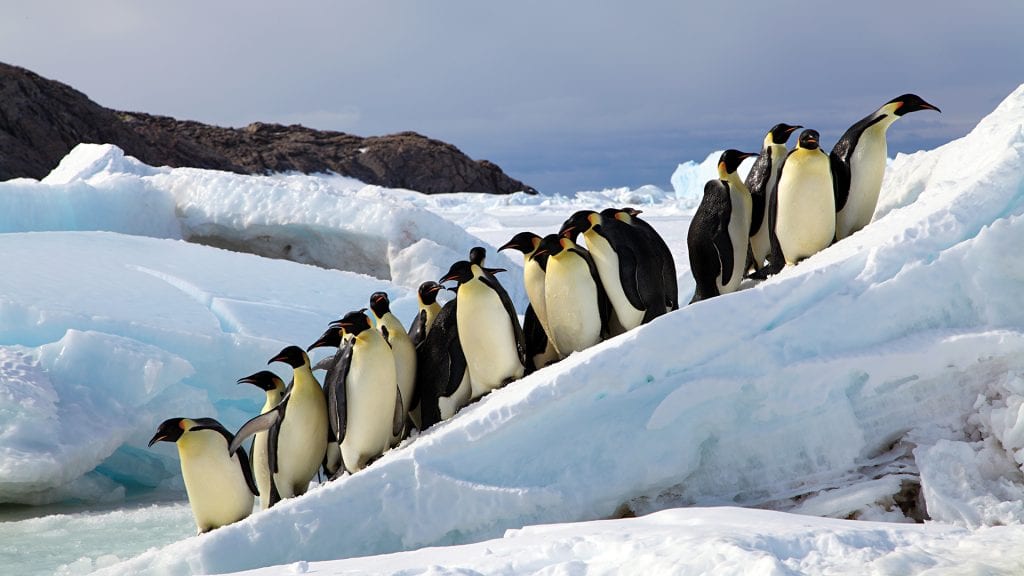
A tipping point
Emperor penguins (Aptenodytes forsteri) are the largest species of penguin and one of the most…
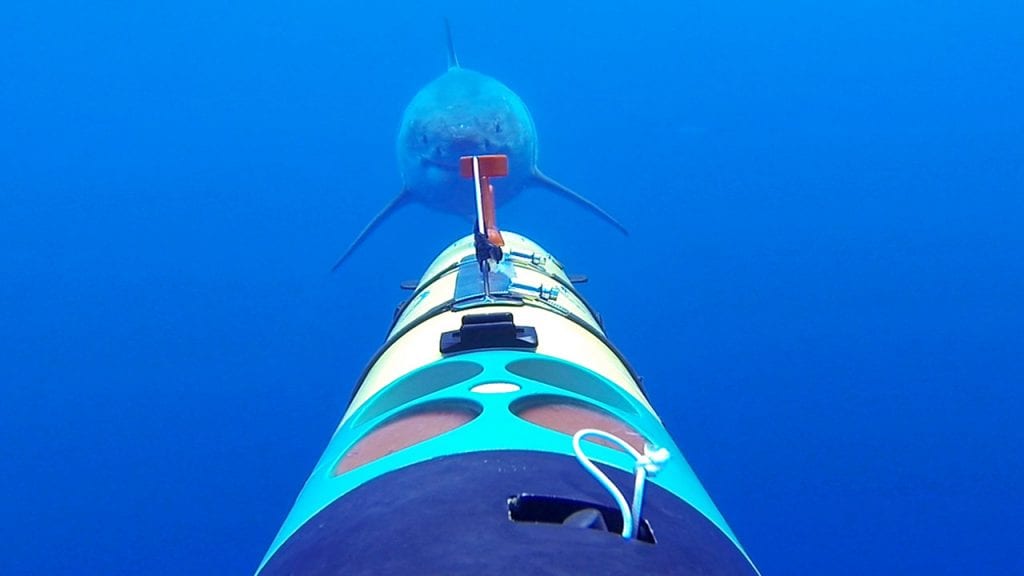
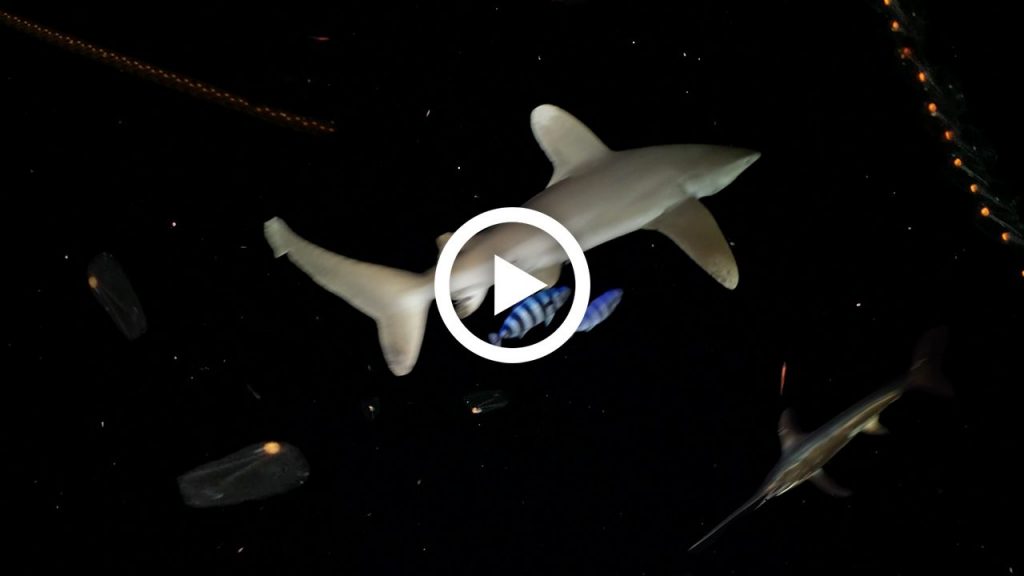
SharkCam
SharkCam, a customized REMUS robot, follows and films a great white shark by tracking acoustic signals sent from a tag affixed to the shark’s upper fin.
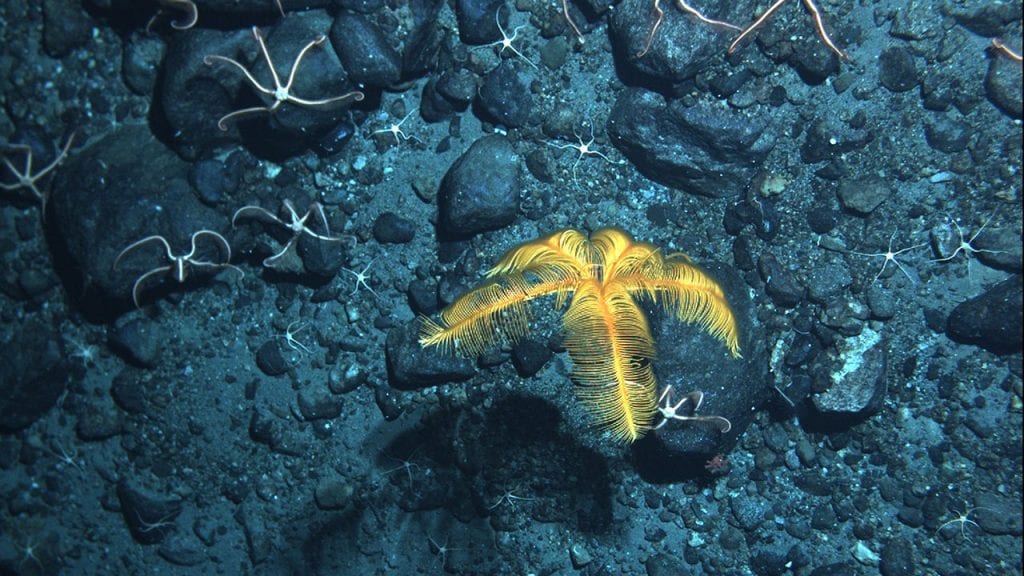
Stars and Stripes
A golden feather star raises its arms to feed. Behind, brittle stars are perched across…
Hitching a Ride
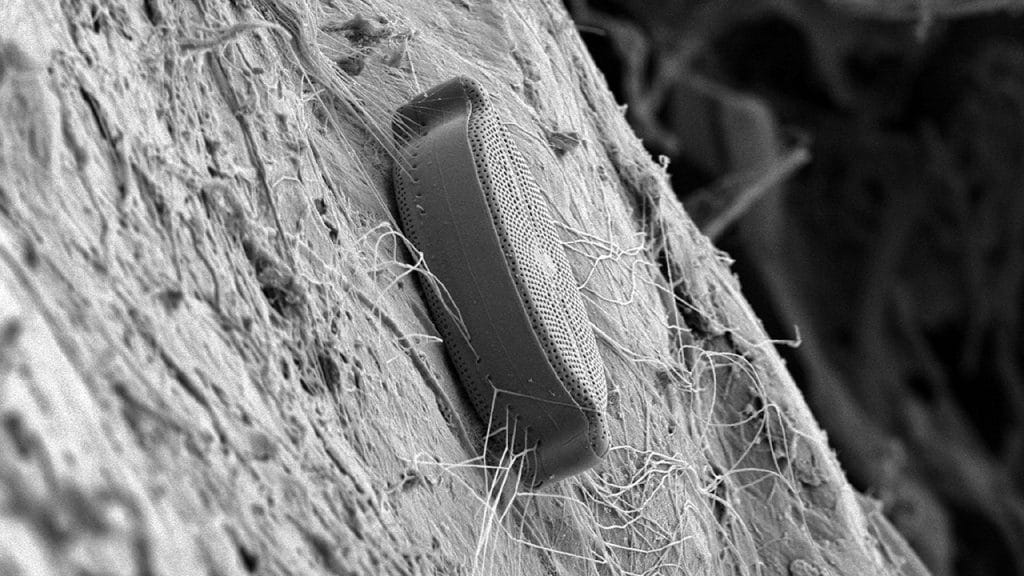
An image from a high-powered microscope reveals a microbe that has colonized a microplastic fragment collected in…
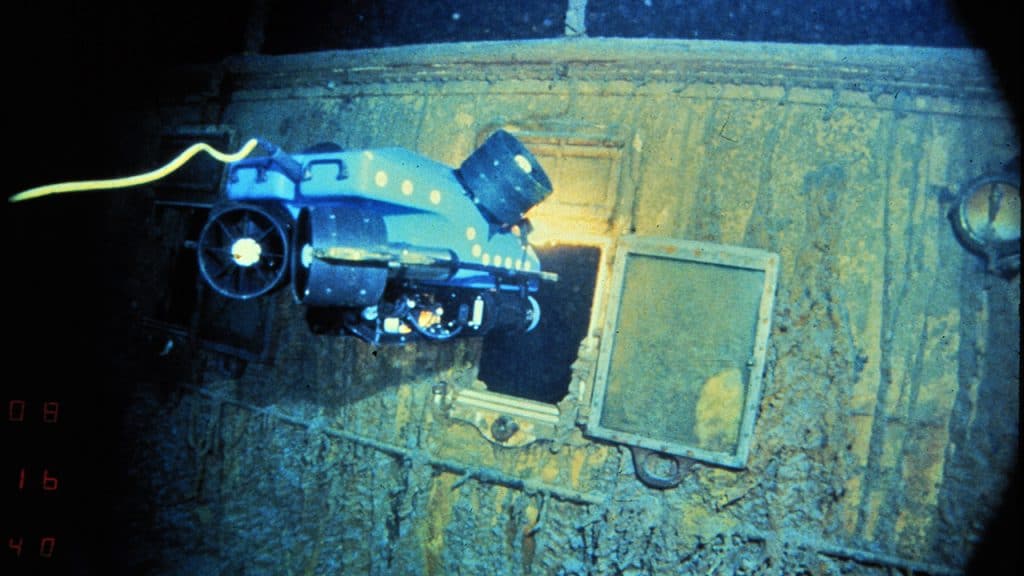
Robotic Trailblazer
Shortly after a WHOI-French-led expedition found the wreck of Titanic on the seafloor in 1985,…
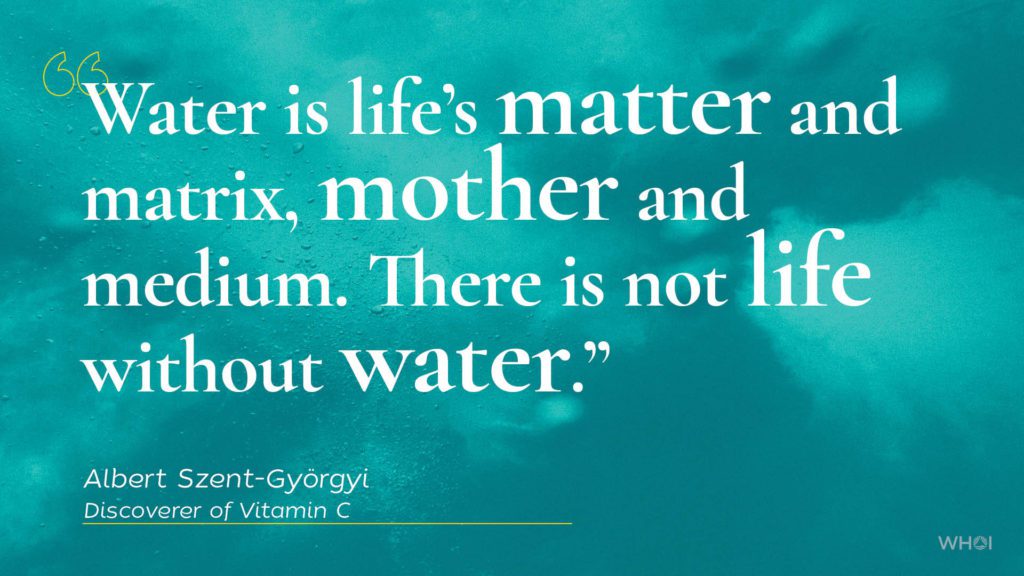
Albert Szent-Györgyi
Albert Szent-Györgyi was a Hungarian-born scientist who spent much of his career at the Marine…
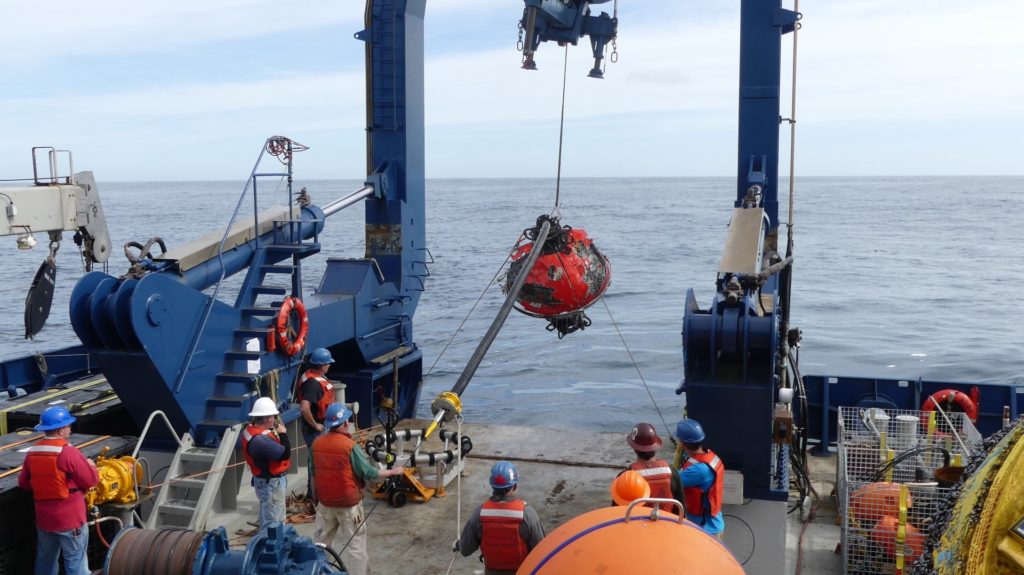
Sphere implosion
A crushed subsurface flotation sphere is pulled from the Southern Atlantic Ocean in 2018. As…
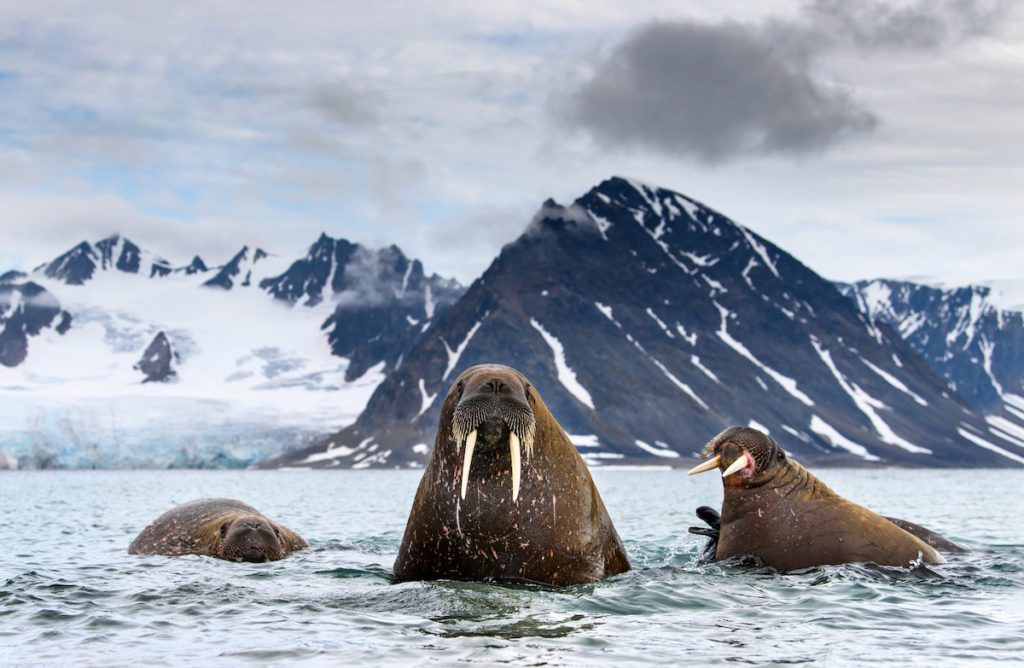
Spitsbergen Walruses
While observing walrus from the shore of Amsterdam Island in Spitsbergen, Norway, several males kept…
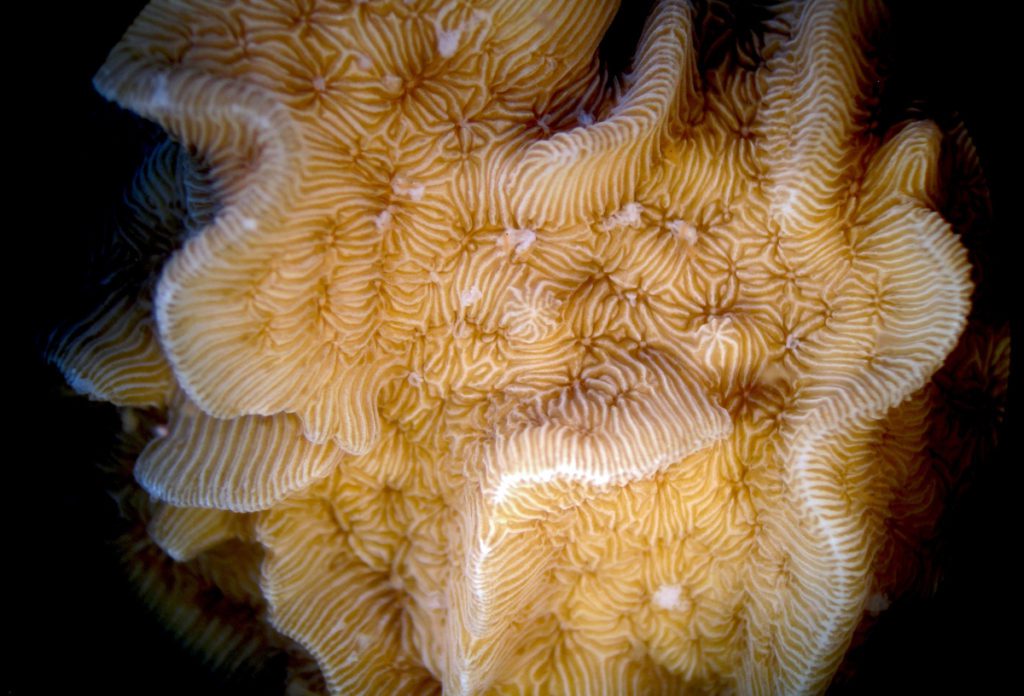
Coral Landscape
It’s not a mountain landscape viewed from above. It’s actually Pavona varians, or “corrugated coral,”…
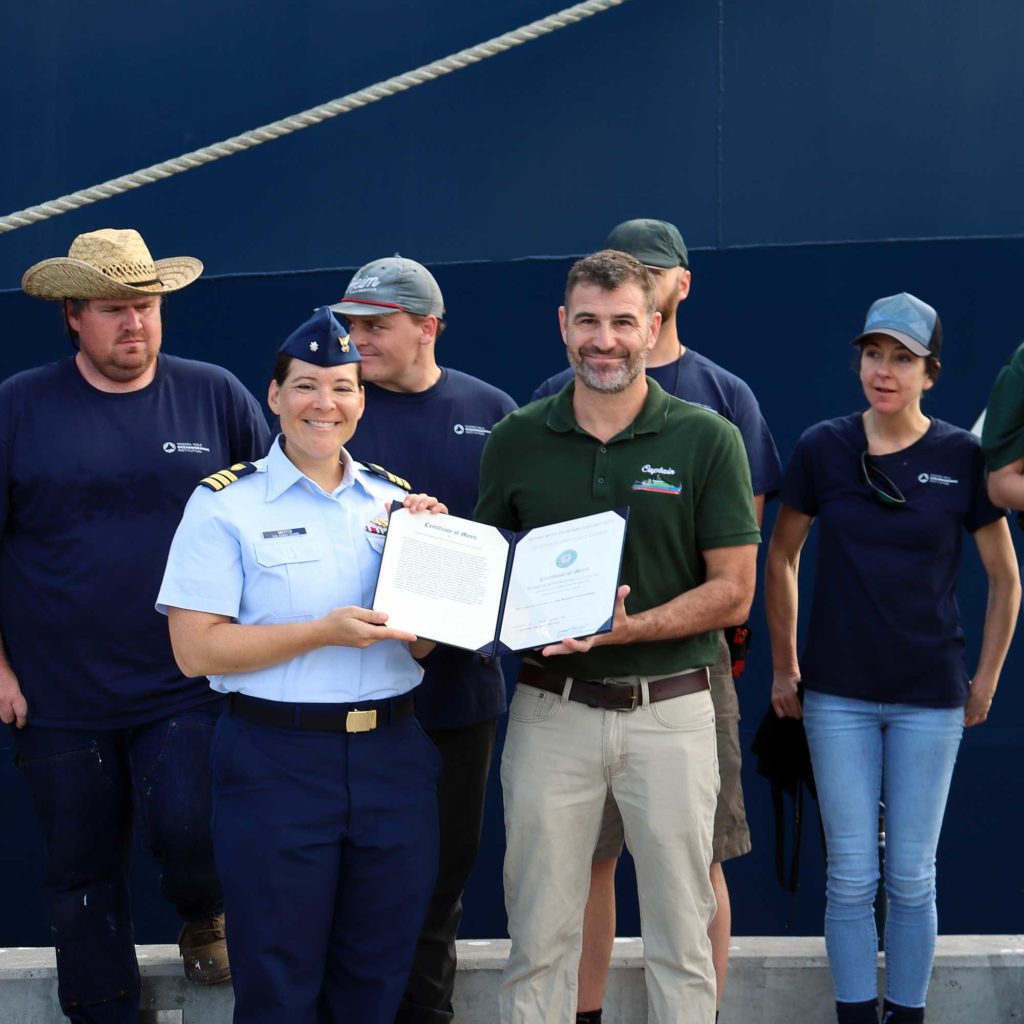
R/V Atlantis recognized by US Coast Guard
In the early morning hours of October 28, 2022, the WHOI research vessel Atlantis responded…
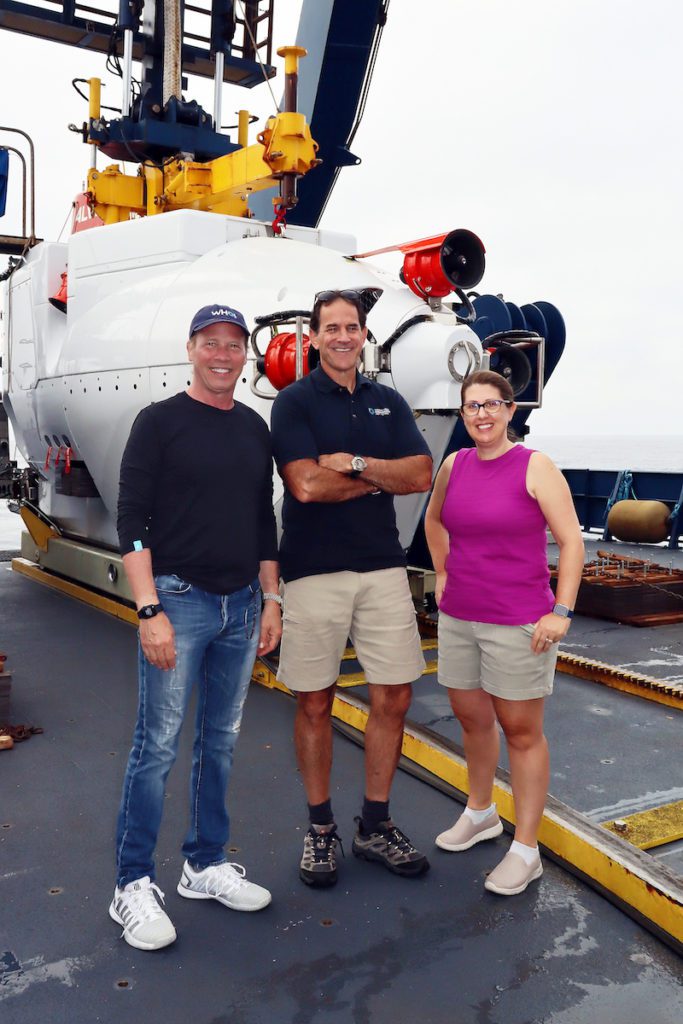
WHOI President and Director Peter de Menocal dives in Alvin
WHOI President and Director Peter de Menocal took his first dive in the research submersible…
Albert Szent-Györgyi
Albert Szent-Györgyi was a Hungarian-born scientist who spent much of his career at the Marine…
Sphere implosion
A crushed subsurface flotation sphere is pulled from the Southern Atlantic Ocean in 2018. As…
Spitsbergen Walruses
While observing walrus from the shore of Amsterdam Island in Spitsbergen, Norway, several males kept…
Coral Landscape
It’s not a mountain landscape viewed from above. It’s actually Pavona varians, or “corrugated coral,”…
Maps
FEATURED
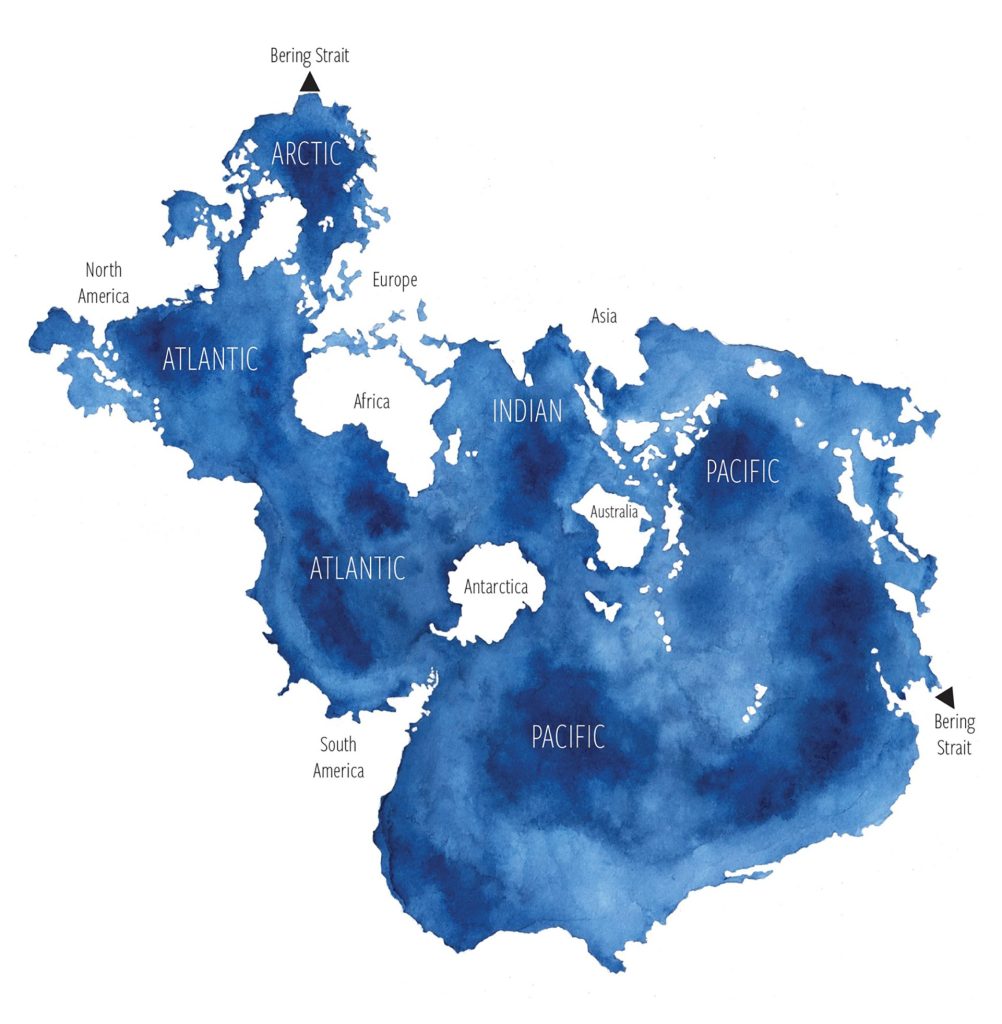
One connected global ocean
Watercolored map of the global ocean in the Spilhaus projection with regional labels
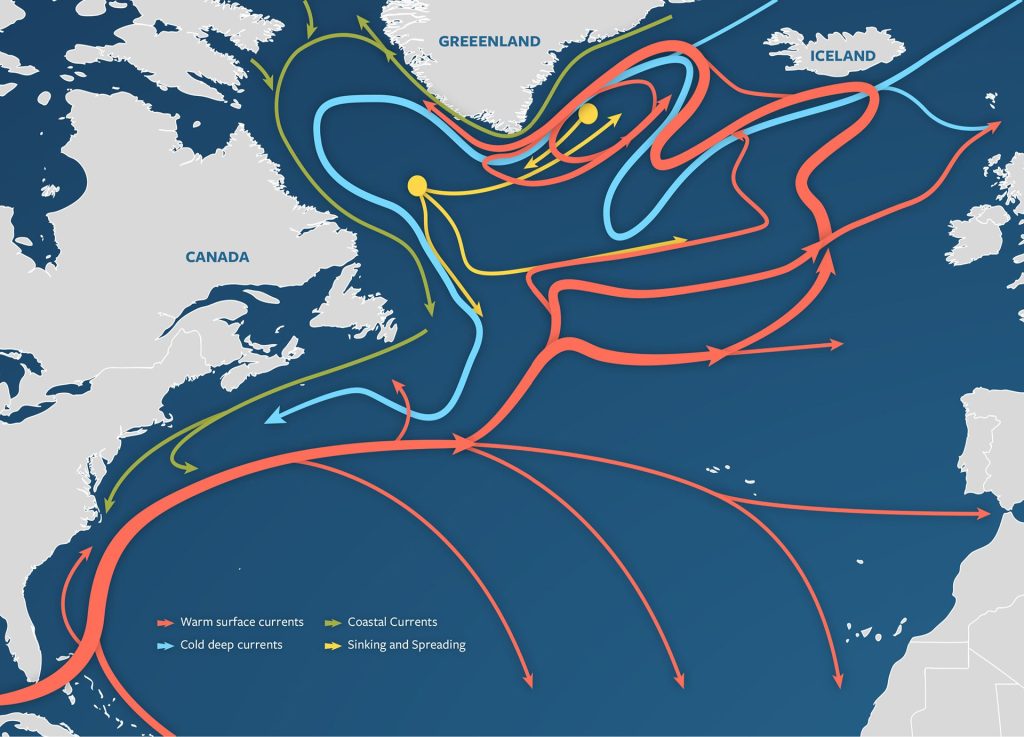
The Atlantic Meridional Overturning Circulation (AMOC)
Illustrated map of the AMOC, part of global thermohaline circulation, showing warm surface flow, deepwater currents, and key sinking and spreading sites.
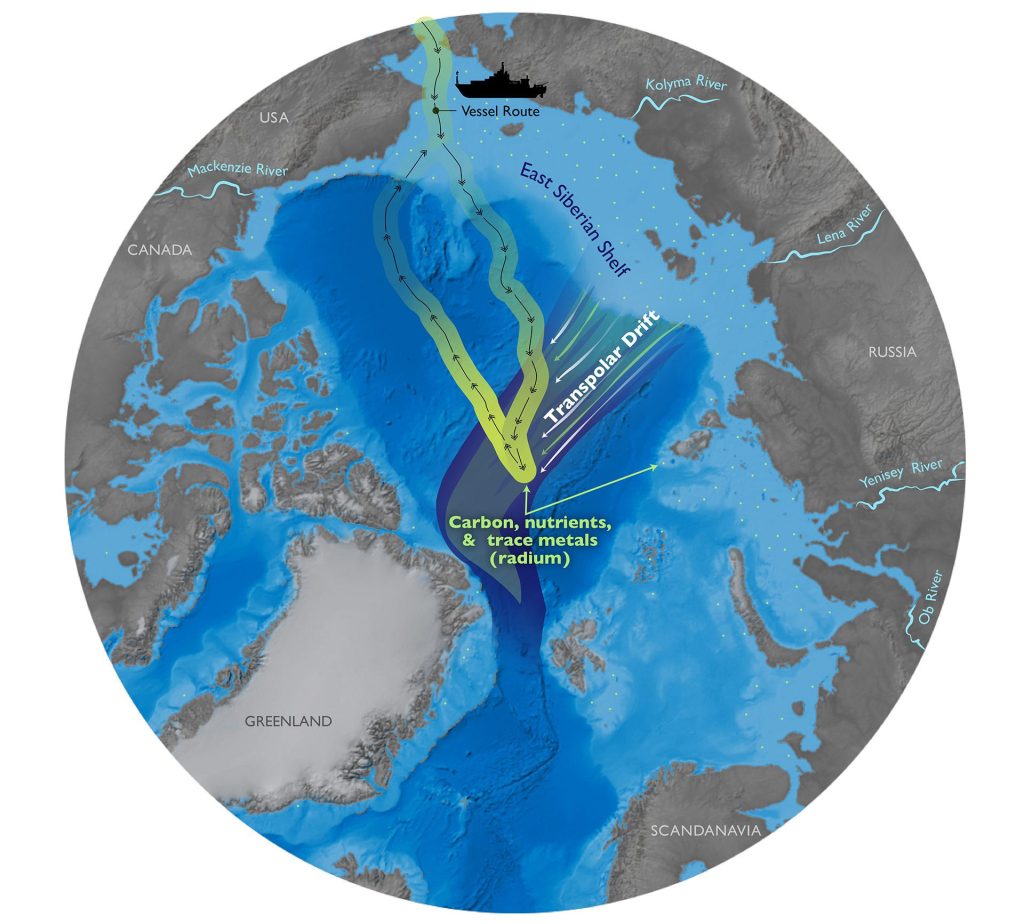
Radium rising signals arctic change
Arctic map showing vessel track and coastal transport sources for increased Radium levels measured offshore indicating changing climate conditions.
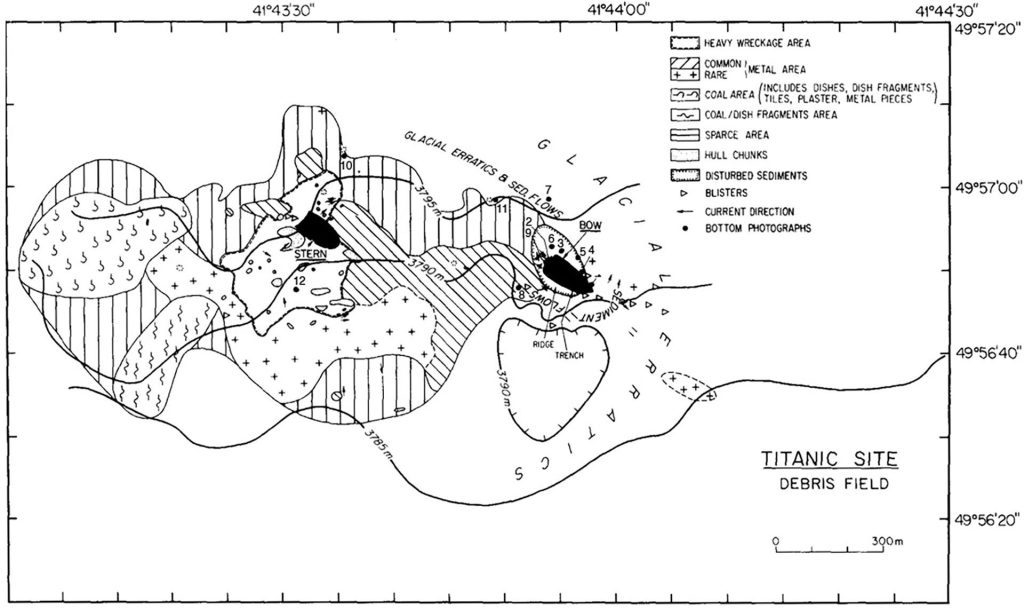
Titanic debris-field
First map of Titanic shipwreck debris field, provides a detailed layout of the scattered remains, seafloor/ocean characteristics and existing photographs.
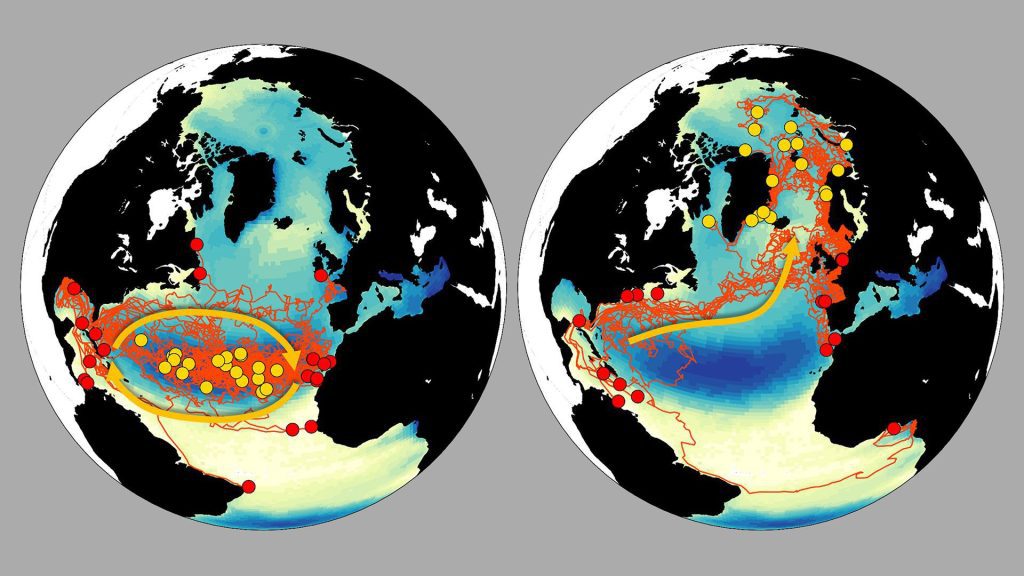
Transport of microplastics in the North Atlantic
Global maps illustrating how microplastics may travel through the North Atlantic and Arctic, based on global transport simulations.
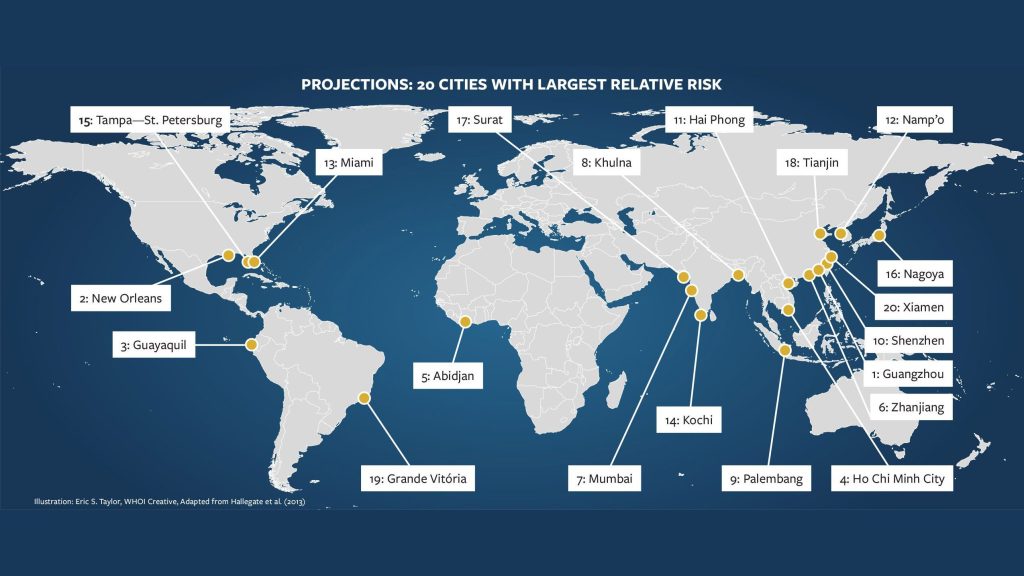
Cities and sea level impact
2013 map highlighting 20 cities projected to be at risk due to sea level rise.
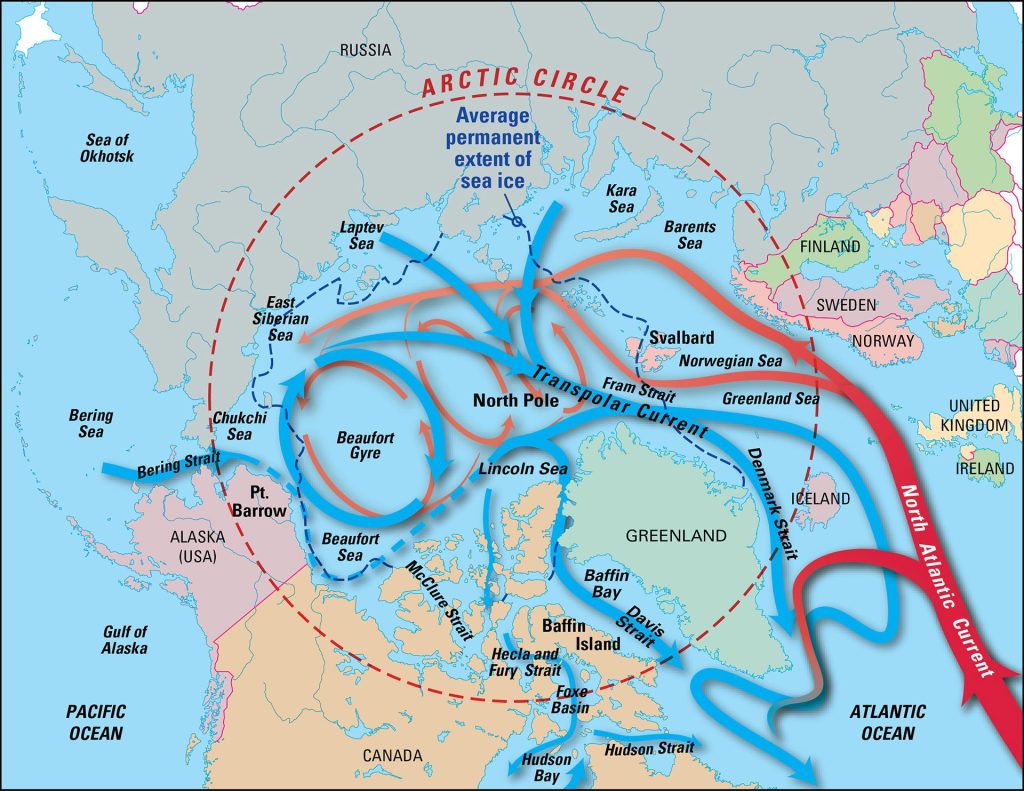
Arctic Ocean currents
Detailed map illustrating Arctic currents and the surrounding sovereign regions in flat projection.
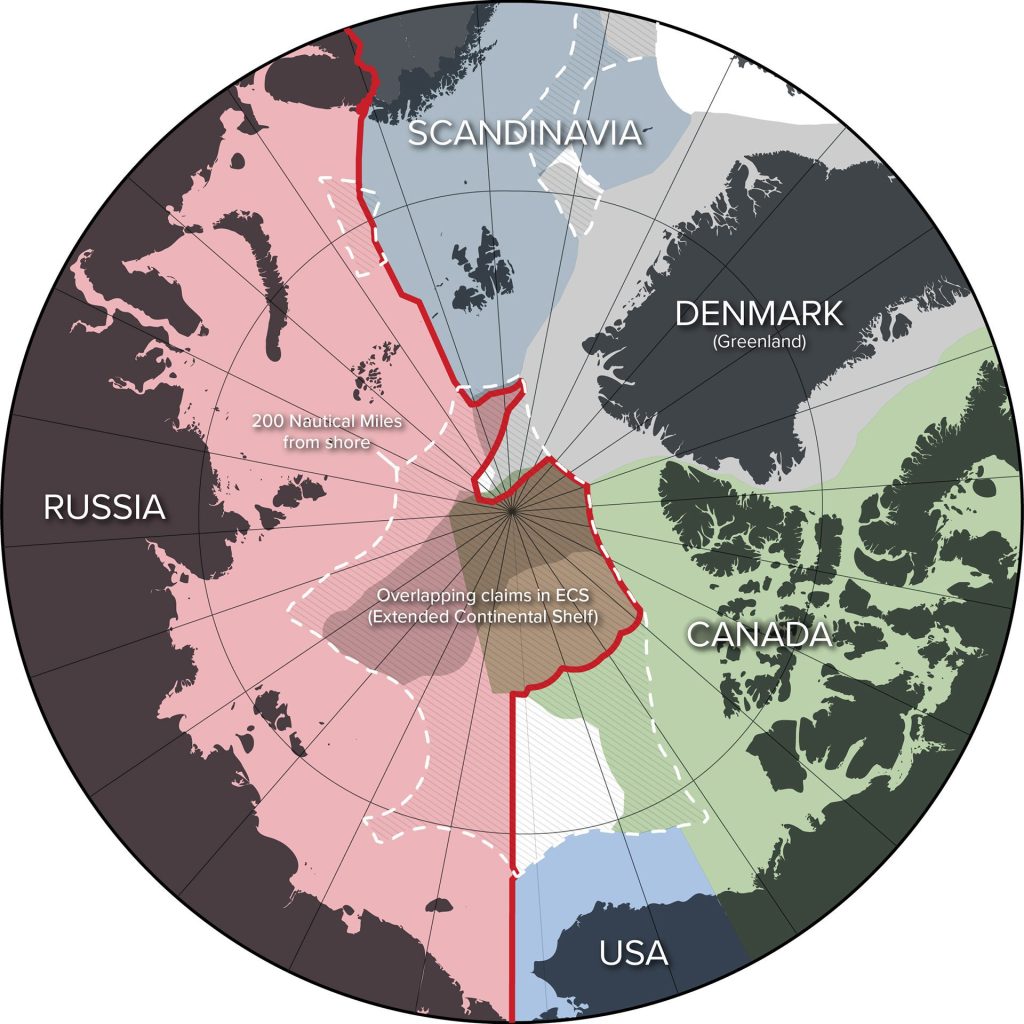
Territorial Arctic map
Multiple countries control territories within the Arctic circle, with Russia alone accounting for 53% of the Arctic coastline.
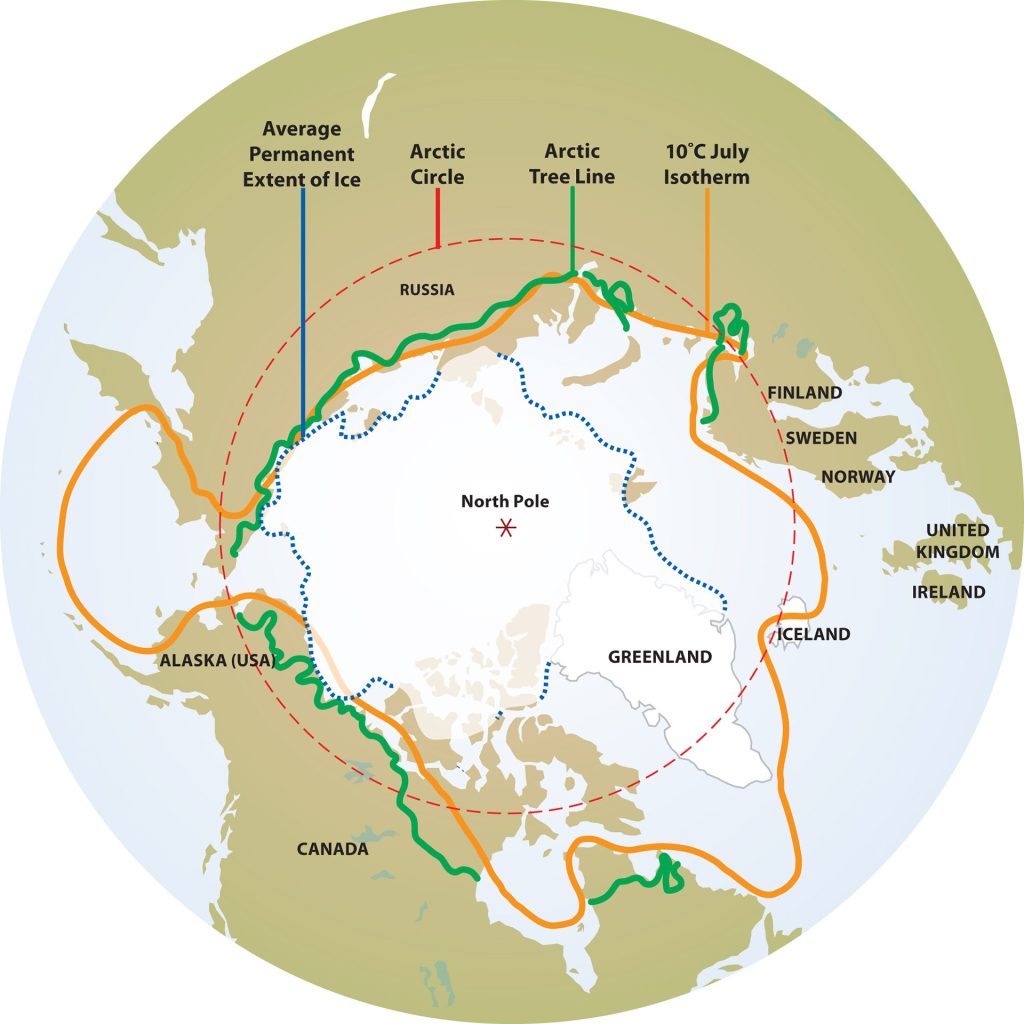
Boundaries of the Arctic region
Map showing Arctic boundaries including the Arctic Circle, tree line, July isotherm, permanent sea ice extent, and surrounding countries.
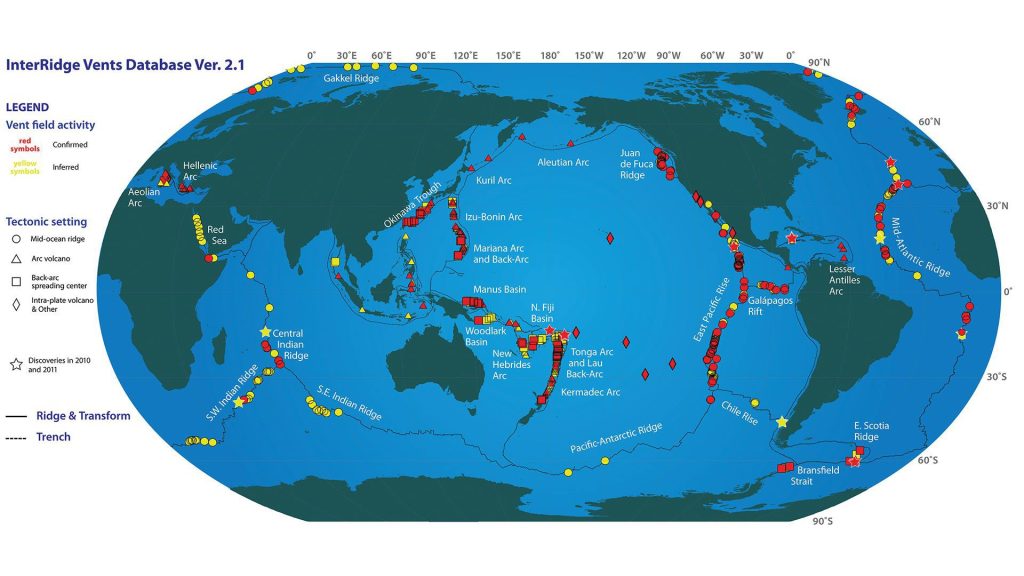
2011 global hydrothermal vents
2011 map showing the global distribution of hydrothermal vent locations, either suspected or confirmed.
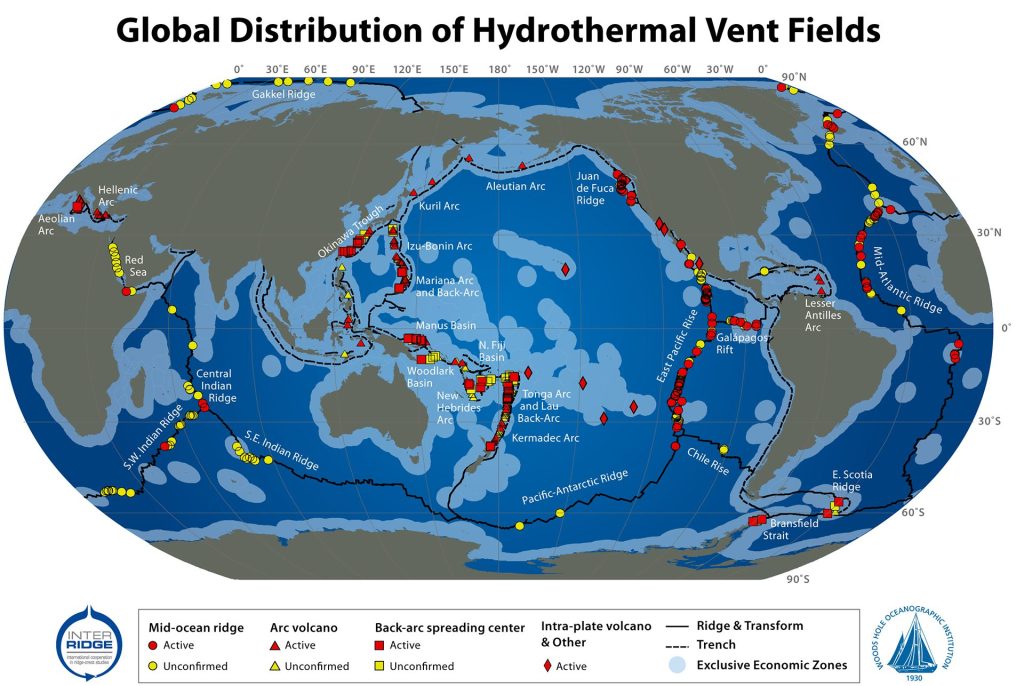
2009 global hydrothermal vents
2009 map showing the global distribution of hydrothermal vent locations, either suspected or confirmed.
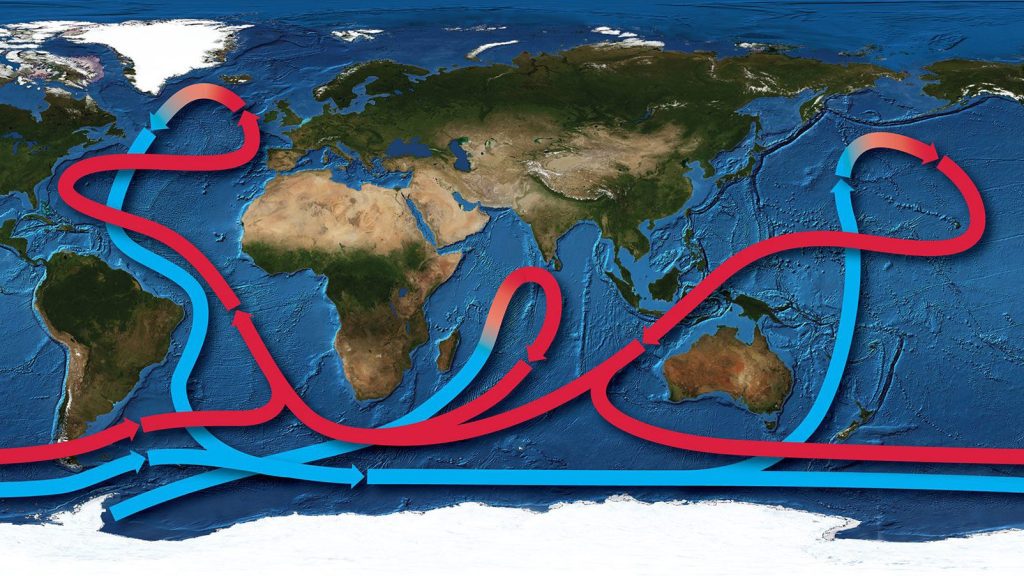
Global thermohaline circulation
Map with bathymetry and generalized ocean currents driven by temperature and density differences, forming the global ocean conveyor belt.
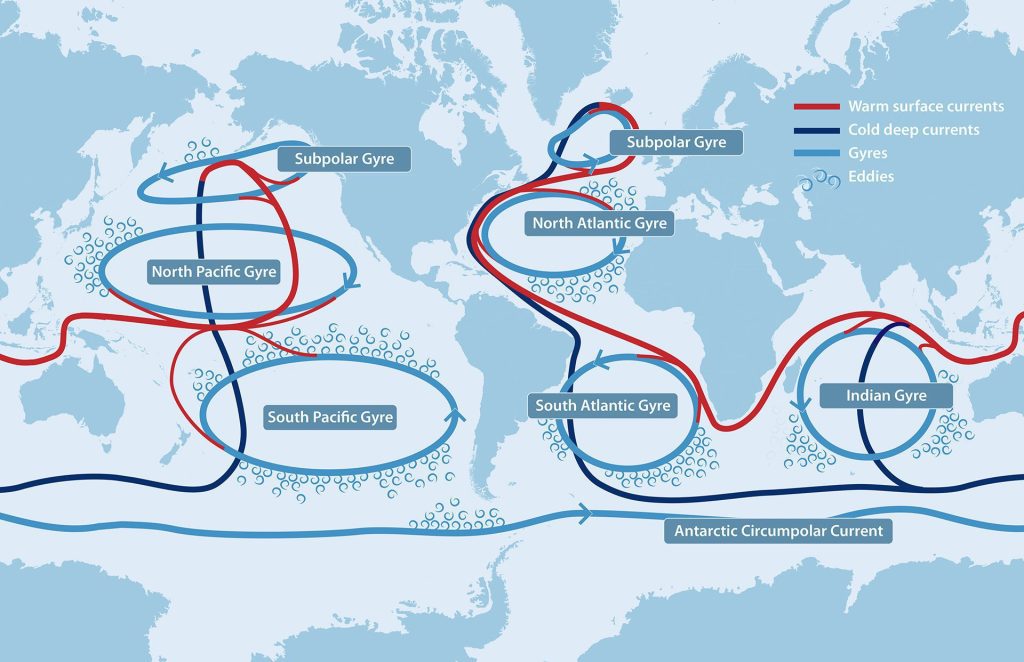
Ocean circulation roadmap
Illustrated roadmap of global ocean circulation, with temperature and flow shown as highways connecting gyre “roundabouts” across the world’s oceans.
Territorial Arctic map
Multiple countries control territories within the Arctic circle, with Russia alone accounting for 53% of the Arctic coastline.
Boundaries of the Arctic region
Map showing Arctic boundaries including the Arctic Circle, tree line, July isotherm, permanent sea ice extent, and surrounding countries.
2011 global hydrothermal vents
2011 map showing the global distribution of hydrothermal vent locations, either suspected or confirmed.
2009 global hydrothermal vents
2009 map showing the global distribution of hydrothermal vent locations, either suspected or confirmed.