
Image
Mapping an Iceberg
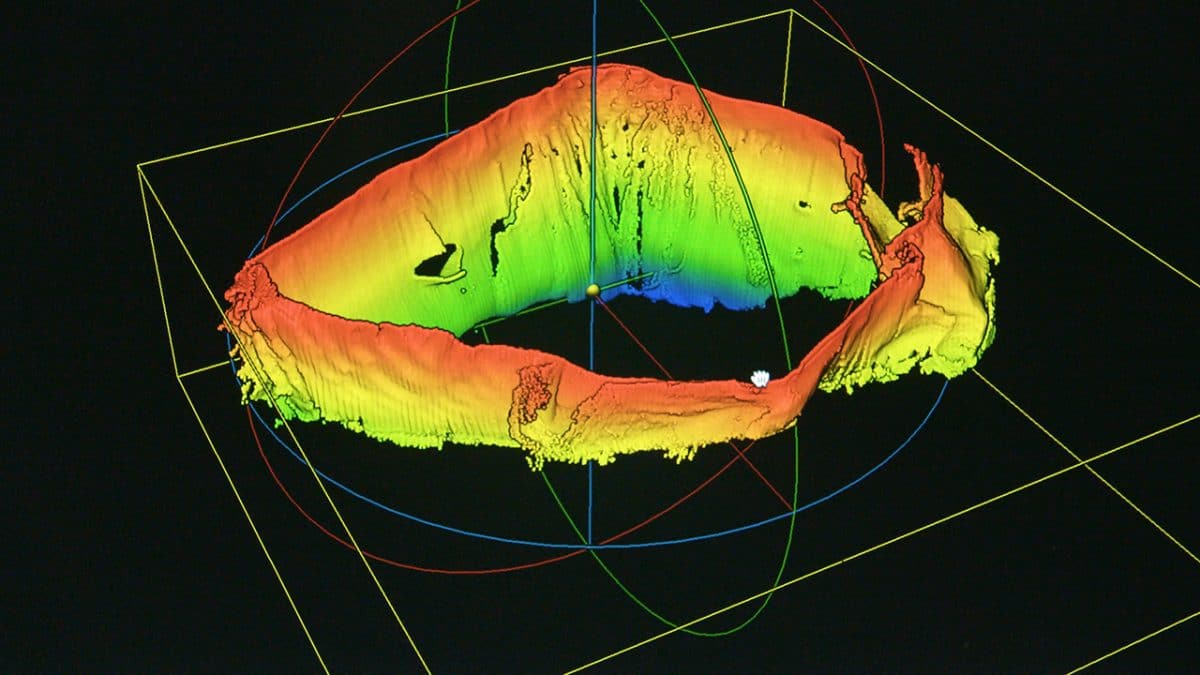
March 8, 2019This colorful image represents underwater (?) topography (?) of an iceberg in Greenland’s Sermilik Fjord. It was created using data from multifrequency sonar during the MIMEX (Mapping Iceberg Melting EXperiment) expedition in August 2018, co-led by physical oceanographers Claudia Cenedese (WHOI), Fiamma Straneo (Scripps Institution of Oceanography), and David Sutherland (University of Oregon). The red, yellow, green, and blue areas represent W, X, Y, and Z. Sutherland and his collaborators use images such as this one, taken at set time intervals, to estimate the rate of iceberg melting from their volume loss. (Photo by Daniel Cojanu, Woods Hole Oceanographic Institution)
Image and Visual Licensing
WHOI copyright digital assets (stills and video) contained on this website can be licensed for non-commercial use upon request and approval. Please contact WHOI Digital Assets at images@whoi.edu or (508) 289-2647.