I like looking at the massive array of processes in the ocean and how different things interact. You can’t treat the atmosphere, the ice, and the ocean as distinct components and understand what’s going to happen in the future. It’s all related. For example, how does a storm in one summer affect how heat is distributed later in the year? We need to understand the interactions to learn what’s happening now, and what’s going to happen in the future.
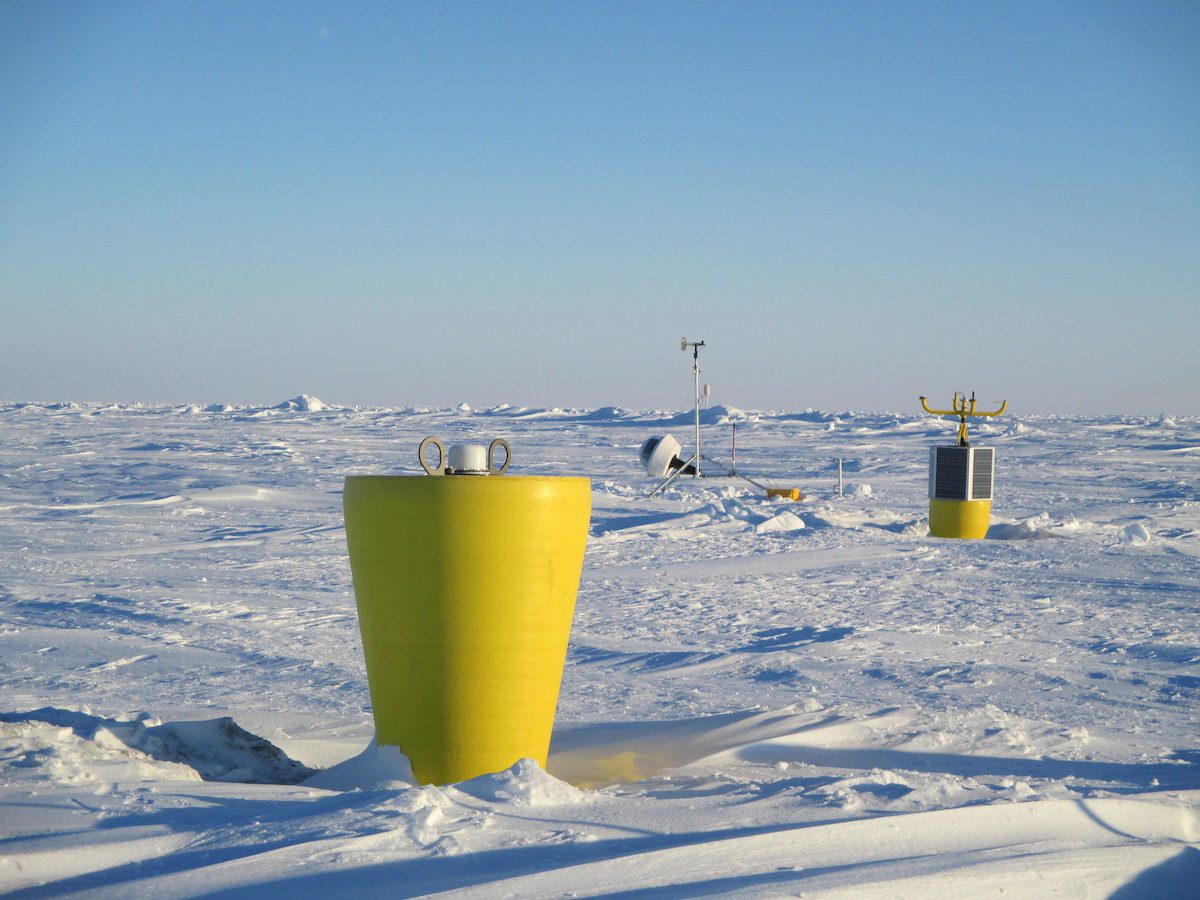
The Ice-Tethered Profiler (ITP) was designed to gather data from different depth levels of the ocean, year-round. An ITP moves with the ice, so you can’t tell it where to go, or how fast to get there. But because it moves with the ice, we can sample much closer to the ice-ocean interface and capture the mixing layer. The challenge with an ITP is that you don’t know where it’s going to end up–but you know it’s going to return something interesting. It could be a storm event, the eddy field, how the seasonality unfolded, or something to do with temperature. You have no idea until you get the data back.
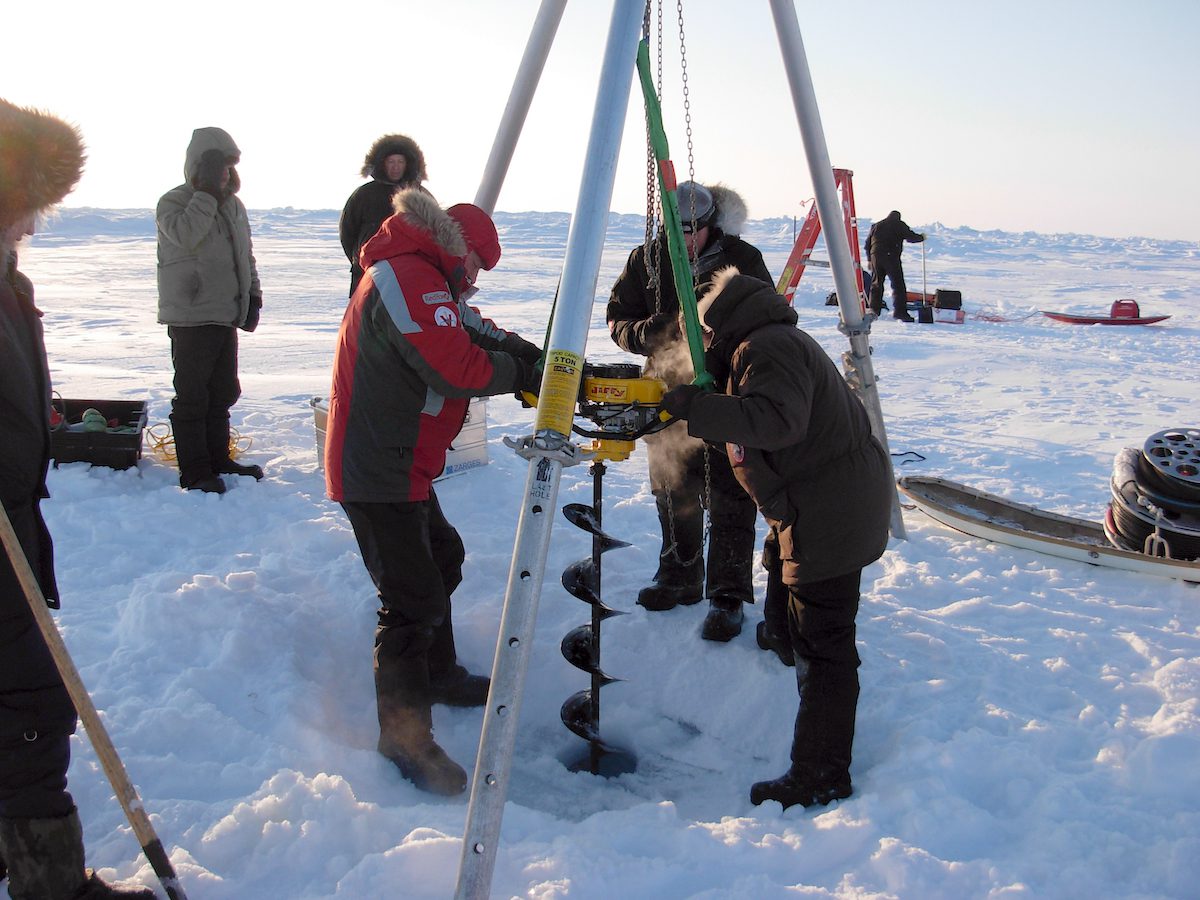
When ITPs were originally deployed in 2004 and 2005, you could reliably find a three-meter thick ice floe to go stand on and deploy them. And now we’re deploying on one meter or sometimes less–or we have to deploy them over the side of a ship without drilling a hole, into either open water or surrounded by really thin ice. So that has definitely changed over the 20-year record.
When people think of the Arctic, they think of the ice cover. Because you can literally see the ice from space, that’s how the fact that the Arctic ice cover is shrinking has made it into public knowledge. But I would say the fact that the Arctic Ocean is getting warmer is not common knowledge. We’ve really never been able to take a snapshot of the Arctic Ocean, never mind decades worth of daily snapshots. We’re getting glimpses of what’s going on in the ocean, but you have to put effort into putting the story together and saying, “Okay, well, is this different? And why is this different?”
The ITP program is a key resource about a part of our planet that we don’t observe very well. But it’s maddening because we always want more data. We’re continuously trying to improve the technology, too. Because if you’re doing the same thing in the Arctic ten years from now, you’re doing it wrong. The ice has changed, and the environment has changed, so the technology has to change too.


