
Ummenhofer, C. C., Sander, N., Wimberly, F., Gordon, H., Giacoppo, T., Münch, B., Bice, C., & Walker, T. D. (2026). Nineteenth century global wind data from historical New England whaling ship voyages (1820-1900 CE). Scientific Data. https://doi.org/10.1038/s41597-026-07437-3
Maritime weather data from historical ship logbooks are used to assess 19th century surface wind conditions. Housed across several New England archives, logbooks of U.S. whaling voyages contain systematic weather observations (e.g., wind strength/direction, sea state, precipitation) at (sub-)daily temporal resolution. Here, qualitative wind descriptions by the whalers from ~200 ship logbooks are quantified to generate a dataset with ~81,000 daily records of wind strength and direction en route and covering key whaling grounds in the Atlantic, Pacific, Indian, and Southern Ocean during the period 1820–1900 CE (Figure 1). Following extensive quality control, we find good agreement in wind strength and direction for the whaling records when compared with 20th Century Reanalysis winds for mean and seasonal conditions (Figure 2). For the North Atlantic with the densest coverage of whaling records, interannual variations in the basin-wide wind field associated with different phases of the North Atlantic Oscillation are also captured in the whaling records. Our results demonstrate that the historical records provide an important long-term context for maritime wind patterns in ocean regions lacking direct observational data during the 19th century. The dataset described in this study is available through the WHOI Library Dataverse at https://doi.org/10.26027/DATAWJBAVU.
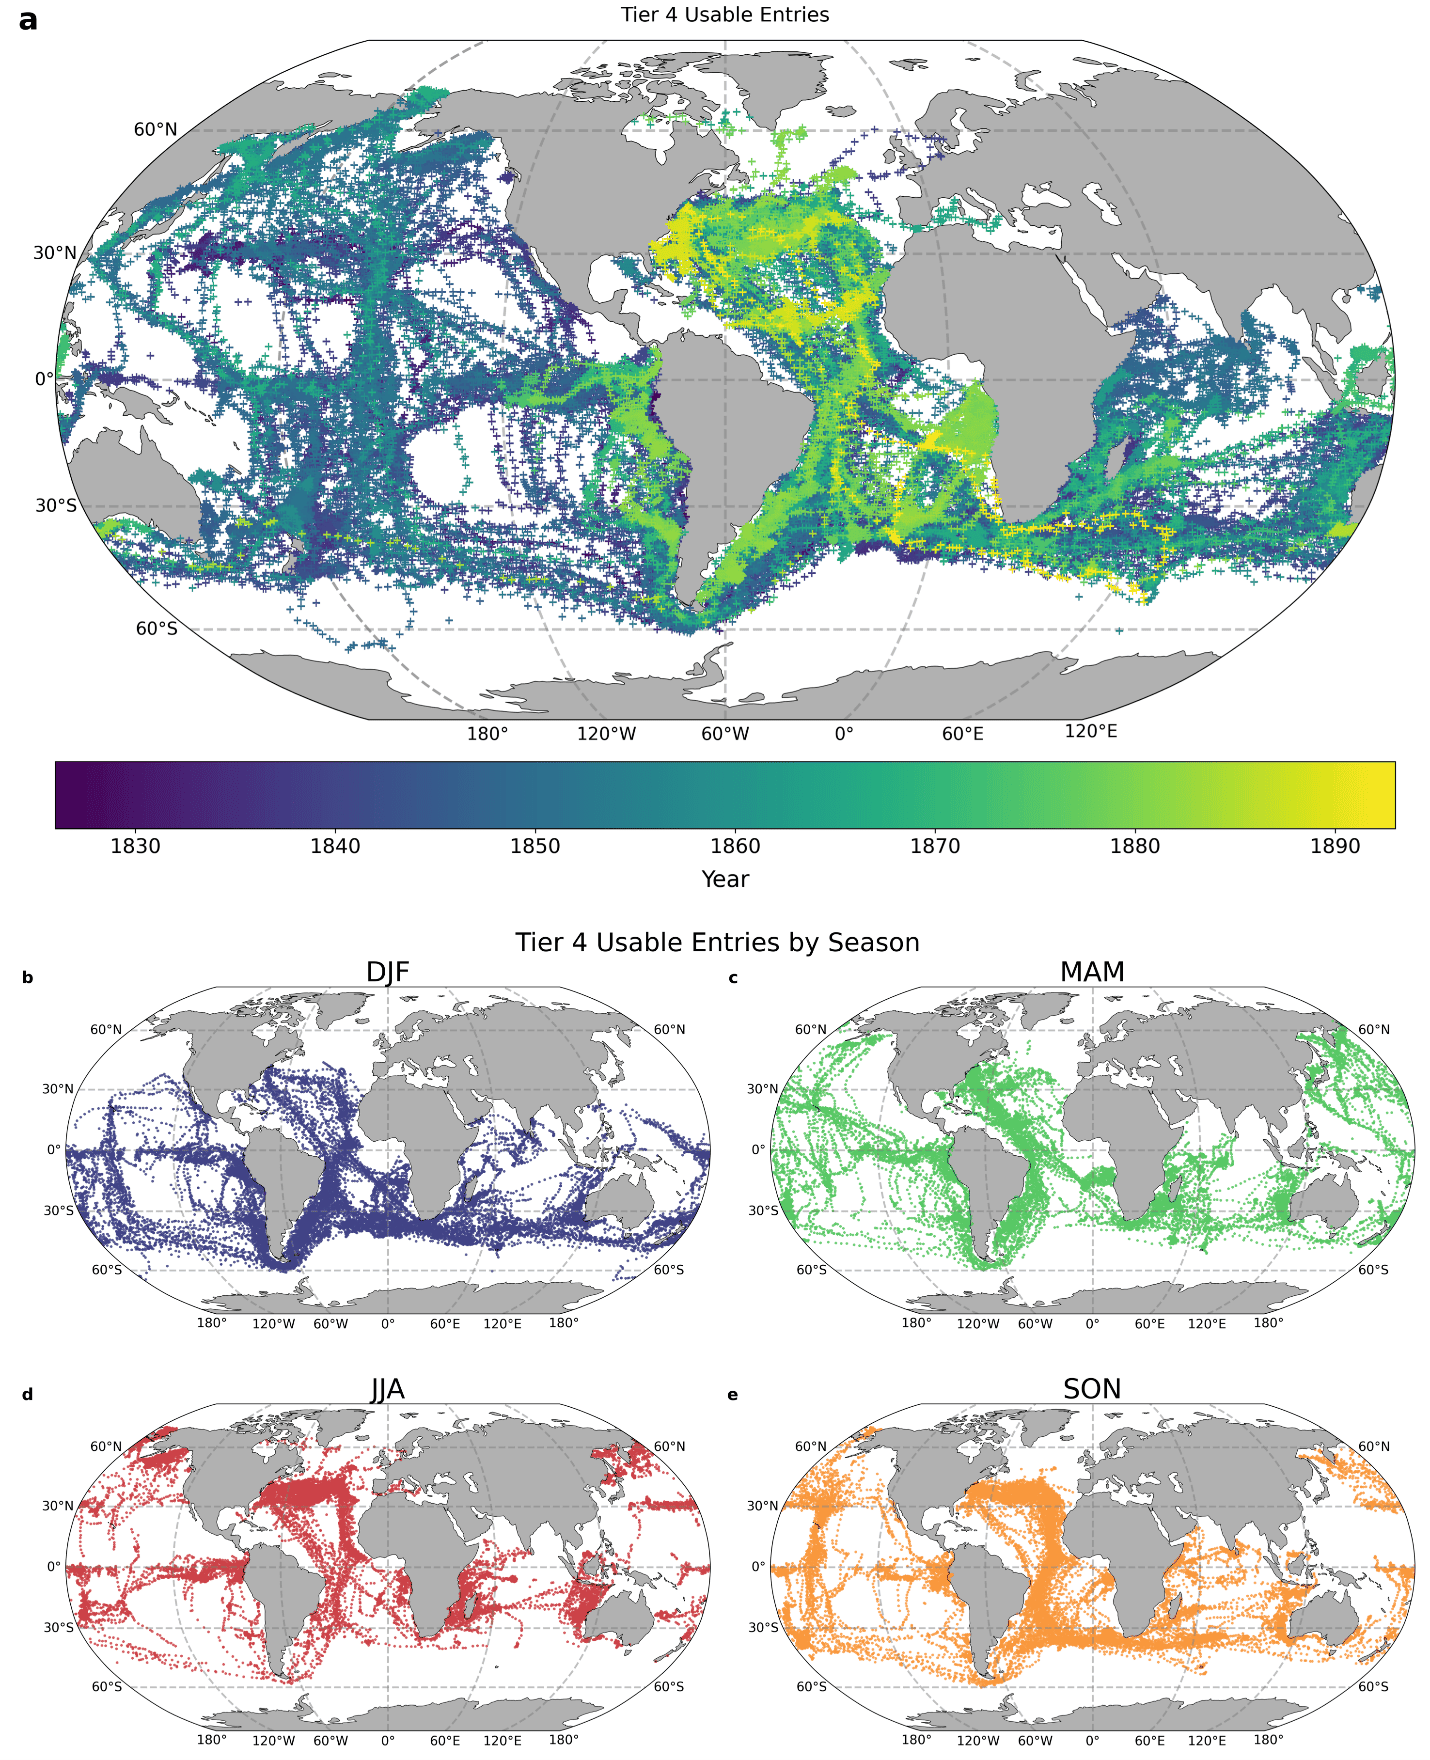
Figure 1: (a) Global plot of all usable daily wind records (i.e., 80,653 daily records in the Tier 4 dataset with infilling) retrieved from New England whaling voyage logbooks during the period 1820–1900 CE. Locations of usable wind records are colored according to the year. (b–e) Global plot with wind records sorted by season for (b) DJF with 21,656 daily records, (c) MAM with 19,243 daily records, (d) JJA with 18,602 daily records, and (e) SON with 21,152 daily records. [From Ummenhofer et al. 2026]
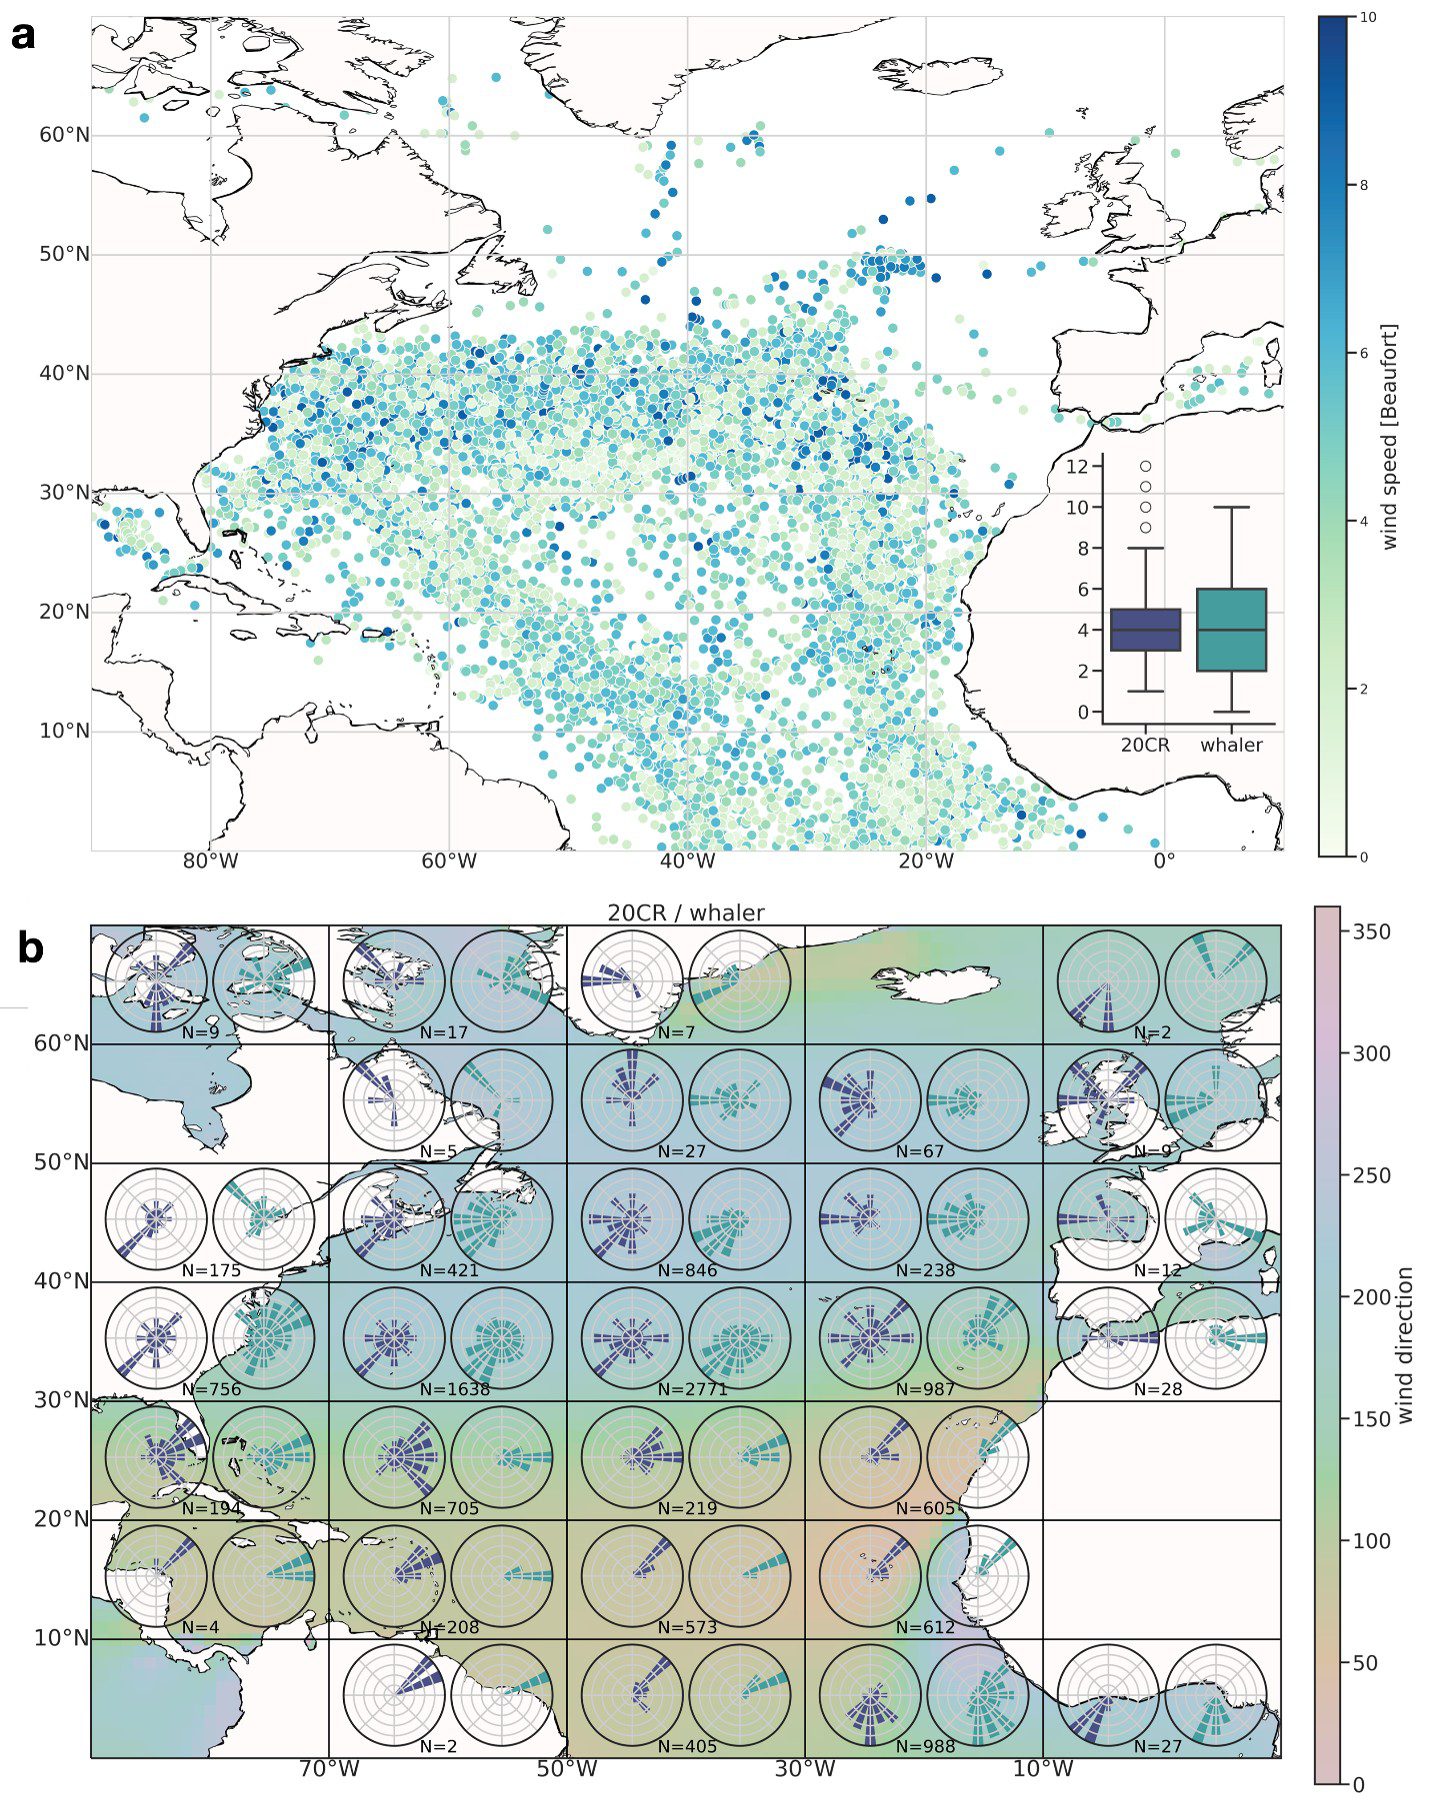
Figure 2: Comparison of usable daily wind records between whalers and 20CR over the North Atlantic. (a) Scatterplot of wind speed in Beaufort scale recorded by the whalers, with the box-and-whisker plot comparison of whaler wind recordings (green) to 20CR (blue) on the same days and for the nearest grid point in the individual 20CR ensemble members. (b) North Atlantic wind directions split into 20° longitude × 10° latitude boxes. The number of whaling records (N) with usable directional wind data available per box are indicated at the bottom of each box. Following meteorological convention, the blue (green) wind roses show the prevailing wind directions that the wind is coming from for 20CR (whaling) data. The background shading shows the long-term mean wind direction obtained from the 20CR for the period 1826–1913 CE. The 20CR wind speed/directional data in (a,b) is selected for the same days and for the nearest gridbox to the whaler wind recordings. [From Ummenhofer et al. 2026]