North Atlantic’s Transformation Pipeline Chills and Redistributes Subtropical Water
But it's Not a Smooth Process And it Mightily Affects Climate
December 1996 — Warm and salty waters from the upper part of the South Atlantic flow northward across the equator and then progress through the tropical and subtropical North Atlantic to reach high latitudes. Beginning with the intense northward flow of the Gulf Stream off the East Coast of the United States, these waters are exposed to vigorous cooling, liberating considerable oceanic heat to the atmosphere. This is the first stage of “warm water transformation within the North Atlantic, a process that culminates in the high latitude production of cold and fresh waters that return to the South Atlantic in deep reaching currents beneath the warm waters of the subtropics and tropics.
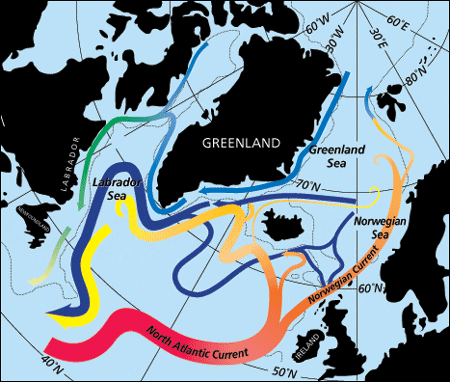
This article focuses on the part of this warm water transformation that occurs northwards of about 45°N, the subpolar realm of the North Atlantic. Here the warm waters brought to the area by the Gulf Stream flow eastward across the basin and then sweep northwards in the eastern Atlantic, continuing to cool, and freshening as precipitation and continental runoff exceed evaporation. This transformation occurs along two distinct pathways. The Norwegian Current carries part of the warm water flowing northward past Ireland into the Norwegian and Greenland (Nordic) Seas, while the subpolar gyre carries the rest westwards towards and past Greenland to the Labrador Basin.
The transformation from warm to colder water is a multi-year process: Wintertime winds cool the surface waters, causing them to convect or vertically overturn and mix progressively more deeply into the cooler waters beneath. This seasonal overturning creates large volumes of vertically homogenized water, called mode waters. In summer, the sun heats the surface waters, forming a cap of warmer water that effectively isolates the mode water from contact with the atmosphere. Surface cooling in the following winter removes the cap, and reexposes the mode water, which then undergoes another round of winter cooling in which it gains more thickness. The mode water thus cools and thickens progressively through consecutive annual reexposures to the atmosphere as it simultaneously flows counterclockwise around the subpolar gyre.
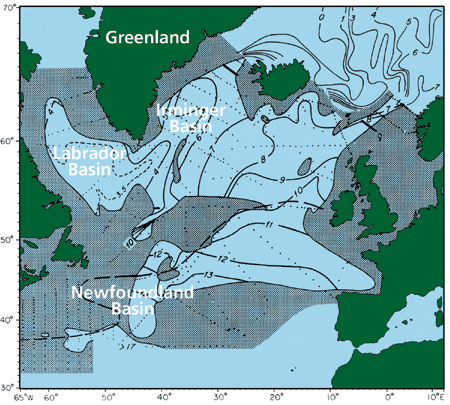
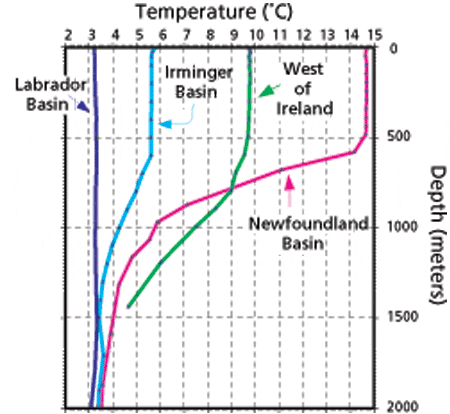
In winter data the seasonally exposed mode waters form a smoothly varying ring of progressively colder and more deeply convecting waters (see figure at right). Estimates of flow speeds in the subpolar gyre suggest a transit time of about a decade for a parcel of water that enters the transformation pipeline east of Newfoundland with a temperature of 12°? to 14°C, travels counterclockwise, and emerges from the pipeline in the Labrador Basin at temperatures colder than 4°C. The figure below right illustrates the great thickness of the regional convection in this mode water ring with temperature/depth profiles from the Newfoundland Basin where the ring begins, west of Ireland in the northward flow of the eastern subpolar gyre, in the Irminger Basin east of Greenland where flow is westward, and in the Labrador Basin where the mode water ring ends.
The process of heat liberation from ocean to atmosphere by water flowing along the pipeline acts as a regional radiator, particularly for northern Europe where the westerlies carry the heat extracted from the ocean. There is considerable evidence for interdecadal variability in this climate process. Our first evidence comes from the Labrador Sea where deep wintertime convective overturning constitutes the last stage of cooling along the transformation pathway and vertically homogenizes the water column to depths sometimes exceeding 2,000 meters, creating the so-called Labrador Sea Water (coolest profile in figure below).
The following article discusses the history of Labrador Sea Water (LSW). The figure below right shows the LSW temperature record overplotted with a smoothed version of the North Atlantic Oscillation index, an expression of the relative strength of the atmospheric westerlies (see NAO inset in Clara Deser article). The LSW temperature history shows a long period of warming from the 1930s to 1971 followed by cooling from 1972 to 1993, culminating in the 1990s with the coldest, freshest, and thickest LSW ever observed. This cooling trend, however, was interrupted by a brief warming in the late 1970s and early 1980s. Thus the first piece of evidence for climate change in the warm water transformation system is that the system’s end product, LSW, which in the figure opposite maps in winter 1962 as 3.3°C, shows interdecadal variability with temperatures as warm as 3.5°C in 1970, compared to as cold as 3.1°C forty years earlier and as cold as 2.7°C twenty-three years later.
Several agents interact to produce LSW. The LSW within the Labrador Basin has a “residence time.” The total volume of LSW is only partially replaced each year through the addition of transformed warm water and export of LSW from the Labrador Basin to the rest of the North Atlantic. To visualize this, imagine the Labrador Basin as a jacuzzi. Water is supplied to the tub at some temperature and at some rate, is well stirred and mixed in the tub, and that mix is drained away at a rate that matches the supply rate. The residence time is the volume of the tub divided by the rate of supply and is a measure of the time a given parcel of water spends in the tub before going down the drain, and thus is the average time the water in the tub loses heat to the overlying colder air. The temperature of the mixed water in the tub depends on the temperature history of the warm water being fed into the tub, the rate of that water supply, the residence time, and the rate of heat loss from the tub to the air above it. LSW temperature similarly depends first on the temperature history of the product emerging from the warm water transformation pipeline into the Labrador Basin plus the rate of that flow, and second on the history of the heat exchange between the Labrador Basin waters and the overlying atmosphere and surrounding ocean (sort of an uninsulated tub!). Other factors can influence such histories: Ice atop the jacuzzi alters how its tub temperature evolves; similarly, sea ice and upper ocean freshwater circulation can modify convective cooling in the Labrador Basin.
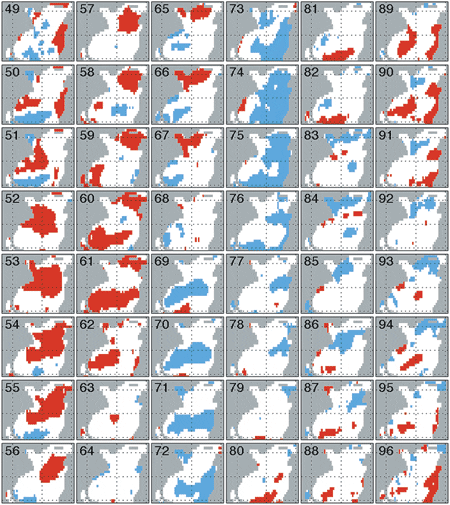
The second kind of evidence for climate change signals in the northern North Atlantic comes from sea surface temperature (SST) data. While such data ultimately represents just the skin of the ocean, it has the advantage of much higher data density in space and time than subsurface data, for it can be collected from ships of opportunity without requiring a specialized research vessel and in recent decades can be remotely sensed from satellites. SST is a quantity of great importance in heat exchange with the overlying atmosphere. With some care in interpretation, it can be linked to conditions beneath the sea surface. Clara Deser’s article discusses the overall regional northern North Atlantic SST history. Subpolar and northern subtropical SSTs were overall anomalously warm in the 1950s and 1960s. Winter SST data reveals that this general warmth involved warm SST anomalies propagating with the oceanic circulation. The figure below right documents the birth in 1951 of a warm winter SST anomaly east of Newfoundland (red patch) and traces its progression around the subpolar gyre in subsequent winters through 1968. In the late 1960s, a cold SST area develops in the subtropics near 40°N, propagates into the subpolar gyre with maximal extent in the mid 1970s, fades around 1980, and reestablishes in the mid 1980s. We call these SST “anomalies” because they represent departures from the long-term local temperatures.
Comparison of this interdecadal progression of warm and cold SST anomalies to the LSW temperature history shows provocative parallels: The post-World War II LSW warming trend occurs while the warm SST anomaly travels along the transformation pathway. The LSW cooling period beginning in 1971 coincides with substantial cold SST areas in the subpolar gyre, but that general coldness is interrupted by warmer SST anomalies in 1980-81, when the LSW cooling trend was also interrupted. Thus the second piece of evidence for climate change in the warm water transformation system: There are significant interdecadal winter SST anomalies in the subpolar gyre as a whole and in particular moving along the warm water transformation pathway. Periods of relatively warm SST anomalies along the transformation pipeline correspond to periods when LSW warmed, and periods of relatively cold SST anomalies to periods when LSW cooled. These observations suggest that the supply of transforming warm water to our Labrador Basin jacuzzi was running warmer in the 1950s and 1960s compared to the succeeding decades. To further that idea, a link between SST anomalies and the subsurface water undergoing transformation is needed.
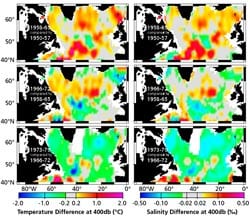
The third kind of evidence for variability in the northern North Atlantic climate system comes from subsurface hydrographic data, which allow us to link warm and cold winter SST phases to variability in the mode water distribution. The figure below shows temperature and salinity difference fields at 400 meters in the northern North Atlantic. This depth falls in the winter convection range of the mode water along the warm water transformation pathway (but below the depth of the seasonal warming cap), and thus periods of warm or cold 400-meter temperature correspond to the array of isotherms of the second figure from the top of this page shifting counterclockwise or clockwise, respectively. The fields in the figure below are constructed by subtracting the temperatures for one time period from the preceding time period and mapping the difference. Our search for systematic warming/cooling is reasonably successful for the period after World War II, but breaks down in more recent years because less data was collected in the 1980s. Although more measurements have been made in the 1990s, data generally takes several years to become available from data archive centers. The figure below shows that almost the entire subpolar region at 400 meters warmed in 1958-65 compared to 1950-57. Thus as the warm SST anomaly traversed the transformation pipeline, the deep winter convection temperatures were warmer than usual.
This warming trend continued in the more northern area through 1966-72, but reversed to cooling in the upstream part of the transformation pipeline between Newfoundland and Ireland. We attribute this to an influx into the pipeline of abnormally cold subtropical waters, which are visible in SST in 1969 to 1972, and to winter convection beginning to run abnormally cold. In the final panel of the figure above right we see that cooling has taken over almost everywhere, consistent with the continued propagation of the cold SST disturbance along the pipeline. Thus we find evidence that the supply pipeline of our oceanic jacuzzi has slow interdecadal variations of temperature, and that its warming and cooling trends are in phase with the trends of the jacuzzi tub water, the LSW.
So far, what we have described are several aspects of interdecadal variability of upper ocean signals and their linked behavior. Our fourth kind of evidence for changes in the northern North Atlantic returns to the LSW temperature history and the overplotted NAO index recorded in the fourth figure on this page. This index registered high values around 1950, declined to very low values in the late 1960s, then rose to very high values again in the early 1990s, indicating an interdecadal cycle of the basic index of the North Atlantic atmosphere’s mid-latitude climatic state. Dan Cayan of the Scripps Institution of Oceanography has shown that a high NAO index tends to enhance liberation of heat from ocean to atmosphere over the Labrador Basin while a low NAO index tends to diminish it. Extrapolating his results to this interdecadal time scale, the 1950s and 1960s, with NAO index declining, correspond to progressively reduced cooling over the Labrador Basin. Thus not only was our jacuzzi supply pipeline running warm, but less heat was escaping from the jacuzzi tub, that is, from the Labrador Basin to the overlying atmosphere. Thus the weakening westerlies reinforced the warming trend for LSW. Conversely, in the period of strengthening westerlies in the 1970s and 1980s, not only was the transformation pipeline running cold, but the loss of heat from the ocean to the atmosphere over the Labrador Basin was progressively enhanced, reinforcing the LSW cooling trend.
What we have described is a first step in this sort of climate change work: establishing interdependence in the climate system’s physical properties. The second phase is even more difficult and challenging than the first: How are those properties linked or physically coupled? Which “are in charge, so to speak? Is the ocean a passive participant, merely responding to atmospheric forcing changes, or do feedbacks from the ocean to the atmosphere force evolution of the atmospheric system’s climatic state? Certainly, there is a large heat release to the atmosphere involved in maintaining the mean state of climate in the North Atlantic region, and it makes sense that changes in the warm water transformation system ought to lead to changes in the overlying atmosphere. But the link between midlatitude SST anomalies and their potential forcing of climate change signals has been surprisingly elusive to theory and modeling efforts, and is, in fact, one of the primary unresolved issues in climate change research. You might say it is our “missing link.”
Continued measurements are essential to further progress in unraveling the signals and their underlying physics, both to monitor the evolution of the system and to sharpen understanding of the physics of specific elements. Two of us (McCartney and Curry) took the Institution’s Research Vessel Knorr to the subpolar gyre in fall 1996 to begin a concentrated two-year international effort directed at understanding the seasonal cycle of the warm water transformation pipeline of the eastern subpolar gyre.
Mike McCartney came to the Institution in 1973 with a mechanical engineering/ fluid mechanics degree, and the late Val Worthington supervised his on-the-job training in oceanography. His interests in the formation of higher latitude water masses and their subsequent circulation have taken him all over the world’s oceans, and he has been doing it long enough to personally observe the climatic evolution of his favorite water masses. His goal is to plan longer and more frequent cruises on his sail boat, where, unlike on research vessels, fancy equipment can be restricted to GPS navigation.
Ruth Curry came to Woods Hole in 1980 as a volunteer at-sea watchstander and “mud washer.” Sixteen years and many cruises later, the sea still holds its allure, but Ruth now sails as a Chief Scientist, measuring changes in water mass properties and ocean circulation in search of pieces to the global climate puzzle. Parenthood has changed her perspective somewhat going to sea used to mean no sleep, long hours, lousy food, and unpleasant working conditions, she says. Now it means getting more sleep than normal, having to think only about work, and getting all your meals cooked for you vacation!
Hugo Bezdek joined the Scripps Institution of Oceanography in 1970 following completion of a degree in physics. After four years of projects in underwater acoustics and air-sea transfer, he became a program manager at the Office of Naval Research (and ceased, he says, doing the actual work). In 1980, he moved to another administrative position as Director of AOML, a NOAA research lab that focuses on climate-related oceanography and meteorology. “During the last few years, he reports, “I have realized the error of my ways and have been struggling mightily to redress past sins and return to honest work once again. With the help of generous people such as my co-authors, perhaps such an eventuality is possible.
Slideshow
Slideshow
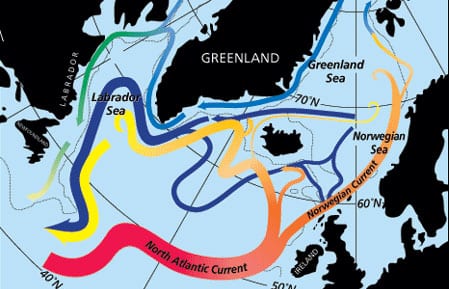
- The pathways associated with the transformation of warm subtropical waters into colder subpolar and polar waters in the northern North Atlantic. Along the subpolar gyre pathway the red to yellow transition indicates the cooling to Labrador Sea Water, which flows back to the subtropical gyre in the west as an intermediate depth current (yellow). In the Norwegian and Greenland Seas the red to blue/purple transitions indicate the transformation to a variety of colder waters that spill southwards across the shallow ridge system connecting northern Europe, Iceland, Green-land, and northern North America. These overflows form up into a deep current also flowing back to the subtropics (purple), but beneath the Labrador Sea Water. The green pathway also indicates cold waters--but so influenced by continental runnoff as to remain light and near the sea surface on the continental shelf.
- Temperature (°C) of the deep mixed layer near the end of winter in the areas where that depth exceeds 200 meters. It is based on hydrographic survey data recorded from 1957 to 1967
- Examples of the variation of temperature with depth from the stations used for the figure above.
- The history of temperature (circles and black line) of the Labrador Sea Water convecting in the central Labrador Basin to depths sometimes exceeding 2,000 meters. This is compared to the interdecadal march of an index of the North Atlantic Oscillation, with the reds indicating the high index periods of strong westerlies, and the blues the low index periods of weak westerlies. See the North Atlantic Oscillation inset box in the Deser article for an explanation of the high and low states of the "NAO". The NAO index plotted here is formed from the sea-level pressure difference between the subtropical Azores high pressure center and the subarctic low pressure center near Iceland. The authors thank James Hurrell (National Center for Atmospheric Research) for the latest updates of NAO index data.
- A time series of maps derived from winter SST measurements from 1949 to 1996. Pronounced warm SST anomalies are indicated by red and pronounced cold SST anomalies by blue.
- Maps of temperature and salinity changes for successive time periods at a depth near 400 meters in the northern North Atlantic. Reds and yellows indicate that the later of the two periods is warmer or saltier, while blues and greens indicate the later period is cooler or fresher. Gray areas indicate small salinity and temperature change. White areas indicate a lack of data.
