Labrador Sea Water Carries Northern Climate Signal South
Subpolar Signals Appears Years Later at Bermuda
December 1996 — Changes in wind strength, humidity, and temperature over the ocean affect rates of evaporation, precipitation, and heat transfer between ocean and air. Long-term atmospheric climate change signals are imprinted onto the sea surface layer—a thin skin atop an enormous reservoir—and subsequently to the deeper water masses. Labrador Sea Water is a subpolar water mass shaped by air-sea exchanges in the North Atlantic. It is a major contributor to the deep water of the Atlantic, and changes of conditions in its formation area can be read several years later at mid-depths in the subtropics. Mapping these changes through time is helping us to understand the causes of significant warming and cooling patterns we have observed at these depths in the North Atlantic and links the subtropical deep signals back to the subpolar sea surface conditions.
Labrador Sea Water (LSW) is the end-product of the transformation process, described in the preceding article, that modifies warm and saline waters through heat and freshwater exchanges with the atmosphere. In the last stage of this transformation, deep wintertime convection occurs in the Labrador Basin between North America and Greenland where strong westerly winds cool the surface waters, making them denser than the underlying deep water. Convection occurs when the denser surface waters sink and mix with the deep water to produce the cold, thick, and homogeneous LSW water mass.
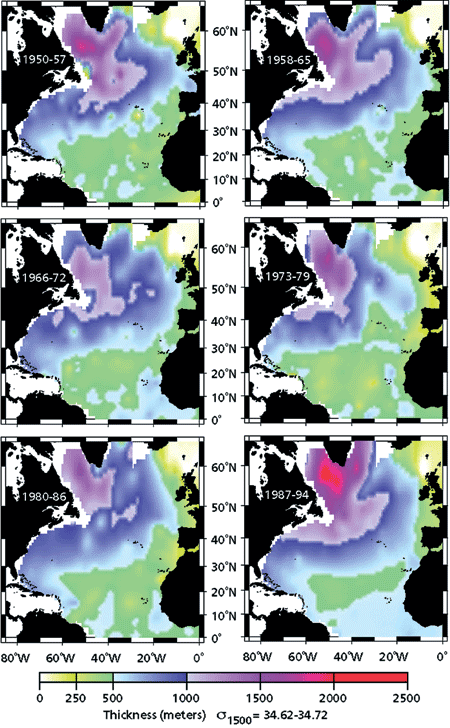
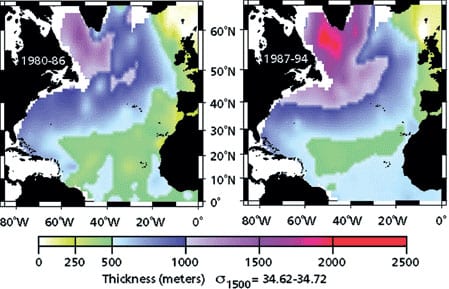
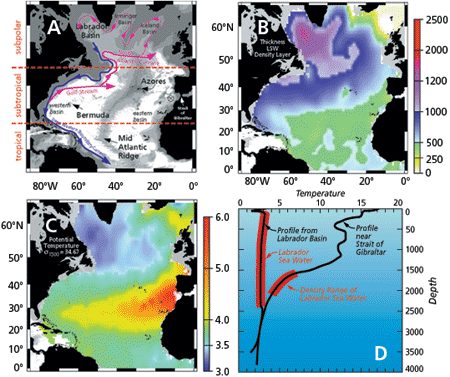
In the figure above right (top right panel-B) we use the thickness of the LSW mass to indicate its source region and the pathways along which it spreads. In the North Atlantic, the LSW is very thick, but as the circulation carries it away from the Labrador Basin, mixing with other thinner water masses progressively erodes its thickness. The intense pink colors of the two righthand figures opposite indicate thicknesses exceeding 2,000 meters in the LSW formation area. Purple colors show somewhat thinner LSW spreading northeast into the Irminger Basin east of Greenland, eastward via the North Atlantic Current into the Iceland Basin, and southwestward along the western boundary into the subtropical basin.
In this, the cold, fresh and thick LSW contrasts sharply to its neighboring North Atlantic water masses of the same density. A cool, salty, but very thin layer of Iceland-Scotland Overflow Water occupies the northeast corner of the map as the yellow-white colors on both thickness and temperature maps. The warm, very salty, and thin Mediterranean Overflow Water is represented by the green (thickness) and yellow-red (temperature) tongues extending across the North Atlantic from its source region at the Strait of Gibraltar. Recirculations associated with the Deep Western Boundary Current, the Gulf Stream, and the North Atlantic Current (an extension of the Gulf Stream) mix the LSW and Mediterranean waters, creating the intermediate thicknesses (blue colors) and temperatures (green colors) between the two sources. The water mass that results from the mixing of LSW and Mediterranean Overflow Water is called the Upper North Atlantic Deep Water; it represents one of the major elements exported into the South Atlantic as part of the global conveyor belt.
The 500-meter thickness contour roughly separates the areas where LSW strongly influences this layer from regions where Mediterranean Overflow characteristics predominate and shows that these LSW influences can be traced southwards along the western boundary all the way to the tropics. Although the top of the LSW layer is at the sea surface in its subpolar source region, in the subtropics it is isolated from contact with the atmosphere and occupies depths between 1,200 and 2,200 meters.
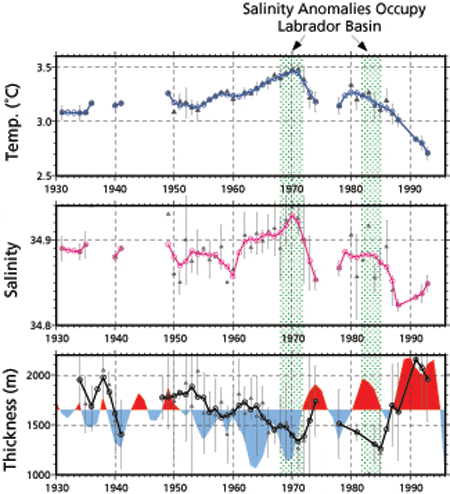
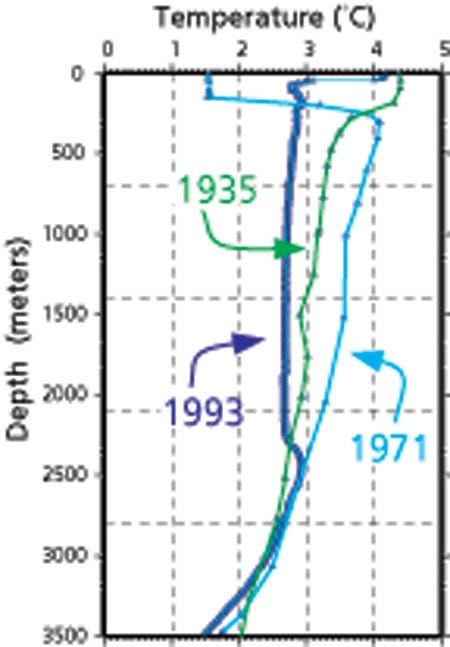
LSW properties—temperature, salinity, and thickness—have changed significantly through time, and continued measurements in the Labrador Basin since the 1950s enable us to create the time series shown in the figure above right. This record shows a general warming from the 1930s to 1971, followed by a cooling trend that persists to the present. Thickness of the LSW layer is directly related to the intensity of wintertime convection, with strong convection producing a thick layer and weak convection resulting in a relatively thin layer. Thick conditions in the 1930s, 1950s, 1970s, and 1990s indicate periods of strong convection and loosely correlate to cooler, fresher LSW conditions. Note the abrupt end to the 1950s and 1960s warming, increasing salinity, and thinning with the onset of strong convection in 1972. This cooling, freshening, and thickening event, however, is interrupted by a period of weak convection in the early 1980s. Then, by 1987, the return of strong convection culminates in the coldest, freshest, and thickest conditions ever measured. The figure at right contrasts vertical temperature profiles from the warm and cold phases of LSW to emphasize the extraordinary cooling of the Labrador Basin’s water column over the past 25 years. Note that this cooling has chilled the LSW beyond its previous cool state more than 60 years ago, in the 1920s and 1930s.
Two factors principally determine LSW property history: the strength of the winds and the periodic appearance of freshwater anomalies at the sea surface. The westerlies, which blow cold, dry air from Canada across the Labrador Basin, are a significant factor in determining the depth of Labrador Basin wintertime convection. An increase in wind strength removes more heat from the surface waters and deepens the extent of the convection. This also results in a cooler overall LSW, since the increased heat loss at the sea surface is distributed downward as the water column convects. The relative strength of the westerlies is represented by the North Atlantic Oscillation (NAO) index. (See NAO inset Box in Clara Deser’s article.) Overplotted on the thickness axis in the second figure, the NAO index (shaded red for high, blue for low) shows trends similar to the LSW thickness: declining NAO index and thinning LSW from the 1950s to 1970, a pulse of strong westerlies and LSW thickening in the early 1970s followed by weak westerlies and thin conditions in the late 1970s, then extremely strong westerlies (high NAO index) and thick conditions in the 1990s. Notice also in the figure above right that LSW temperature is warming during low NAO periods and cooling during years of high NAO. Thus the atmospheric climate signal becomes imprinted on the LSW thickness and temperature.
The thin LSW layers of 1967-72 and the early 1980s correspond to buildups of extremely low surface salinity conditions, which resulted in low surface densities. Because this surface water required extraordinary cooling to make it denser than the underlying water, it completely inhibited convection in the Labrador Basin. These two events, referred to as the “Great Salinity Anomaly” and the “Lesser Great Salinity Anomaly,” eventually moved around the subpolar gyre (see Schmitt “If Rain Falls” article). The first Great Salinity Anomaly occupied the Labrador Basin during a time of low NAO index when weak winds would have reduced the convection depths anyway. However, the Lesser Great Salinity Anomaly hindered convection in the early 1980s, which resulted in a thin LSW source despite strong westerlies associated with a relatively high NAO index. Both anomalies ended with a strong increase in convection and a downward mixing of the freshwater cap, which dramatically lowered the LSW core salinity and temperature.
The subpolar LSW, carrying the imprinted climate signals, enters the subtropics along two principal pathways: The deep western boundary current transports LSW from the Labrador Basin to the Caribbean Islands, and the Gulf Stream and North Atlantic Currents carry it from the western boundary out into the interior of the ocean. The LSW in these flows is strongly stirred and mixed by current and eddy action along these pathways and in the ocean interior. In the first of the two plots above, the basin-scale, deep-water properties thus represent a blending of the LSW influence with other influences, principally the Mediterranean Overflow Water. The resulting blended water mass, known as the Upper North Atlantic Deep Water (UNADW), exhibits a temperature history that we can now relate to variations in LSW source properties. This link was previously obscure because the subtropical UNADW temperature signal is more strongly influenced by the LSW thickness history than by the LSW temperature history. Furthermore, the time the ocean requires to transport and mix the LSW into the subtropical UNADW introduces a time delay to the link between these signals.
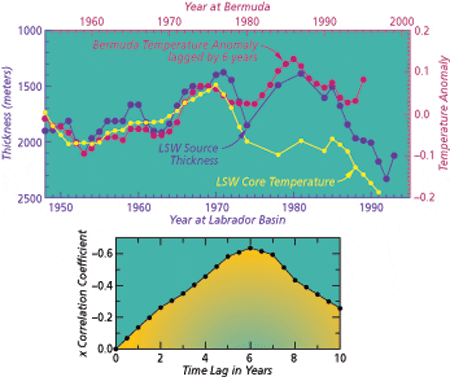
The temperature of the subtropical mid depths (1,000 to 2,500 meters) has generally warmed since the 1950s. The top plot above right (red curve) shows this warming trend using a long time series measured at Bermuda and a recent analysis of its thermal structure by Terry Joyce and Paul Robbins (see Joyce article). When a time lag is applied to the Bermuda signal, its temperature is remarkably similar to the LSW thickness (blue curve), while the subpolar LSW temperature signal (yellow curve) diverges after 1975. Correlation between the subtropical temperature and subpolar thickness signals is greatest at lags of five to six years and implies that when subpolar convection is strong—and the LSW layer is thick—the subtropics follow five to six years later with cooler temperatures at mid depths. Conversely, weak convection and a thin LSW layer is followed by warmer subtropical temperatures approximately six years later.
To place this relationship into a geographic context, the figure at right maps the thickness of the LSW density layer in six different time frames, each spanning about 7 years and chosen to represent phases of LSW source variation. As noted above, the thickness of the LSW layer in its subpolar formation area changes through time as the convection intensity varies: The Labrador Basin LSW source is thick in the first two time frames, extremely thin in 1966-72 and 1980-86 (a thick pulse in 1973-79 separates these two periods), and grows to extreme thicknesses in the final time frame. Away from the source (near the western boundary east and south of Newfoundland and east of New England), the layer is noticeably thin in the 1970s and 1980s, but robustly flooded with LSW in the 1950s and 1990s. Over the rest of the subtropics (north of 10° latitude), the LSW layer thickness changes most in the fourth time frame (1973-79) when the Mediterranean Overflow Water characteristics (green colors) are extended northwards in the eastern basin and westwards in the western basin. Compare the areas around the Azores and south of Bermuda in each panel to see this change.
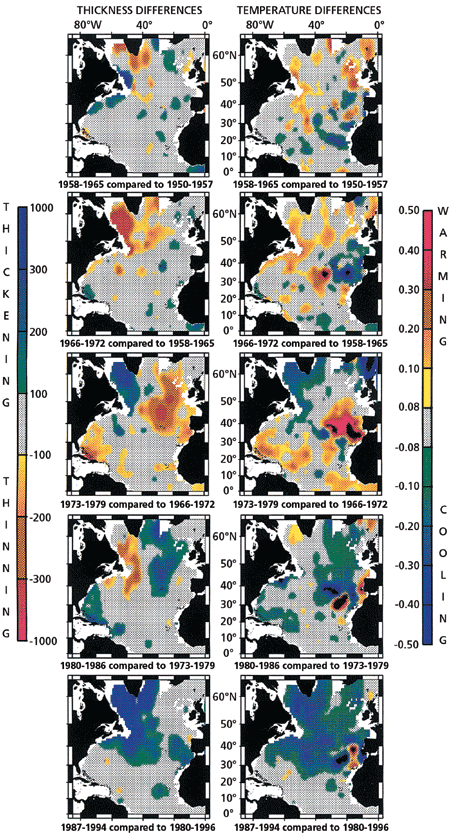
In order to visualize the impact of LSW temperature and thickness anomalies (changes in temperature and thickness) on the subtropics, the figure below maps the temperature and thickness differences in one time frame compared to the previous time frame for each period in the figure at right. The patterns of anomalies show large areas where thickness changes correspond to temperature changes—where the layer thins, temperatures grow warmer, and where the layer thickens, temperatures are cooler—and delineate where LSW exerts a strong influence. These patterns also show consecutive instances where temperature and thickness anomalies of one color first appear in the Labrador Basin, rather quickly move southward and eastward with the western boundary current and North Atlantic Current, and then, one time frame later, anomalies of the same color appear in both the western and eastern subtropical basins.
The subtropical deep water anomalies appear to lag behind the subpolar LSW signal by five to seven years as the lagged correlation of the Bermuda data suggests. The subtropical temperature anomalies are large compared to the subpolar temperature anomalies. Because a signal weakens as it moves away from its source, these subtropical signals cannot be simply the advected subpolar temperature anomalies. Rather, the time-delayed subtropical response to LSW source variability represents the slow adjustment of the subtropical deep water to the waxing and waning of LSW strength so clearly visible in the figure above. The thicker the LSW, the stronger its role in mixing with Mediterranean Overflow water, and this is manifested as an eastward and southward erosion of the influence of the Mediterranean Overflow Water on the subtropical deep water. The time needed for the LSW to circulate and mix into the subtropical basins results in a delayed appearance of the response. When the LSW is thinner than normal, the Mediterranean Overflow Water exerts more influence, and this appears as a westward and northward extension of the thin, warm, and salty characteristics.
Understanding the nature of the subtropical temperature variations and knowing that the subpolar convection has been extremely strong from 1988 to 1995 enables us to predict that the subtropical mid depths will continue to cool through the 1990s. Tracing the extremely cold, fresh, and thick signal that is now invading the subtropics (quite pronounced in the bottom panels of the figure at right) will provide us with valuable information concerning the timing and geography of the complex mid-latitude circulation system whose end product, the Upper North Atlantic Deep Water, is exported to the southern ocean. Our WHOI colleague Bob Pickart (see Oceanus, Spring 1994) has tracked the penetration of the extreme LSW along the deep western boundary current and Gulf Stream system off New England, and our University of Miami colleagues Rana Fine and Bob Molinari have recently (summer 1996) sighted this extreme LSW signal in the deep western boundary current off Abaco in the Bahamas—one of the most exciting and valuable results of their decade-long monitoring program at that location. We are planning a 1998 field experiment to take advantage of this unique climate change signal by measuring the subtropical western basin’s response to the LSW invasion at 24°N and 15°N. Because of the time delay observed in the subtropical response, we can be reasonably confident that we will be in the right places to measure this extreme LSW event, for we know through the continued efforts of our Canadian colleagues John Lazier and Allyn Clarke (Bedford Institute of Oceanography) that the LSW source continued to convect through the winter of 1995. They report a cessation of deep LSW convection in winter 1996. If that cessation is longer-lived than a single anomalous winter event, then we would expect it to appear as a subtropical climate change signal in 2000 to 2002.
The authors’ research is jointly funded by the National Science Foundation-sponsored World Ocean Circulation Experiment Program and the Climate and Global Change Program of the National Oceanic and Atmospheric Administration. The authors thank Terry Joyce for collaboration in producing the “Year at Bermuda”, “Year at Labrador Basin” figures above, James Hurrel (National Center for Atmospheric Research) for providing the most recent update of the NAO index data, and John Lazier for providing the Labrador Basin data for recent years and for his sustained effort for more than 30 years in maintaining critical time-series measurements in the hostile environment of the Labrador Basin.
Slideshow
Slideshow
 A: Structure of the North Atlantic basins is defined by bathymetric contours (2,000, 3,000, and 4,000 meters) progressively shaded gray. The Mid-Atlantic Ridge separates the western and eastern basins. The dominant currents at mid depths (near 1,500 meters) are approximated by the pink lines (bringing relatively warm water northward) and the blue lines (transporting cold waters southward). B: Thickness in meters of the density layer corresponding to the Labrador Sea Water (LSW). C: Temperature, in degrees centigrade, of a density surface in the middle of the LSW layer. These maps highlight the geographical distribution of the Labrador Sea Water and the Mediterranean Outflow water masses that mix to produce Upper North Atlantic Deep Water. D: Temperature profiles from the Labrador Basin and the Mediterranean Outflow region (locations are shown by x in panel A). Green shading denotes the density layer that is mapped in panel B for each profile.
- Time series of Labrador Sea Water properties in its source region. Thickness is the vertical distance (meters) between two density surfaces that bracket the Labrador Sea Water. The North Atlantic Oscillation index has been overplotted on the thickness axis with high index shaded red and low index blue. Years in which surface salinity anomalies occupied the Labrador Basin are shaded green.
- Depth profiles of temperature for three different years contrasting the Labrador Sea Water temperature in its cool period before World War II (1935), the peak of warming (1971), and at its coldest point (1993).
- Temperature changes recorded in the 1,500 to 2,500 meter layer near Bermuda. The top plots show time series of Bermuda temperature anomaly (red curve) lagged by 6 years, thickness of the Labrador Sea Water layer (blue curve) in its formation area, and temperature of the LSW core (green curve). The lower plot shows a lagged correlation analysis for Bermuda temperature and Labrador Sea Water (LSW) thickness, which is highest for lags of 5 to 7 years. The authors? interpretation is that subpolar thickness anomalies result in variability of the volume of LSW entering the subtropics. A large volume of LSW shifts the balance of influence between LSW and Mediterranean Outflow towards LSW. When the LSW is thick, Bermuda sees colder (and fresher) conditions about 6 years later, while a thin LSW source results in stronger Mediterranean Outflow influence and Bermuda sees warmer (and saltier) conditions after about 6 years.
- Temperature changes recorded in the 1,500 to 2,500 meter layer near Bermuda. The top plots show time series of Bermuda temperature anomaly (red curve) lagged by 6 years, thickness of the Labrador Sea Water layer (blue curve) in its formation area, and temperature of the LSW core (green curve). The lower plot shows a lagged correlation analysis for Bermuda temperature and Labrador Sea Water (LSW) thickness, which is highest for lags of 5 to 7 years. The authors??A? interpretation is that subpolar thickness anomalies result in variability of the volume of LSW entering the subtropics. A large volume of LSW shifts the balance of influence between LSW and Mediterranean Outflow towards LSW. When the LSW is thick, Bermuda sees colder (and fresher) conditions about 6 years later, while a thin LSW source results in stronger Mediterranean Outflow influence and Bermuda sees warmer (and saltier) conditions after about 6 years.
- Thickness difference fields (left column) and temperature difference fields (right column) were constructed by subtracting thickness or temperature in two consecutive time frames at each 1-degree square in the North Atlantic. The thickness represents the LSW density layer and temperature values are taken at a density surface in the middle of that layer. Green-blue colors indicate layer thickening and/or cooling in one time frame compared to the previous time frame; yellow-red colors indicate layer thinning and/or warming.
