Chen, Z., Kwon, Y.‐O., Chen, K., Fratantoni, P., Gawarkiewicz, G., & Joyce, T. M. 2020. Long‐term SST variability on the northwest Atlantic continental shelf and slope. Geophysical Research Letters, 47, e2019GL085455. https://doi.org/10.1029/2019GL085455

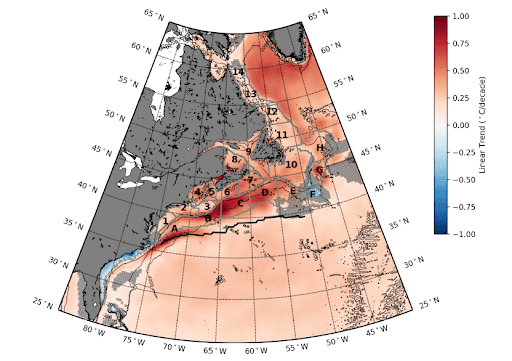
Spatial pattern of linear trends of sea surface temperature anomaly between 1982 and 2018 based on the NOAA Optimum Interpolation sea surface temperature. Insignificant values at 5% are masked in gray. The mean Gulf Stream path between 50° and 75°W is indicated by the black solid line. Three isobaths are plotted as thin black lines: 200 m, 2,000 m, and 4,000 m. The shelf and slope boxes are also indicated.
