Jet Stream Gets Fish in Hot Water
Ocean 'heat wave' linked to shift in atmospheric current
Oceanographer Glen Gawarkiewicz was just off the coast of North Carolina in May 2012 when he noticed something odd.
“The water was much warmer than usual,” he recalled. “It shocked me, because I’ve been going out since 1984 and I know what to expect there, and it was just totally different.”
By the end of the summer, he would learn just how different. During the first half of 2012, sea surface temperatures off the northeast coast of the United States were the highest in the 150 years that records have been kept. They persisted for more than six months—an unprecedented warming that disrupted fisheries up and down the coast.
Cool-water fish that fishermen had always counted on finding in the broad stretch from south of Long Island to south of Nantucket just weren’t there in any great numbers, said Rhode Island-based fisherman Fred Mattera. Reports began to come in that those species—including squid, whiting, and butterfish—were showing up in the waters off of Maine and even Newfoundland.
“They never saw a squid there before,” said Mattera. “Never.”
At the same time, fishermen off Rhode Island were hauling up grouper, cobia, and other species usually caught off the Carolinas and Florida.
Gawarkiewicz, a scientist at Woods Hole Oceanographic Institution (WHOI), suggested that postdoctoral scholar Ke Chen try to track down what caused the extended warming. What Chen found surprised everyone.
Everywhere at once
At first, Chen thought he would find the source of the warming in the ocean itself. In the autumn of 2011, just a few months before the heat wave, the Gulf Stream had diverted northward from its usual course, bringing warm subtropical waters farther north than usual near Georges Bank. Perhaps that produced an aftereffect that lasted into the following spring.
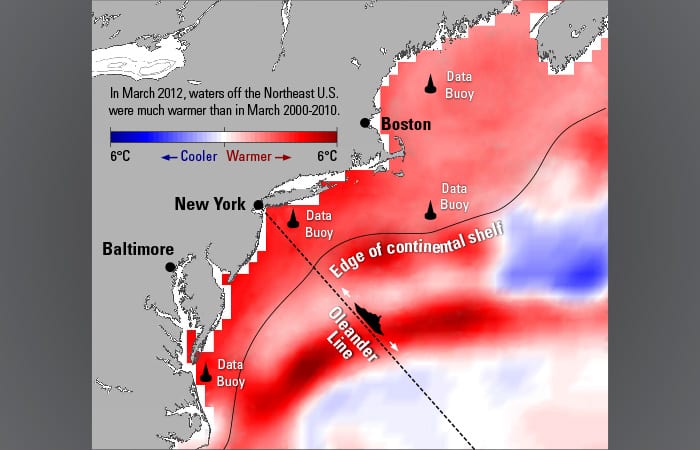
Chen obtained data on sea surface temperatures from moorings deployed by the National Oceanic and Atmospheric Administration (NOAA) at four sites along the East Coast from Virginia Beach northward to the Gulf of Maine.
He found that the warming occurred at the same time at all four buoys, beginning in November 2011. If it had been caused by currents, it should have shown up at different times at the four buoys. From January through June 2012, the sea surface temperatures generally ranged from 3 to 4.3°F (1.7 to 2.4°C) above the average temperatures measured at the same sites during the previous decade. Some short-term spikes reached nearly 11°F (6°C) higher.
Not only that, but the warming extended far below the surface. Chen also analyzed data from NOAA’s Oleander Project, which involves a container ship traveling back and forth between New York and Bermuda. At regular intervals, it deploys expendable bathythermographs that transmit depth and temperature readings as they fall to the seafloor.
Chen found that from January through April 2012, the warming reached 164 feet (50 meters) deep. Even as summer approached, the upper 50 feet (15 meters) of the ocean remained much warmer than the average for that time of year.
“It’s a dramatic change in the ocean over the entire continental shelf,” said Chen. “The warming is not only at the surface. We saw a shift over the entire water column.”
Eyes on the sky
What’s even more impressive about the temperature differences is that Chen had compared 2012 temperatures with those from 2000 to 2010—a time when average sea surface temperatures had already risen over historic levels because of climate change.
“A lot of times when people compare anomalies, it’s over the past 30 years or 50 years,” said Gawarkiewicz. “We specifically chose the last 10 years because the system has already changed. This 2012 anomaly stands out even compared to the recent, perturbed situation.”
Warming over such a vast scale did not originate in the ocean, Chen determined, so he turned to the other major player in Earth’s climate system: the atmosphere. Data from NOAA’s National Centers for Environmental Prediction enabled him to calculate the flow of heat between the atmosphere and the ocean. He found that compared to other winters, the ocean lost much less heat during the winter of 2011-2012 relative to the average of the previous ten years, leaving sea surface temperatures much higher.
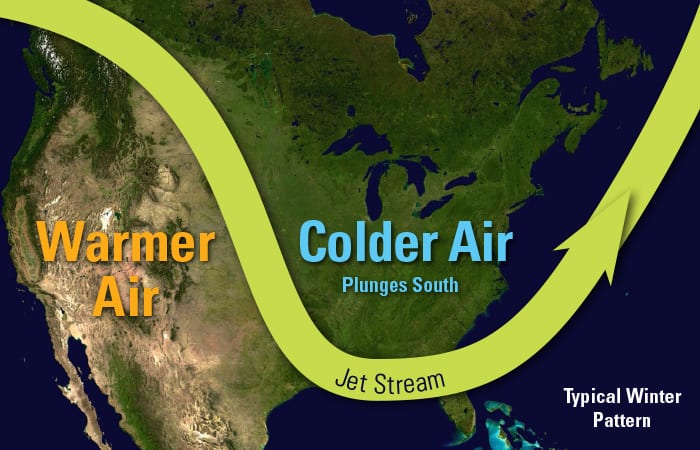
Chen investigated why that may have happened. He found that during the winter of 2011 and early spring of 2012, the air above the East Coast was warmer than normal. Oceanographer John Bane at the University of North Carolina-Chapel Hill helped him to examine the jet stream, a fast-moving current in the upper atmosphere. Flowing along more than 23,000 feet above Earth’s surface, the jet stream is a constantly moving border between Arctic air to the north and warmer subtropical air to the south. It usually follows a wavy course that, in most winters, periodically dips down across much of the U.S.
An unusual pattern
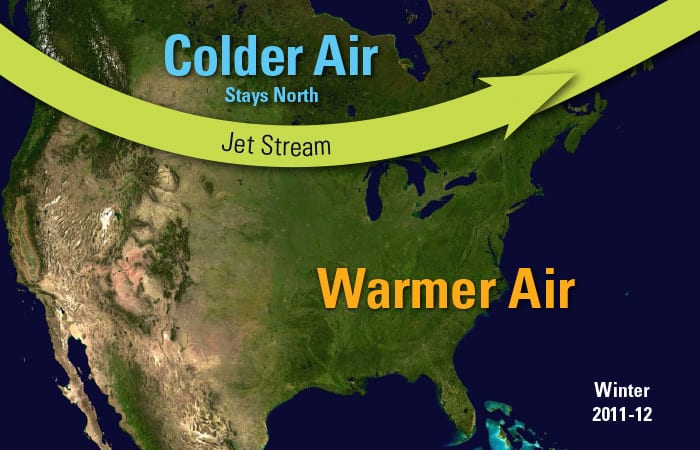
In the winter of 2011-2012, the pattern was different in two important ways: It stayed farther north than usual, and it was flatter, without the big loops that normally bring frigid air over much of the country and Atlantic coastal waters.
Chen concluded that the jet stream’s unusual trajectory for much of the winter of 2011-2012 caused relatively warm air to remain above coastal waters, and so they did not lose as much heat as they normally do during the winter. When spring came and the water began to warm up, it had a head start—and ended up much warmer than usual. The air had caused a heat wave in the ocean.
Chen’s study was published in the January 2014 issue of the Journal of Geophysical Research: Oceans. Gawarkiewicz and Steven Lentz of WHOI, along with Bane, were co-authors on the paper.
Chen thinks that 2012 was an anomaly, not a new pattern. The jet stream returned to a “normal” pattern in the winter of 2012-13, dipping far enough south to allow U.S. coastal waters to cool off. Although official measurements for the past few months aren’t in yet, the same seems to be the case so far in the winter of 2013-2014.
Fleeing the heat
But the story doesn’t end there. A change of that magnitude to any environment is bound to affect the organisms that live there.
“It wreaked havoc,” said Gawarkiewicz of the 2012 heat wave. “The whole marine ecosystem was affected by this.”
The spring plankton bloom, which usually starts in April, began in February. Seabirds from Florida to Iceland were found far outside their usual range. So were fish, including many commercially important species. Mattera said the warming was a big topic of conversation among his colleagues early in 2012.
“What struck us was how large a mass of warm water that was, and how it just stayed there,” said Mattera, who is on the board of the Commercial Fisheries Research Foundation (CFRF). “And it was some hot water. There were some times and places that the water was in the 80s.”
Rhode Island lobsterman David Spencer, president of the board of the CFRF, said the 2012 heat wave was an extreme example of something fishermen have been dealing with in recent years.
“The general patterns seem to be more variable now than they have been in past years,” he said. “The seasonality of when we catch the lobsters and crabs is in flux, as well as where we catch them.”
“In the past, certain months, we just knew,” said Mattera. “After Christmas time, we would go out toward those canyons, and we’d start to look for butterfish and we’d look for squid. You traditionally did that, year after year. And after a half a day or a day, a few other boats would come, and we’d get on a school of fish, and we’d make a living there. Well, in the last decade or so, that hasn’t been consistent any longer.”
No new normal
Spencer and Mattera said they and their colleagues benefit from the workshops and other communications with oceanographers such as WHOI’s Gawarkiewicz and Al Plueddemann, but still face a lack of information when it comes to deciding where to go on any given day to have the best chance of finding fish. Conditions simply are changing too much and too fast.
“Currently, management cannot adapt that quickly, primarily because the science can’t react that quickly to guide the management,” said Spencer. “One of my biggest concerns in a changing environment is we don’t have the scientific or management capabilities to adapt to changing conditions in a timespan that we need to have. I think there’s going to be a lot of lost economic opportunities if we can’t streamline this.”
He and Mattera said recent efforts to survey fishermen as soon as they get back to port are helpful and should be expanded, with the results posted online right away so fishermen can find out what’s being caught where. If they have to toss out their old logbooks that told them where they were likely to find lobster or whitefish at a given time, up-to-the-minute surveys would help them navigate the rapidly changing waters and help them stay in business.
“Fuel is almost $4 a gallon,” said Mattera. “I can’t afford to go hunting all over the ocean for four days, spend $10,000, and not even get $500 worth of fish.”
Looking for clues
The 2012 warming event has scientists scrambling too, said Gawarkiewicz. Even against a backdrop of increasingly variable conditions, that event stands out.
“The scary part is that, number one, it worked differently than it ever did before, and number two, the magnitude of it,” he said. “This magnitude and duration are just not something that any computer model had predicted before. That’s why I think this time period bears a lot of study—how are the organisms going to respond?”
He and Chen are especially interested in how the heat affected currents along the shelfbreak, where the relatively shallow continental shelf drops off to the ocean depths. Those currents are crucially important in providing nutrients to plankton and everything that depends on them, from fish to whales.
Predicting the future
Chen, whose expertise is in modeling, plans to develop a model to look at details of the interplay between atmosphere and ocean dynamics on a regional scale.
The kinds of regional-scale changes that are plaguing Northeast fishermen are too small for current global circulation models, which have a spatial resolution of about 60 miles—about the same breadth as the entire continental shelf. They also run predictions out decades or longer.
“How do you go from a a 30-year run with this global model to what will happen 10 miles south of Rhode Island, where the squid like to go, in July?” said Gawarkiewicz.
Chen will be aided by data from NOAA and the National Science Foundation-funded Pioneer Array, a coastal observatory now being set up by WHOI and its partners. It consists of overlapping grids of moored instruments, autonomous vehicles, and gliders deployed across the edge of the continental shelf south of Cape Cod. Over the next five years, it will monitor temperature, salinity, current speed and direction, air-sea heat flux, and other key parameters over the outer continental shelf and upper continental slope.
“We really want to know if we can predict the same conditions, if a similar story happens again in the future,” said Chen. “If we see a Gulf Stream diversion again in the winter, or we see anomalous jet stream motion in the winter, can we predict similar conditions like 2012 in the coming spring? To do that we need to have a better idea of the interplay between the atmosphere and the ocean dynamics from year to year.”
This research was funded by NOAA’s Cooperative Institute for the North Atlantic Region, the Office of Naval Research, and the National Science Foundation. Data were provided by the National Data Buoy Center, the Oleander Project, and the High Density XBT Transect Program of the Atlantic Oceanographic and Meteorological Laboratory, the Ship of Opportunity Transect Surveys program of the Northeast Fisheries Science Center, and the National Centers for Environmental Prediction.
Slideshow
Slideshow

In early 2012, sea surface temperatures off the U.S. east coast were several degrees higher than usual (red) for that time of year. Data from instrumented buoys showed that the higher temperatures occurred over a vast area at the same time, and data from a ship traveling along the “Oleander Line” between New York and Bermuda showed that the unusual warmth extended well below the surface.
(Illustration by Eric Taylor and Ke Chen, Woods Hole Oceanographic Institution)- When postdoctoral scholar Ke Chen found that unusually high sea surface temperatures in 2012 occurred over a vast region at the same time, he turned his attention to the only part of the Earth system able to influence that large an area all at once: the atmosphere. (Photo courtesy of Ke Chen, Woods Hole Oceanographic Institution)
In most winters, an upper-atmosphere air current called the jet stream dips far south, bringing cold Arctic air over much of North America and Atlantic coastal waters. Chen found that it followed a very different course during the winter of 2011-2012 (next image).
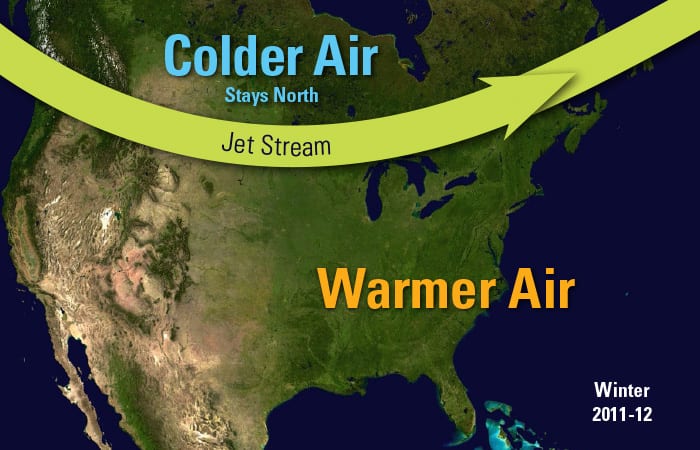
(Illustration by Eric Taylor, Woods Hole Oceanographic Institution)During the winter of 2011-2012, the jet stream stayed farther north and was flatter than usual, not looping far to the south. As a result, warmer (and more humid) air remained over much of North America, preventing coastal waters from losing as much heat as they normally do in winter. That led to unusually high ocean temperatures during the spring and early summer of 2012.
(Illustration by Eric Taylor, Woods Hole Oceanographic Institution)- WHOI physical oceanographer Glen Gawarkiewicz works with local fishermen and fishing industry groups to gather and disseminate information about changing ocean conditions, such as temperature, currents, and salinity, that can affect the behavior and distribution of commercially important fish species. (Photo by Jayne Doucette, Woods Hole Oceanographic Institution)
