Lessons from the 2011 Japan Quake
What have scientists learned about its cause and consequences?
When the ground in Japan started shaking on March 11, 2011, the Japanese, who are well accustomed to earthquakes, knew this time was different. They weren’t surprised—the fault that ruptured has a long record of activity. But this time the trembling continued for six minutes. When it finished, many turned their eyes to the sea off the country’s craggy and quake-scarred coast, as they are taught, and waited for the waves to come.
But the last time something remotely similar had happened was more than 1,000 years ago and, even in a country that prides itself on its shared cultural memory of the distant past, that event had been largely forgotten. Since that time, much has changed. People and development have sprung up along the coast, along with a string of nuclear reactors. Everything, it seemed, had changed in the intervening millennium—except the ocean.
Compared with other large earthquakes in recent memory, the magnitude 9.0 Tohoku earthquake, as it became known, was different in many ways. The temblors off Chile in 2010 (magnitude 8.8) and Sumatra in 2004 (magnitude 9.1) involved faults that extended partly onto land, but the Tohoku earthquake occurred entirely beneath the ocean—nearly 5 miles beneath the sea surface in some places. In Japan, the combination of natural forces and greater human presence created a domino-like sequence of events, from earthquake to tsunami to the release of radiation from the mangled remains of the nuclear power plant near Fukushima. (See interactive below.)
The majority of these events played out in the ocean, noted Jian Lin, a seismologist at Woods Hole Oceanographic Institution (WHOI). The Tohoku earthquake also triggered a cascade of scientific dominoes, as geologists, geophysicists, chemists, modelers, physical oceanographers, and marine biologists mobilized to understand the causes and consequences of the earthquake.
Where the fault lies
The undersea fault that ruptured on March 11 extends north-south about 500 miles, roughly parallel to the northeast coast of Japan. It is a mega-thrust fault in the Japan Trench, where the massive Pacific Plate pushes westward, and beneath, the continental Eurasian Plate. Where the two tectonic plates grind against one another, gargantuan stress builds over time in the seafloor crust. Hundreds of large and small earthquakes dot the fault each year as stress exceeds the breaking point of rocks and releases.
The immense forces of two colliding plates, said Lin, have compressed the Japanese island of Honshu like an accordion, pushing up the mountain ranges that fill much of the island’s interior and creating a spider web of smaller, land-based faults that periodically rupture. As a result, the Japanese have made living with seismic activity part of their daily life and national culture. Each year, schools and businesses across the country mark Disaster Prevention Day on Sept. 1, the anniversary of the 1923 earthquake that devastated Tokyo, by participating in drills and other activities to prepare for a large earthquake. Building codes are laden with requirements intended to prevent high-rise buildings from collapsing during violent shaking. Even the iconic bullet train is connected to a network of seismic sensors designed to automatically stop any moving train before shaking from a large offshore earthquake can reach shore.
When the shaking on March 11 stopped, the city of Sendai (population 1,000,000), the largest urban area near the epicenter, was largely spared—even though the temblor turned out to be the world’s fifth largest ever recorded. In Tokyo, less than 200 miles away, frightened office workers safely evacuated or rode out the six-minute quake as buildings swayed, but did not fall. On the busy railway corridor running north of Tokyo, trains slowed and stopped with very few derailments. In fact, the earthquake produced surprisingly little damage, despite the fact that national hazard maps for the region, based on data only from the last few hundred years, directed officials to prepare for a maximum magnitude of 8.0.
“This fault has magnitude 5s, 6s, and 7s all the time,” said WHOI geophysicist Jeff McGuire. “They thought it was too broken up to produce anything more than an 8.”
Colossal movement of land and sea
This all-consuming focus on Earth’s seismic activity has also spurred the Japanese to create perhaps the world’s most comprehensive seismic network, one that blankets the archipelago and the nearby ocean floor with more than 1,200 sensors to monitor position and movement. The Japanese government and scientific community have also encouraged a culture in which scientists share their data with colleagues elsewhere around the world, especially after the 1995 magnitude 6.9 Kobe earthquake that claimed more than 6,000 lives.
In fact, Shin’ichi Miyazaki, a geophysicsist at Kyoto University and one of Japan’s foremost experts in using GPS data to record how earthquakes move land and seafloor, was due to travel to the United States on March 14 to meet with McGuire and others. Fortunately, he was able to leave Japan before fears of radiation choked the country’s airports. When Miyazaki and McGuire sat together and looked at the data, they discovered to their surprise that after the earthquake, portions of the Japanese island of Honshu had moved 8 meters [26 feet] to the east.
“For us to see eight meters on shore, the fault could have moved as much as forty meters [130 feet] on the seafloor,” said McGuire. “The shallow portions of the fault could have moved even more.”
That so much energy was released from shallow portions of the fault was another surprise for McGuire and other seismologists. The water-filled sediment overlying the fault, instead of absorbing seismic energy, broke and continued breaking, all the way to the surface of the seafloor in places. “The fault motion actually got stronger as it got to the surface,” said McGuire. “That’s why the tsunami was so big.”
Had the earthquake occurred and nothing more, the Japanese people would have mourned their dead and counted themselves relatively lucky. Disaster officials would have realized their mistake and begun preparing for the possibility of larger earthquakes in the future. Geophysicists would have puzzled over the fault’s ability to release so much energy.
But the quake turned out to be just the beginning. When the mega-thrust fault broke, it released the wedged-in Eurasian Plate overriding the Pacific Plate. The plate sprang eastward and upward, propelling huge amounts of water upward, raising the sea level over the fault in an instant. The pulse of water raced away from the epicenter, spreading rapidly in all directions in the form of a complex ripple as deep as the ocean. In open water, that ripple would have been barely noticeable. When it reached the continental shelf and then the shallower coastal waters around Japan, however, the wave reared up, exposing its full size, and swept ashore, in some places for miles.
Simulating the tsunami
When they saw the news that day, Changsheng Chen and Robert Beardsley, like most people, were amazed by the power of the wave. But they also took a professional interest in the tsunami and its path of destruction.
Chen, a professor at the School of Marine Science and Technology at the University of Massachusetts-Dartmouth and an adjunct scientist at WHOI, has been studying ocean circulation since the late 1980s when he was a graduate student in the MIT/WHOI Joint Program. His advisor was Beardsley, and the two have collaborated ever since. In 2000, he and Beardsley developed the Finite Volume Community Ocean Model (FVCOM), a somewhat unorthodox model of global ocean circulation that can recreate currents and patterns in complex environments such as the coastal ocean and estuaries.
To understand how FVCOM differs from standard models requires physics and mathematics beyond many readers. Suffice it to say that most models divide the ocean into a rigid horizontal grid of squares and then calculate changes in surface elevation, currents, temperature, salinity, density, and other properties driven by surface forces (such as wind) and the horizontal transfer of mass, momentum, and energy among the squares. FVCOM, however, divides the marine realm into a horizontal grid of triangles of varying shapes and sizes.
The difference is more than aesthetic. The triangles permit Chen to make on-the-fly changes in the resolution of particular locations. Using the model, he can, for example, produce highly detailed simulations of ocean circulation in a focused region of the ocean (such as near the Fukushima-Daiichi nuclear plant). And at the same time, he can link what’s happening in those focused regions to broad, less-detailed circulation patterns across the entire Pacific Ocean, something typical models cannot easily do. In addition, FVCOM’s grid of triangles offers more nuanced views near shore, because they can be fitted more precisely into the irregular shape of coastlines and seafloor—like those of northeastern Japan.
After the tsunami struck, many were surprised by the extent of inundation along the coastline. Among those was Chen and Beardsley’s colleague Jun Sasaki, a professor of civil engineering at Yokohama National University. Sasaki and others quickly catalogued the extent of the flooding and produced detailed measurements of the flooded coast.
With this data, FVCOM could potentially recreate the wave to show just how the wave formed, approached, and ultimately inundated the coast. Chen and Beardsley already had high-resolution data for winds, tides, currents, temperature, salinity and other ocean conditions in the region where the tsunami hit. But the earthquake had fundamentally and instantly changed sections of the Japanese coastline. Not only had the coastline moved a substantial distance to the east, but some places had subsided as much as 2 meters [6.5 feet] as the underlying crust relaxed. For FVCOM to produce the most accurate results, Chen and Beardsley needed accurate maps of the “new” Japanese coast, which they got from Sasaki, but they also needed help from a source they had never turned to before: marine geologists.
Unusual scientific bedfellows
Jian Lin has been studying large earthquakes since the 1970s, including recent ones in Algeria, Sumatra, China, Haiti, and Chile. He, like McGuire, was astounded by how much sensors in Japan’s seismic network had moved after the earthquake. By studying the pattern of their movement, Lin and colleagues were able to approximate how the fault ruptured and how much the surrounding crust actually changed shape. This helped him to determine locations on neighboring parts of the fault, north and south of the March 11 rupture zone, where stress had shifted and increased dramatically, along with the likelihood of future earthquakes. The southern portion is notable for the fact that it has ruptured before—in 1855 a large earthquake on the segment laid waste to Edo, today known as Tokyo.
This time, however, Lin’s work found a new and unexpected use. Ten days after the earthquake, Chen contacted Lin looking for data on how much the height of the seafloor had changed. He could convert these data into sea surface changes, which would serve as a starting point for FVCOM to model the formation and spread of the tsunami. Lin produced several possible scenarios, from which the team created a model run that agreed with both the geologic and the tsunami inundation record. Their work provided the first scientific visualization of the waves that slammed into the coast and the reactors at Fukushima. (See animations below.)
“This was the first time I worked with a group of physical oceanographers to look beyond the geologic processes,” said Lin. “This kind of work would not have been possible without the superb ocean modeling capability of our physical oceanographer colleagues.”
Déjà-vu all over again
Almost exactly 25 years before the Tohoku earthquake, Ken Buesseler was a young marine chemist with a newly minted Ph.D. from the MIT/WHOI Joint Program. His thesis focused on the slight but measurable fingerprint of natural and manmade radiation in the Atlantic Ocean. In April 1986, Buesseler was at the Savannah River Laboratory near Aiken, S.C., measuring samples of seawater for plutonium, a byproduct of nuclear weapons testing in the 1950s and ’60s, when the first reports broke about a disaster unfolding at a Soviet nuclear power plant known as Chernobyl.
For the next two decades, Buesseler refined techniques to measure the types and amount of radioactive isotopes that Chernobyl and other events fed into the ocean. Because each radioactive isotope has a unique half-life (the time it takes for half of the atoms of a particular isotope to decay), as well as byproducts of that decay, Buesseler and others use these substances to trace currents and study how water masses mix across the depth and breadth of entire ocean basins.
“You never really know what you’re going to find when you look at a sample,” said Buesseler. “But if you know what to look for, you can begin to piece together how one radionuclide or another got to where you found it.”
To study Chernobyl’s marine impact, Buesseler looked to the nearest arm of the ocean, the Black Sea. With only one narrow connection to the Mediterranean through the Bosporus Strait, it is barely a part of the global ocean system. Its isolation and the fact that its surface and deep waters rarely mix allowed Buesseler to use the Black Sea as a “natural laboratory” and study such things as how the deep and surface waters interact, a key factor in why the deep Black Sea is largely devoid of oxygen (and why it often smells like rotten eggs due to sulfide buildup).
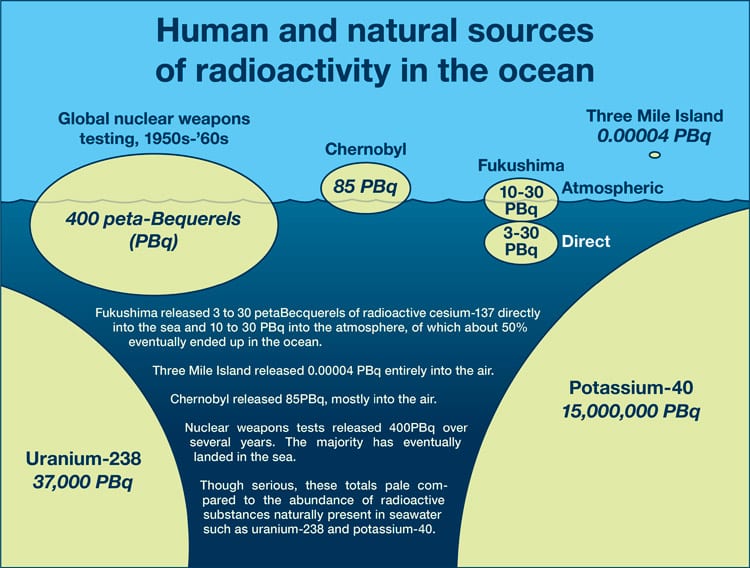
Over his career, Buesseler turned his attention to other scientific problems, but when conditions at the tsunami-damaged Fukushima Dai-ichi nuclear power plant began to spin out of control, he quickly realized his expertise would be needed once again. A series of gas explosions in the buildings housing the reactors destroyed the facility beyond repair, and officials were reduced to pumping tons of water on the reactors to keep them from catastrophically overheating. Much of that water became contaminated with radionuclides and had only one place to go—into the nearby ocean.
“I saw them trying to drop water on the reactors to cool them, and I saw their position on the coast and I thought, ‘This is déjà-vu all over again,’ ” he said.
Seize the moment
Buesseler immediately set about trying to get any information he could about how much and what sorts of radioactive isotopes were being pumped into the ocean. TEPCO, the Tokyo Electric Power Company, which operated the Fukushima Dai-ichi Nuclear Power Plant, was releasing some data, including the flow of water from discharge canals at the plant, and he had limited offshore measurements coming in from Japanese colleagues. But Buesseler knew that larger questions about how the radiation was mixing into the ocean or getting into the marine food chain could be answered only with a systematic look at how specific radionuclides were accumulating and moving in the ocean—from as close as he could get to the reactors and before they dispersed far offshore.
Buesseler began to search for sources of funding, colleagues, and ships of opportunity to mount a major research cruise to make these critical measurements. The National Science Foundation awarded him a RAPID grant on April 4 to have samples collected by colleagues around the Atlantic and Pacific and mailed to his WHOI lab so he could establish a baseline for releases from Fukushima. On May 3, the Gordon and Betty Moore Foundation provided $3.7 million to allow Buesseler to charter the research vessel Ka’imikai-O-Kanaloa (KOK) from the University of Hawaii. But there was still a Japanese bureaucracy in crisis mode to deal with and six months’ worth of cruise planning to do in five weeks’ time. “Those were the busiest five weeks of my life,” said Buesseler.
On May 15, the KOK departed Honolulu for Yokohama, Japan, with the ship’s crew on board even though Buesseler did not yet have all the permits he needed. On May 22, he received permission to sample within Japan’s 200-mile exclusive economic zone. On June 6, the ship left Yokohama with a comprehensive sampling plan and a full science party of 17 people from eight institutions, but still without the crucial final permission to sample at the edge of the 18-mile exclusion zone around the reactors. That finally came from the U.S. Coast Guard on June 8, while the ship was en route to the first sampling station.
Buesseler’s plans called for the team to collect water samples from the surface to as deep as 6,000 feet at 30 locations; to conduct net tows for phytoplankton, zooplankton, and nekton (free-swimming organisms) in various combinations at every station; and to sample the air and surface water continuously for radioactivity. The group also collected and packaged water samples for other lab groups in other countries that would eventually be able to test the water for more than 20 different radioactive isotopes.
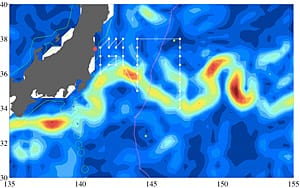
For two weeks, the KOK sailed a saw-tooth course beginning 400 miles offshore, crossing the powerful Kuroshio Current that flows from the coast of Japan into the Pacific. The final leg of the cruise began within sight of the reactor complex at Fukushima on a clear, sunny day.
Current affairs
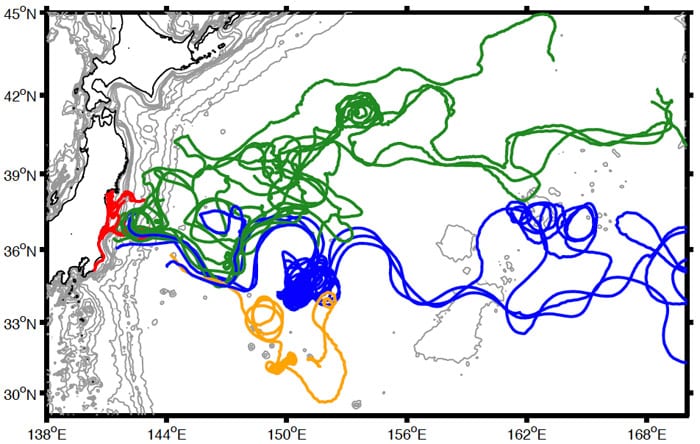
Also aboard the KOK was WHOI physical oceanographer Steven Jayne, who has long studied the Gulf Stream-like Kuroshio Current. He released two dozen surface drifters into the ocean during the cruise. These instruments deploy a parachute-like drogue just below the surface and transmit their locations back to shore while they move with ocean currents. Jayne used the data to map the strength and direction of branches and eddies in the current for months afterward.
Initial results have shown that radionuclides from the reactors mixed quickly into the ocean and were diluted to levels of naturally occurring radiation within a few tens of miles of the coast. In addition, the Kuroshio appeared to act as both a highway and a barrier, carrying much of the radiation quickly away from shore while also largely preventing it from spreading south. At the same time, Jayne’s drifters revealed the existence of an eddy—a swirling mass of water that periodically forms on the edges of strong currents—near the coast south of Fukushima. The eddy trapped radiation in it and resulted in the highest levels of radioactivity detected on the cruise. For years to come, similar measurements for radionuclides released from Fukushima will help oceanographers like Jayne trace currents and mixing throughout the Pacific Ocean.
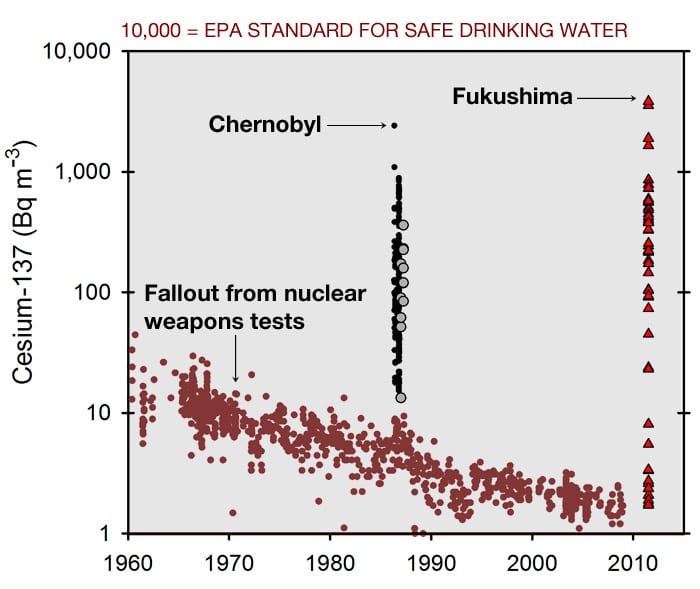
The scientists found that, even when sampling within sight of the nuclear power plants, levels of cesium-137 and cesium-134, two primary products of nuclear fission, were higher than normal, but still below what is considered of concern for exposure to humans. Levels were also well below thresholds of concern to the small fish and plankton, even if those were consumed by humans.
Several other groups have since confirmed the findings, but these measurements have also shown disturbing new trends. For one, levels of radioactivity in fish are not decreasing, and there appear to be hot spots of radioactivity on the seafloor that are not well mapped. There is also still little agreement on exactly how much radioactivity was released, where it is now, where it might end up in the future, and most importantly what the real risks are to human and marine life.
Potential hazard across the Pacific
With all their knowledge of the ocean and what caused the cascade of events that resulted in 20,000 dead or missing and damage that will not soon be repaired for forgotten, another fundamental question remains: Were events beginning on March 11 avoidable? Certainly not entirely. Nothing could have prevented the earthquake or the ensuing tsunami. But with greater knowledge of how the offshore mega-thrust fault works—and the earthquakes and tsunamis it has been capable of generating in the past—perhaps preparations along the coast would have been more extensive. Perhaps the nuclear power plant at Fukushima might have been reconfigured to lessen or prevent the damage that resulted.
Such knowledge could also inform preparations on the other side of the Pacific near another mega-thrust fault immediately off the coasts of Oregon, Washington, and British Columbia. The situation there is eerily similar to what happened in Japan in several ways. For one, earthquake and tsunami preparedness in many areas along the coast are based on a limited view of the fault’s history. As a result, many people believe the potential risk is vastly underestimated.
The Cascadia Trench off the Pacific Northwest, however, lacks the instrumental network the Japanese have installed in the Japan Trench. In February, McGuire and several colleagues received funding from the W. M. Keck Foundation to install extremely sensitive tiltmeters, similar to those placed off the northeast coast of Japan, that measure extremely small deformations in the seafloor near the Cascadia Trench. These will help give a better idea of just how much strain is building along a portion of the fault and help inform assessments of which parts of the fault are most likely to rupture.
For McGuire, Lin, and others, what began on March 11 speaks to a dire need to look more closely at that first domino—the one that fell deep beneath the Japan Trench, setting in motion events that continue to unfold today. “It shows how little we really know about the seafloor, yet we invest relatively little in studying it,” said Lin. “This is our call to learn more about what happens there.”
Slideshow
Slideshow
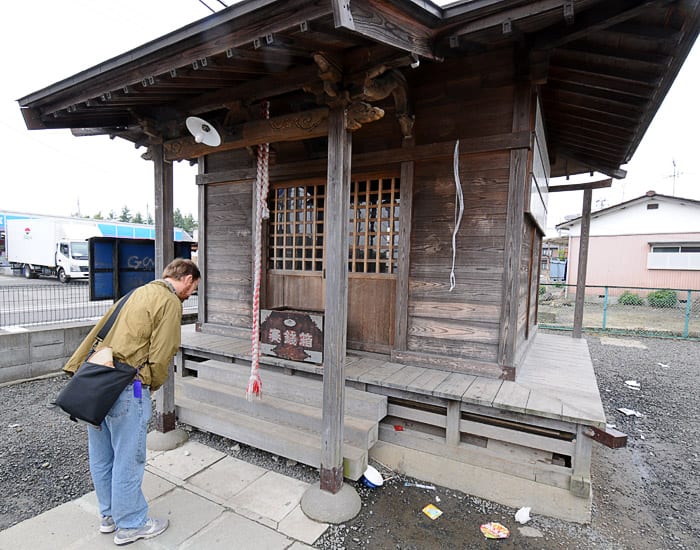
- WHOI marine chemist Ken Buesseler pays his respects in front of Namiwake Jinja. The shrine marked safe ground after the Jogan tsunami of 869 A.D. (Namiwake roughly translates as “split wave.”) It is a reminder that Japan has a history of devastaing tsunamis that needs to be considered when deciding how to protect the coast. (Ken Kostel, Woods Hole Oceanographic Institution)
- An international scientific team led by WHOI marine chemist Ken Buesseler completed a research cruises in June 2011 to assess the level and dispersion of radioactive substances from the Fukushima nuclear power plant and their potential impact on marine life. This map shows the sampling stations and cruise track near the Kuroshio Current (shown in yellow and red). Sampling began 400 miles offshore and passed within 20 miles of the nuclear complex. (Steven Jayne, Woods Hole Oceanographic Institution)
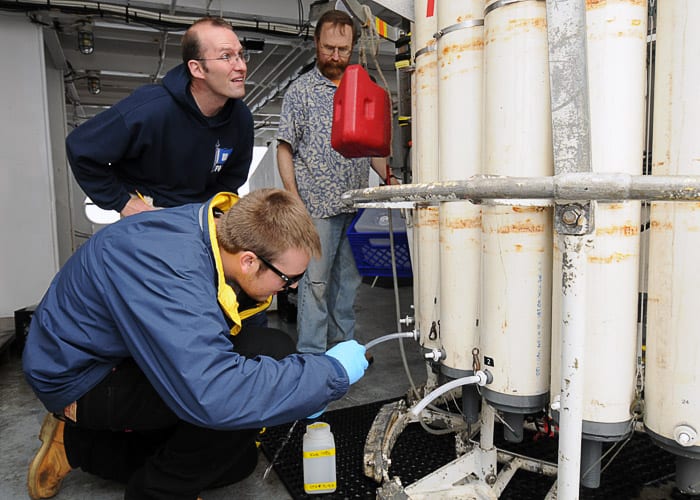
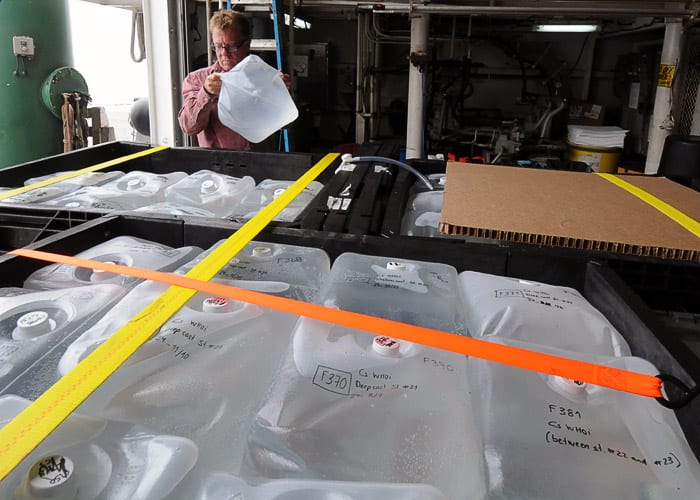
- During a two-week research cruise in June 2011, scientists collected more than 1,500 samples of seawater off the coast of Japan. They amassed more than 3 metric tons of water that was shipped to labs around the world to be analyzed for radioactive isotopes. Scientists Ken Buesseler and Steven Jayne from WHOI and Taylor Broek from UC Santa Cruz (top to bottom) take samples from a Niskin bottle, an instrument used to collect water from below the surface. (Photo by Ken Kostel, Woods Hole Oceanographic Institution)
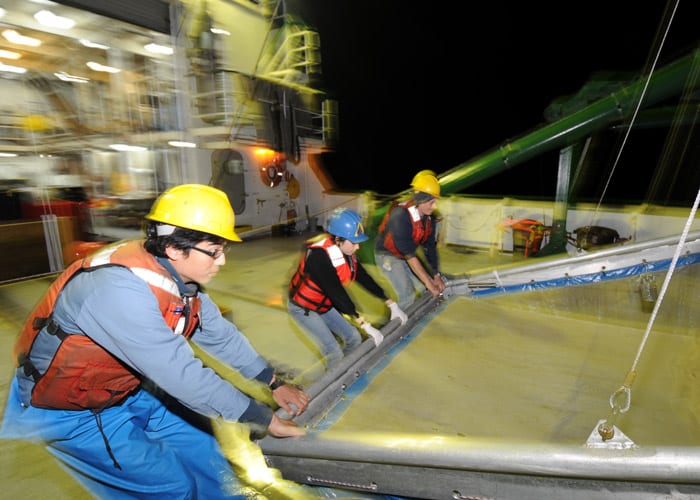
- Meanwhile, biologists used an assortment of nets to collect samples ranging from plankton to shrimp to fish to learn if radionuclides from Fukushima were accumulating in marine life. Above, biologists (left to right) Hiroomi Miyamoto, Jennifer George, and Hannes Baumann haul in a Methot net, a 2-meter-by-2-meter frame with a long, pyramid-shaped net towed at a depth of 200 meters. (Photo by Ken Kostel, Woods Hole Oceanographic Institution)
- WHOI researcher Steve Pike packs water collected in the Pacific east of Japan. Water and biological samples were sent to 16 labs in seven countries to detect levels of a variety of radioactive isotopes, including strontium-90, plutonium-239, and neptunium-237. (Photo by Ken Kostel, Woods Hole Oceanographic Institution)
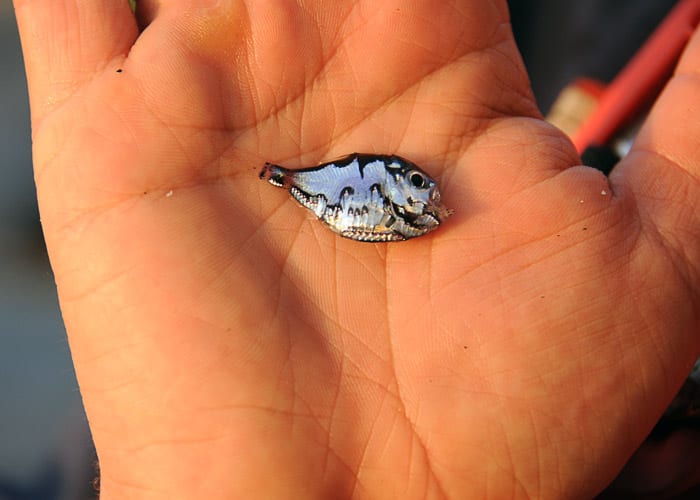
- A tiny hatchet fish was among the variety of marine life captured during more than 100 net tows. (Photo by Ken Kostel, © Woods Hole Oceanographic Institution)
- Levels of radioactive cesium-137 in the ocean from nuclear weapons testing in the 1950s and '60s has gradually decreased as the radionuclide (which has a half-life of 30 years) has decayed. The Chernobyl a spike of cesium-137 in 1986. Measurements from a June 2011 cruise that came within 20 miles of the reactors at Fukushima found levels of cesium-137 approaching but not exceeding 10,000 petaBecquerels per cubic meter, which is the threshold considered safe for drinking water by the the U.S. Environmental Protection Agency. (Ken Buesseler, Woods Hole Oceanographic Institution)
- WHOI physical oceanographer Steven Jayne released two dozen surface drifters into the ocean during the cruise. The drifters transmitted their locations back to shore while they moved with ocean currents. Combined with data from radionuclides, color-coded track lines from individual drifters indicated that the powerful Kuroshio Current acted as both a highway and a barrier, carrying much of the radiation quickly away from shore while also largely preventing it from spreading south. At the same time, Jayne’s drifters revealed the existence of a swirling eddy near the coast south of Fukushima that trapped radiation within it. For years to come, measurements of radionuclides released from Fukushima will help oceanographers like Jayne trace currents and mixing throughout the Pacific Ocean. (Steven Jayne, Woods Hole Oceanographic Institution)
- Human and natural sources of radioactive isotopes in the ocean. NOTE: colored ovals not drawn to scale. (Illustration by Jack Cook, courtesy of the Coastal Ocean Institute, Woods Hole Oceanographic Institution)
Video
Related Articles
- Can seismic data mules protect us from the next big one?
- Lessons from the Haiti Earthquake
- Seismometer Deployed Atop Underwater Volcano
- Worlds Apart, But United by the Oceans
- Oceanographic Telecommuting
- Rapid Response
- In the Tsunami’s Wake, New Knowledge About Earthquakes
- Ears in the Ocean
- Earthshaking Events
Featured Researchers
See Also
- Fukushima Radiation in the Pacific Blog from research cruise, June 3-17, 2011
- Tsunami website
- Cafe Thorium (Ken Buesseler's Lab)
- Finite Volume Coastal Ocean Model (FVCOM)
- Steven Jayne
- Jian Lin
- Jeff McGuire
- WHOI receives $1 million grant from Keck Foundation for first real-time seafloor earthquake observatory at Cascadia Fault News release
