The Quest to Map Titanic
Shipwreck drove advances in deep-sea imaging technology
Bill Lange was aboard Knorr in 1985 when the Woods Hole Oceanographic Institution research vessel brought back the first grainy black-and-white images of Titanic resting on the seafloor. Ever since, Lange has made it his quest to push the boundaries of imaging technology, engineering one-of-a-kind camera systems and operating them in the deepest and most extreme parts of the world’s oceans.
Lange, who directs the Advanced Imaging and Visualization Laboratory at WHOI, has returned to the Titanic site several times. He played a major role in a 2010 expedition that yielded new, richly detailed views of the ship and wreck site that were published in 2012, the 100th anniversary of Titanic’s sinking.
The original Navy-funded expeditions in 1985 and 1986 used Titanic as a target to test pioneering deep-sea technology. Were camera systems on the list?
Bob Ballard and a few of us had dreams of bringing color video back from the deep, but camera systems to do that didn’t exist at the time. Designing a deep-sea camera system is a lot more than just taking a camera off the shelf and putting it in a pressure-resistant tube. There’s a lot of engineering that goes into making these cameras work efficiently at depths of more than 13,000 feet, withstand pressures of 10,000 pounds per square inch and a range of temperatures from 100°F on deck to near freezing on the seafloor; operate on really low power; and produce high-optical-resolution images in very low light levels. There really isn’t a big market for camera systems like that, so it’s not economical for a commercial vendor to build one.
As it turned out, Titanic has been a great driver for advancing our imaging, lighting, and other technologies in the deep sea. The constant desire of people to know more about Titanic has provided funding and resources to go back to Titanic over the years. It helped drive our desire to keep bringing technology to the next level and improving the imaging capabilities for the scientists and the public.
What was the state-of-the-art technology in 1985?
The Argo towed camera sled system developed by Bob Ballard in 1985 was a paradigm shift. In the past, scientists had towed underwater metal sleds with 35-millimeter cameras above the seafloor with no electrical connection to the surface. You’d bring the camera back up to the surface, remove the film, and wonder what you had documented. If you were fortunate enough, you had a way of developing the film out at sea and then knowing a day or so later what you had surveyed. You didn’t see in real time what those cameras were seeing and thus loss valuable decision and ship time.
Ballard brought the idea of delivering live video images from the depths to a surface vessel, so scientists could make decisions immediately, as opposed to days later, about where to move their vehicle next. Argo was still limited in that it had one black-and-white video channel that was grainy, but it was unique at the time because of that live ability.
What happened when you returned to Titanic in 1986?
In a very short time we went from this groundbreaking real-time video system on Argo to putting humans down there on the submersible Alvin and developing color video cameras for Alvin to bring back the first high-quality color images from Titanic. A small remotely operated vehicle Jason, Jr. was also developed to penetrate into areas that were too dangerous for Alvin.
In 1985 and 1986, part of my job was also working with [WHOI scientist] Elazar Uchupi to examine and describe each still image, each frame of video, and plotting it on a map. During the 1986 expedition, Elazar and I plotted targets and objectives for the Alvin to conduct close-up inspection imaging. Later in 1986, we published the first real archaeological site plan of the wreck. This map of the wreck stood for over 20 years as the best depiction of the site.
But as successful as the ’85 and ’86 Woods Hole expeditions were, we had gaps in the survey data. Deep in my heart, I knew we’d made some assumptions, and so I began looking at ways to try to fill in data. For decades that meant partnering with documentary and tourist groups, trying to get our camera systems installed on vehicles that were going out there and hoping we would get a dive here and there to fill in data gaps and create an even more complete map of the site.
Why has it taken so long to create a comprehensive map of the wreck site?
People haven’t gone out with the desire to map. They’ve gone out with the desire to create documentaries. The two goals are quite different.
In the latter, filming is done to make beautiful images that can be used in a documentary. What isn’t done is navigation—recording the position of those images. It’s not important to a documentary group to expend the effort and expense of deploying acoustical beacons in the ocean to keep track of where the submarines are when they’re filming. But it is important to anyone who’s trying to do a forensic analysis of the ship. Knowing precisely where every image is taken is paramount to a good optical survey.
In 2005, on an expedition sponsored by the History Channel, we collected imagery using Mir submersibles from the Shirshov Institute of Oceanology in Moscow. For decades, filmmaking on Titanic has been done at the bow, the most recognizable part of the ship. We were able to convince the History Channel to leave the bow and start looking at the stern and the heavy debris field in areas that we hadn’t completely surveyed in ’85 and ’86. And that’s when some new findings started coming into the public’s view—keel sections that hadn’t been seen in detail before, and many other large objects that the public hadn’t really seen in high-resolution video.
Navigation was critical, because in order to get back to those locations on the next day to film them, you needed to know where they were. And that data allowed us to plot the exact locations of the images we collected on a map, so that we started seeing the relationships of objects in the east to the main hull sections, for example, of the boilers to the stern, and the stern to the bow, and things like that. I wondered if there really was a pattern to these objects.
What sort of a pattern?
At first, Bob Ballard and others proposed that as Titanic sank, the denser objects would fall more quickly, and the less dense objects would fall more slowly and get separated over time by currents. So you would get this comet-trail kind of pattern of debris on the seafloor. When we started looking at the Titanic data even from ’85 and ’86 and 2005, we realized that there were multiple debris fields, and things that just didn’t fit that previous simplistic model.
These questions only increased my desire to do a complete survey. We still didn’t have a complete map of the site. Maps published in magazines like National Geographic were still artists’ interpretations of what the site looked like. These maps weren’t real. To me, this was a big jigsaw puzzle where we had maybe 25 percent of the pieces missing and didn’t know what the picture looked like. That’s really what’s driven me to keep going back to Titanic.
How did the remarkable 2010 expedition take place?
In 2009, RMS Titanic Inc., the company that has the salvage rights to the wreck site, approached me about going back to the site again. I said the only way I would go back would be if we could completely survey the site once and for all in an archaeological manner, with the participation of NOAA (the National Oceanic and Atmospheric Administration) and National Park Service, which have been involved in protecting and preserving the wreck site. I was surprised that RMS Titanic agreed to that.
A scientific team was set up. Dave Gallo from Woods Hole Oceanographic Institution, Jim Delgado from NOAA, and Dave Conlin from the National Park Service, and I worked together on developing the scientific protocols to conduct the survey. That included sonar mapping, which should have been done decades earlier, but sonar mapping isn’t very exciting for a television documentary. But the way we did it, with REMUS vehicles, was exciting because it gave us this big picture.
How did REMUS, aka Remote Environmental Monitoring Units, help map the site?
REMUS is an autonomous underwater vehicle [AUV]. AUV’s don’t have any cable connection to the surface. They were launched and followed preprogrammed tracks, what we call “mowing the lawn,” surveying the seafloor nearly 24/7. They carried sonar devices, because you map the deep seafloor more efficiently with acoustics, as opposed to optics.
In parallel, we modified a commercial remotely operated vehicle [ROV], basically redesigning its power system, telemetry, lighting, cameras, and flotation system and turning it from a salvage ROV to probably one of the world’s best underwater vehicles to collect high-resolution, optical imagery.
We used these two different types of operational platforms simultaneously to survey the site. That was fundamentally important, because we could map 15 to 20 square miles of seafloor with REMUS and do close-up and wide-area optical imagery with the ROV—all at the same time with just one ship.
One of my most unique experiences from that cruise was hearing someone in the ROV control van say that we had descended 3,000 meters into the water, and we had to wait there because we had traffic ahead! This was something I really didn’t ever expect to hear in my career. The REMUS vehicles were operating too close to where we were headed with the ROV, and we decided to hold and let them go by. Operating three undersea vehicles from one vessel in a relatively small area does have its challenges.
How did the 2010 expedition go?
We had to do an enormous amount of work in a very short time. The expedition was funded later than we would have liked, and many things needed to be completed in transit. We were heading out late in hurricane season to a site that in some years seems to be in hurricane alley, so we were concerned about just how many operations days we would actually have.
In fact, we had three hurricanes, which provided a bit of a challenge. But we still managed to get over 95 percent of the survey work we wanted done. The sonar coverage from the REMUS AUV’s was amazing. The optical coverage of the major hull sections is also amazing, given that we were also working with currents at strengths that we hadn’t seen there before and visibility that was the worst I’ve ever seen in 25 years of working at Titanic. And we used solely high-definition 3-D imaging.
What are the advantages of 3-D?
One of our goals as an imaging lab is trying to make scientists feel like they’re right there where the camera is. The resolution of the image—how detailed it is—is only one part of the equation of how our brains process images. There’s also color information, and then there’s depth information. Working with scientists, we knew that what they really liked about diving on Alvin, versus using a remotely operated vehicle like Jason, was the ability to see depth. That’s what 3-D provides.
What was it like for you to finally look at Titanic in 3-D?
It’s hard to communicate the difference between looking at a flat 2-D image and a 3-D image. The 3-D automatically gives your brain all the clues of how objects are interrelated with each other, whether it’s in a depression or crater, or what part of a given object is sticking out more than another part. It also helps pilots fly and operate vehicles around objects. The 3-D also allows us to interpret the imagery better in turbid water. Our brains contain an amazing image processor—we simply need to understand how to get our brains the data they need.
What really brought home to me that the technology was working was, after one long shift staring at 3-D screens for more than 35 hours, I turned to Evan Kovacs, my colleague in the imaging lab, and we realized that we had no eye fatigue. Our eyes weren’t even watering. The technology had become transparent. We’d totally forgotten about the technology intervening between image and viewer.
Archaeologists onboard on the 2010 expedition said they were able to see the wreck much better than they were able to see it through the porthole of a submersible. The 3-D also tends to bring out features that you didn’t see before. We saw rusticles on the bow and the angles at which they were growing. They literally stood out in 3-D. The surfaces of the wreck were also much more deformed than one would have expected looking at 2-D imagery.
And one last point: Along with superior optical imagery, 3-D gives us the ability to virtually rebuild an object that we can then measure in a laboratory. Our motion 3-D cameras are taking some 60 or more images per second. Each stereo pair, consisting of a right-eye and left-eye view, contains an enormous amount of spatial information. This spatial data in the very near future will allow us to recreate objects virtually as point clouds and obtain accurate measurements without the need to disturb or recover an object. We’re collecting data that archaeologists can use not only to look at a given object, but also to get a measurement of it. Measurements are very important in science, and measurements of 2-D optical imagery have been difficult in the past in the deep sea.
So you finally got your map.
Yes, we merged and geo-rectified the acoustic sonar mosaics and the optical mosaics to create the first real comprehensive map of the Titanic site. It gives the general public the “bird’s-eye” view of one of the world’s most important maritime heritage sites. We’ve created some 225 optical mosaics, and the work continues.
We provided the archeological community with a huge amount of processed data that should have a major impact on policies and procedures for managing and operating at the site. I can’t imagine trying to manage something like this site when you didn’t even know how big it was, what was there, what the local ecology and geology was. We’ve spent an enormous amount of time putting the raw data from the expedition into a form that the marine archeologists and policymakers can easily access and use.
But it’s a snapshot in time. It represents the condition of Titanic as it was in 2010. At Woods Hole, we have data going back to the original expeditions, and that is a gold mine for scientists.
Why is it a gold mine?
We can learn things from the Titanic site about what happens in the deep sea. There are very few places on the bottom of the ocean that we have a 25-year history of what’s happened there. Until we found Titanic, many people thought things on the deep seafloor were preserved forever. Titanic has taught us that that’s not the always the case, and that some objects get preserved, but others do not. We recognized that colonizing organisms are destroying part of the metallic structures like the hull. But we don’t know if those processes have reached equilibrium, or if they are ongoing, or if the process is linear, or if, say, 400 years from now, structural failure will occur and the hull will collapse. We know more about modeling the metal corrosion than the biological processes at this time.
The National Park Service has been really at the cutting edge of developing techniques to analyze and monitor corrosion rates on shipwrecks. One of the shipwrecks that they’ve been honing their skills on is the USS Arizona in Pearl Harbor. We’ve tried to apply those techniques at Titanic, so we can compare what’s happening at Arizona and Titanic.
In Titanic, the bow and stern sections are still relatively intact, and there are lots of artifacts inside. One could make case that if the bow section were to undergo structural collapse, one might need to recover the historical artifacts inside.
What is the condition of Titanic?
One hears quite often that the ship’s decaying rapidly, and it’s going to be gone in a year, or it’s going to collapse in six months. Part of me feels that some of the decay and deterioration we’re seeing now comes from seeing the wreck more clearly each time we go out with better cameras and lighting. If you look at it in a low-resolution image, it doesn’t look so bad. But look at it in a very high-resolution image, and ‘Oh my god, there’s corrosion going on all over the place!’
That said, there are places where roofs and hulls are opening up, and corrosion is an active process. One of the things we’re working in this lab is looking at all the images from this 25-year period. We’d like to merge the ’85-’86 datasets with the 2010 dataset, plus the other supplemental data that we’ve collected from documentary groups and from NOAA, to get a time series of what’s happened at the site. It will give archaeologists, metallurgists, and benthic ecologists a better understanding of the conditions and long-term changes that occur to shipwrecks from corrosion, microbial activity, and pressure in the deep sea. And that will help scientists and policymakers protect and manage the site.
Will your new data settle the debate about how Titanic broke apart as it sank?
Looking at the 2010 data, Dave Conlin from the National Park Service did a statistical analysis of some 60 features on the seafloor and plotted out a pattern that we hadn’t observed before. Embedded in it may even be a timeline of what broke off the ship when.
We’re developing analysis techniques for debris patterns on the seafloor to sort of reverse the process, to reconstruct what happened to the ship at the surface. That can tell us where ships’ initial point of failure was and how it failed.
We know what happened to Titanic. It hit an iceberg. But there are some 14 large ships that are lost each year, most of them roughly 1,000 feet long, and we don’t have a clue what happened to them. Being able to develop these marine forensics techniques will help close the book on a lot of these accidents, as well as airplane accidents at sea.
There are also thousands of hazardous-waste shipwreck sites off the U.S. East Coast alone, and we need to understand what’s happening to these. Are the hulls decaying? Is there chance of their hazardous cargo being introduced into the environment? There are also some 500 tankers still carrying oil that were sunk during the world wars in the North Atlantic. Should we be concerned about future environmental disasters in our oceans?
If we can really understand what is happening at this one small spot on our globe, the Titanic site, we can apply that knowledge and techniques to other areas and studies.
Slideshow
Slideshow
 William Lange, director of the Advanced Imaging and Visualization Lab at WHOI, was on the 1985 expedition that brought back the first images of Titanic on the seafloor and on the 2010 expedition that has given us beautiful, newly published images of the wreck. (Photo courtesy of AIVL, Woods Hole Oceanographic Institution)
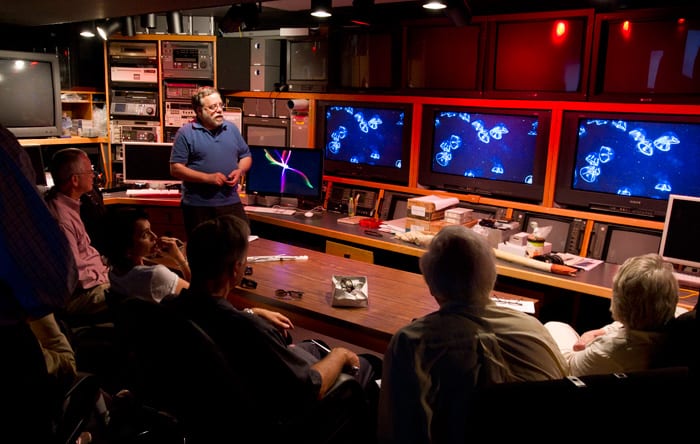 The Advanced Imaging and Visualization Laboratory at Woods Hole Oceanographic Institution specializes in high-resolution optical imaging and building and operating camera systems to work in hostile environments from more than 10,000 feet beneath the sea to 14,000 feet above sea level. (Photo by Tom Kleindinst, Woods Hole Oceanographic Institution)
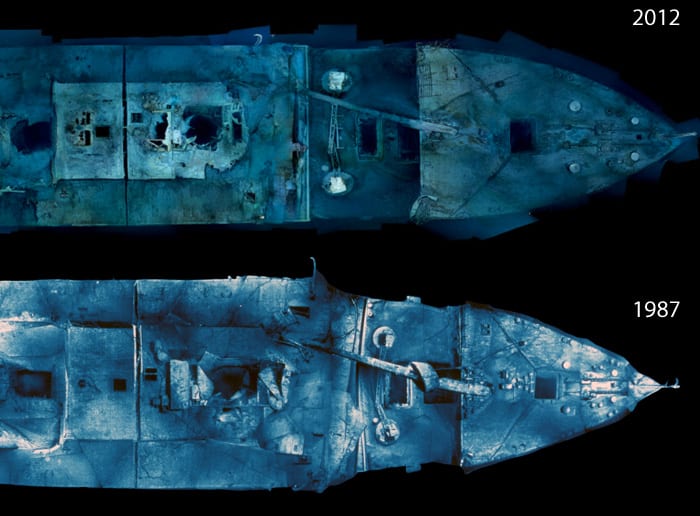 Photomosiacs of Titanic from 2012 and 1987 show that the bow of Titanic has remained relatively intact compared with the stern. The top mosaic consists of approximately 1,500 high-resolution still images shot in 2010, revealing structural changes that have occurred to the bow section since the last effort to mosaic the wreck. The bottom image was the first complete image of Titanic on the seafloor and is made up of 100 images pieced together from the 53,000 taken by a towed camera sled. It took approximately 700 hours to make. (©2012 RMS Titanic, Inc. Produced by AIVL, WHOI)
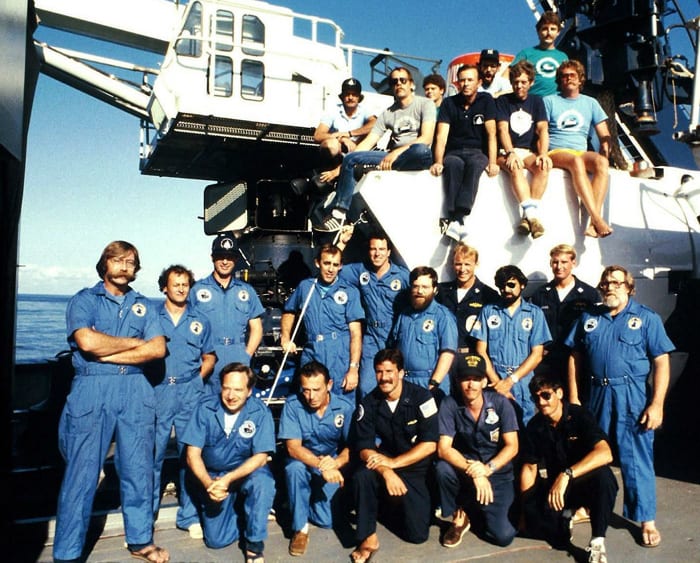 William Lange (2nd row, fifth from right) was part of the research team that returned to Titanic in 1986 with the submersible Alvin, on which pilots are sitting in the background. (Woods Hole Oceanographic Institution)
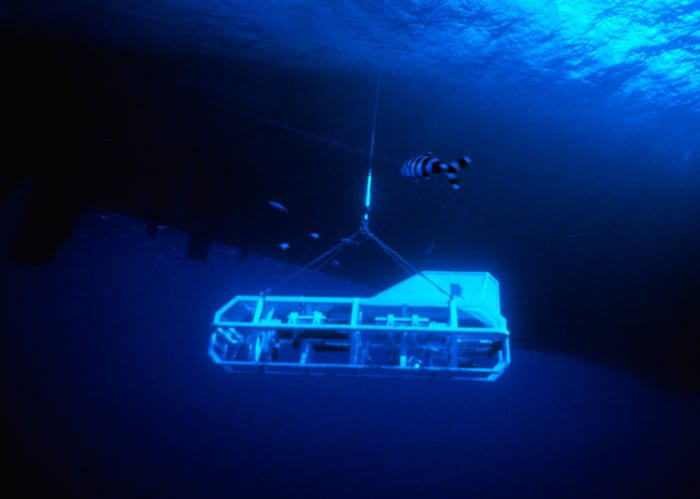 The Argo towed camera sled had television cameras and sonars that helped find Titanic. It was named by Titanic expedition leader Robert Ballard after the mythical Greek vessel that carried Jason on his quest for the Golden Fleece. In 1985, Argo represented a new generation of exploration vehicles for ocean scientists. (Woods Hole Oceanographic Institution)
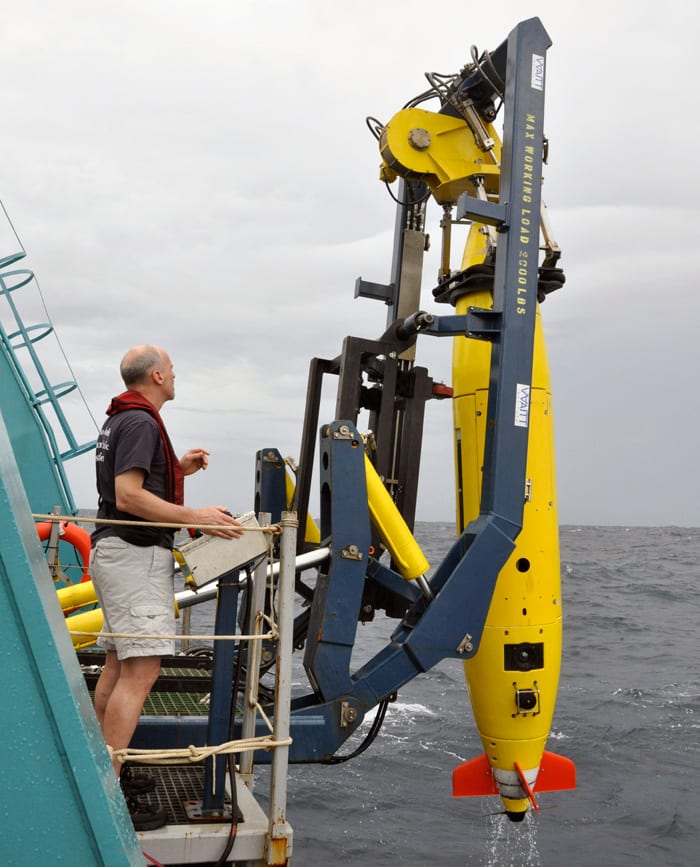 Two REMUS 6000 vehicles mapped the Titanic during the 2010 expedition. They are autonomous underwater vehicles that don’t have any cable connection to the surface. They were launched and followed preprogrammed tracks, carrying sonar devices to map the wreck site. REMUS, which stands for Remote Environmental Monitoring Units, was developed at WHOI. (Photo courtesy of Mike Purcell, Woods Hole Oceanographic Institution)
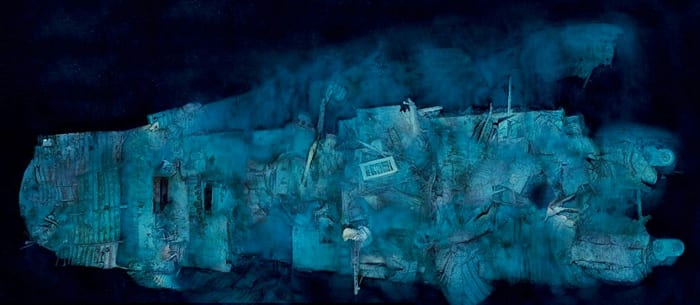 A view of Titanic looking down on the stern reveals significant structural damage caused when the ship broke apart and sank and the degradation that has occurred after 100 years on the seafloor. Approximately 1,500 images, collected in 2010, were stitched together to make this high-resolution mosaic. (©2012 RMS Titanic, Inc. Produced by AIVL, WHOI)
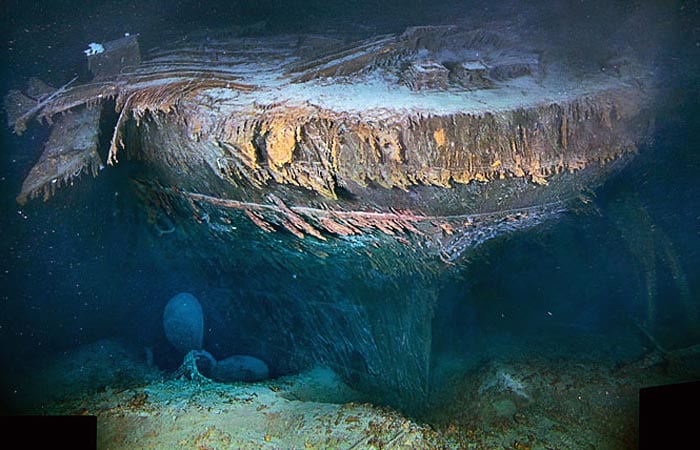
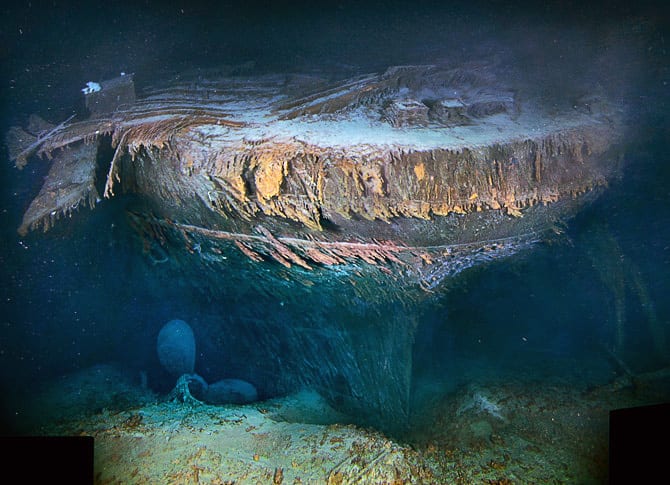 The aft end of Titanic's keel is deeply embedded in thick, clay-like sediment 12,000 feet below the surface of the North Atlantic. The port propeller is also visible in this view. (©2012 RMS Titanic, Inc. Produced by AIVL, WHOI)
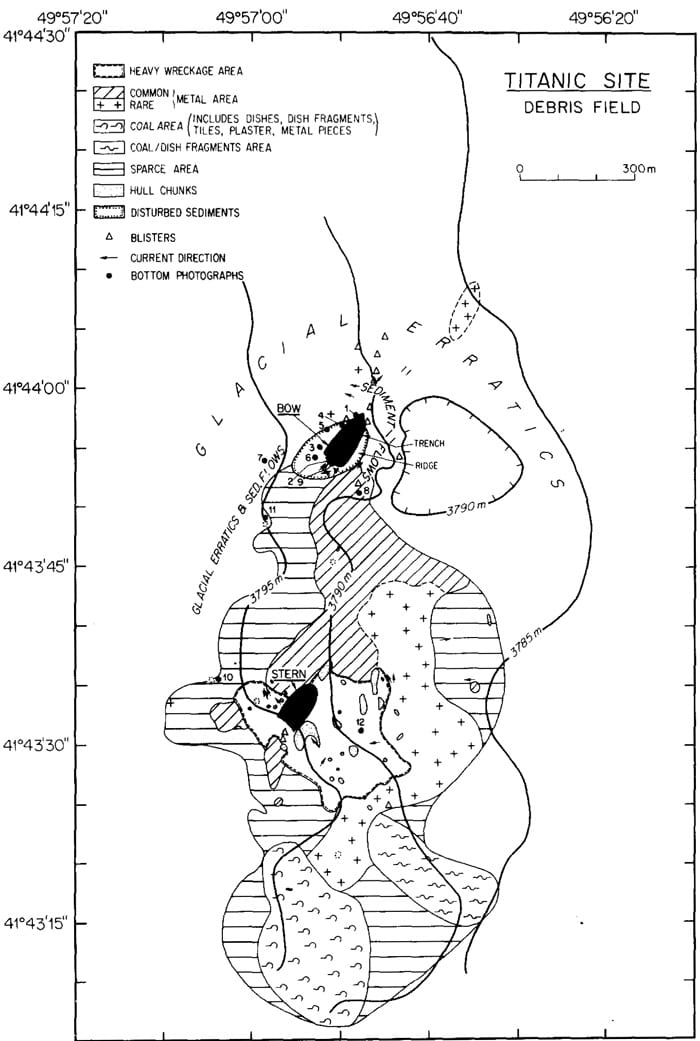
WHOI reserachers Bob Ballard, Elazar Uchupi, and William Lange created this first map of the Titanic wreck site based on images collected during two WHOI expeditions in 1985 and 1986. It was published in 1988 and was the most complete map until the new one was completed after the 2010 expedition.
(Ballard, Uchupi, and Lange, Woods Hole Oceanographic Institution)
Related Articles
- The story of a “champion” submersible
- Robots to the Rescue
- Who is Alvin and what are sea trials?
- 7 Places and Things Alvin Can Explore Now
- The story of “Little Alvin” and the lost H-bomb
- Meet the Alvin 6500 Team: Lisa Smith
- Overhaul to take Alvin to greater extremes
- Meet the Alvin 6500 Team: Rose Wall
- Racing an undersea volcano
Featured Researchers
See Also
- REMUS 6000 Oceanographic Systems Laboratory at WHOI
- 1985/86 Oceanus magazine on Titanic Issue of Oceanus magazine devoted to Titanic
- A Titanic Tale A former Alvin pilot recalls his dives on the shipwreck in 1986, from Oceanus magazine
- NOAA Website on Titanic
