A Century of North Atlantic Data Indicates Interdecadal Change
For hundreds of years mariners have recorded the weather over the world ocean. Some 100 million marine weather reports have accumulated worldwide since 1854, when an international system for the collection of meteorogical data over the oceans was established. These reports include measurements of sea surface temperature, air temperature, wind, cloudiness, and barometric pressure. In the 1980s, the National Oceanic and Atmospheric Administration (NOAA) compiled these weather observations into a single, easily accessible digital archive called the Comprehensive Ocean-Atmosphere Data Set. This important data set forms the basis for our empirical knowledge of the surface climate and its variability over the world’s oceans: One example of a variable system is the phenomenon known as El Nino in the tropical Pacific. A major challenge in climate research is to use these data to document and understand the role of the oceans in long-term—decadal and centennial—climate change.
December 1996 — For hundreds of years mariners have recorded the weather over the world ocean. Some 100 million marine weather reports have accumulated worldwide since 1854, when an international system for the collection of meteorogical data over the oceans was established. These reports include measurements of sea surface temperature, air temperature, wind, cloudiness, and barometric pressure. In the 1980s, the National Oceanic and Atmospheric Administration (NOAA) compiled these weather observations into a single, easily accessible digital archive called the Comprehensive Ocean-Atmosphere Data Set. This important data set forms the basis for our empirical knowledge of the surface climate and its variability over the world’s oceans: One example of a variable system is the phenomenon known as El Niño in the tropical Pacific. A major challenge in climate research is to use these data to document and understand the role of the oceans in long-term—decadal and centennial— climate change.
The figure at right shows the geographical distribution of weather observations over the oceans for three periods: 1880-1900, 1920-1940, and 1960-1980. Before the turn of the century, marine weather reports were largely restricted to shipping lanes in the North Atlantic and western South Atlantic. The North Pacific was not well sampled until after World War II, and the tropical oceans not until after about 1960; the southern oceans are still largely unmeasured. Due to the irregular sampling, we focus on describing climate variations over the North Atlantic back to the turn of the century. Fortunately, the North Atlantic plays an important role in world-ocean circulation.
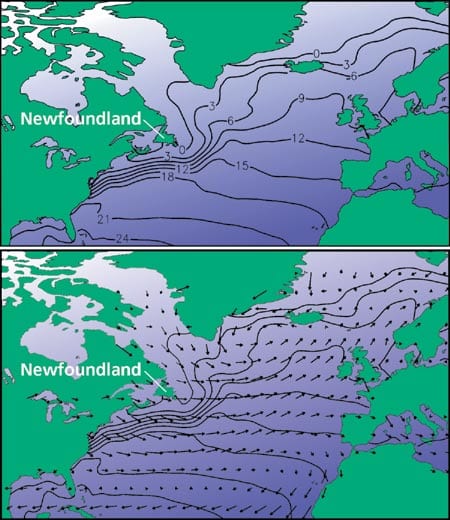
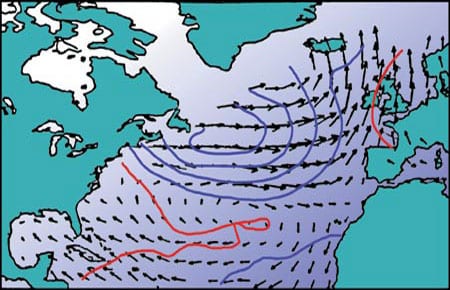
Two parameters are of key importance to the physical interaction between ocean and atmosphere: sea-surface temperature and near-surface wind. They control the rates of heat and momentum transfer between the two media. The figure below right displays the long-term average distributions of sea-surface temperature and near-surface wind over the North Atlantic. These charts are based upon all available observations since 1900. The prevailing westerly winds or “westerlies” are a well-known feature of the wind distribution. Sea surface temperatures are generally warmer in the East Atlantic than in the West Atlantic at the same latitude, reflecting the moderating influence of the Gulf Stream.
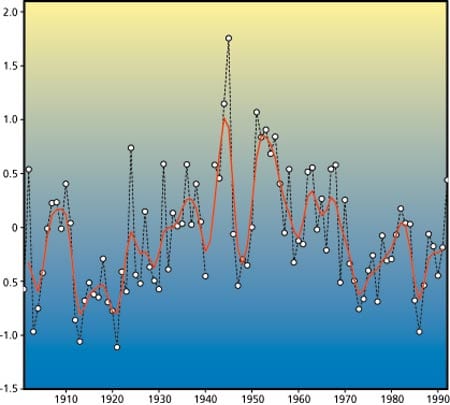
How have the wind and temperature distributions changed with time? A statistical technique called empirical orthogonal function analysis aids in identifying regions of coherent temporal change. The results of the statistical analysis point to the area directly south and east of Newfoundland as a site of pronounced sea surface temperature variability. The figure below right shows the history of sea surface temperatures in this region since 1900. There is a notable tendency for cold and warm periods to be spaced approximately one decade apart, as well as longer-term warming and cooling trends that span several decades. When the near-surface wind field is analyzed in a similar manner (but independently from the sea surface temperatures), similar decadal-scale oscillations and longer term trends are evident. As noted in the McCartney inset below, this basin scale pattern of variability has been labeled the North Atlantic Oscillation.
What is the nature of these decadal and multi-decadal fluctuations? Are they surface signatures of oscillations inherent to the deep ocean circulation? Are they global or confined to the North Atlantic? What is the role of the atmosphere? There is mounting evidence from mathematical models that the North Atlantic Ocean’s thermohaline (heat and density driven) circulation may behave as a damped oscillatory system at decadal-to-multidecadal frequencies, with the atmosphere supplying the energy to maintain the oscillations against dissipation. In order to test the relevance of hypotheses generated from the modeling work, further description of the observed climate record is needed.
A composite picture of the decadal-scale variations can be formed by averaging all of the cold (or warm) periods from the figure at right and subtracting the long-term mean. The figure directly below shows such an “anomaly” composite of the cold events. When sea surface temperatures to the east of Newfoundland are colder than normal, the near-surface westerly winds are stronger than normal. This relationship may be indicative of positive feedback between atmosphere and ocean: Stronger winds cool the ocean surface by enhancing evaporation and heat loss, while colder surface temperatures shift the latitude of the storm track and prevailing westerlies southward. Thus, the decadal swings in wind and temperature may be a manifestation of a coupled air-sea interaction process, in line with recent modeling results. What determines the time scale of the fluctuations, as well as their amplitude, are unsolved issues at this time.
The decadal fluctuations in sea surface temperature show an intriguing relation to the amount of sea ice in the Labrador Sea, as the figure below right shows. While information on sea ice dates back only to 1953, it is evident that each of the decadal swings of colder-than-normal temperatures was preceded by a period of greater-than-normal amounts of sea ice. The mechanism for this association is not well understood, although it is plausible that the cold, stable water mass resulting from melting ice could be carried by ocean currents into the region east of Newfoundland. Some researchers have hypothesized a complex feedback loop involving Arctic precipitation, runoff, salinity, and ocean circulation to explain the decadal-scale sea ice variations.
The lack of understanding of observed, long-term climate events in the North Atlantic underscores the need for further research, particularly in relating the deep ocean circulation to the surface conditions. The work described by Michael McCartney, Ruth Curry, and Hugo Bezdek is one important step in this direction.
This research was funded by a grant from the Atlantic Climate Change Program of the National Oceanic and Atmospheric Administration. Clara Deser was introduced to oceanography in 1983 while a Research Assistant in WHOI’s Physical Oceanography Department. She then went to the University of Washington to obtain a Ph.D. in atmospheric sciences, and has since kept her feet wet and her head dry at the University of Colorado at Boulder. Currently, she continues her intellectual pursuits on a part-time basis while raising two children with her husband Jonathan.
North Atlantic Oscillation
The top two panels of the figure at right, sea level pressure in millibars, show an example of regional shifting climatic patterns. From work by Jeff Rogers of Ohio State University, they show the high (+) and low (-) extreme states of the North Atlantic Oscillation (NAO). The regional atmospheric circulation over the North Atlantic is normally characterized by a subpolar high pressure cell centered near the Azores, and a subpolar low pressure cell centered near Iceland and Green-land. Between these two centers the westerlies blow from North America towards Europe, while to the north of the Icelandic low, and to the south of the Azorian high the winds are easterlies. A characteristic oscillation of the strengths and positions of these pressure centers occurs interannually and interdecadally. In the high NAO state, the westerlies are intense, and the cold continental air they carry off northern North America is warmed by heat liberated from the warm ocean waters they blow across, and that warmed air flows across northern Europe from the southwest. When the NAO is in its low state, the Icelandic low pressure center is displaced far to the south, off Newfoundland, and there is a high pressure center over northern Greenland, causing cold dry polar air to blow across northern Europe, and then westward across the northern subpolar area towards North America, warming on the way by the heat liberated from the ocean to the overlying atmosphere. In this low NAO state, northern Europe experiences much cooler summers and more severe winters than in the high NAO state, while Labrador experiences a milder climate. The bottom two panels of the figure show that the winter storm frequency patterns for the two extreme states of the NAO are quite different, with the northeastern US experiencing more Nor’easters during the low NAO state than during the high.
The differing winds and the accompanying warmer or cooler periods for northern Europe and northern North America that occur when the NAO index marches from one extreme to the other over periods of a decade or more contribute significantly to the distribution of global temperature change. Comparison of the NAO with a similar climatic index known as the “Pacific-North American” (PNA) index indicates that on decadal time scales there may be coordinated variations throughout the northern hemisphere or even the whole globe.
Slideshow