Cruise
Log: Monday, April 5, 2004
|
March
|
|
Sun
|
Mon
|
Tue
|
Wed
|
Thu
|
Fri
|
Sat
|
|
|
1
|
2
|
3
|
4
|
5
|
6
|
|
7
|
8
|
9
|
10
|
11
|
12
|
13
|
|
14
|
15
|
16
|
17
|
18
|
19
|
|
|
|
|
|
|
|
|
|
|
|
|
|
|
|
|
|
|
April
|
|
|
|
|
|
|
|
|
|
|
5
|
|
|
|
|
|
|
|
|
|
|
|
16
|
17
|
|
18
|
19
|
20
|
21
|
22
|
23
|
24
|
|
25
|
26
|
27
|
28
|
29
|
30
|
|
|
| |
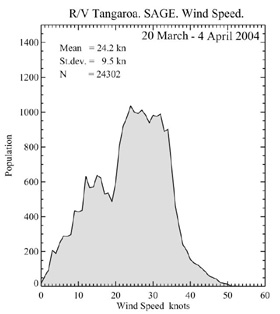 |
| Histogram
of wind speeds since the start of the voyage. Most of the winds are
in the 20-40 knot range, which is equivalent to 37-74 km per hour
(Credit: Peter Minnett). |
| |
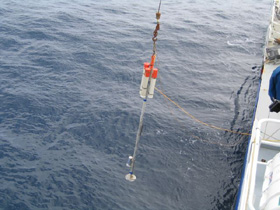 |
| Deploying
the 5-meter-long "micro" spar for wave measurements (Photo
by Alexander Morrice). |
| |
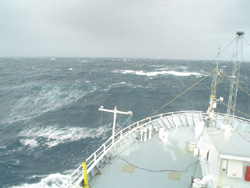 |
| Typical
ocean view during this voyage (Photo by Peter Minnett). |
Science on the high
seas
Contributors: Brian
Ward (WHOI), Peter Minnett (RSMAS)
Today was very much like
others - high winds, intervals of sun, and some rain showers. There was
a swell of a few meters running for most of the day. The routine of mapping
the patch continues, with CTDs both inside and outside the fertilized area.
With the passage of time it has become apparent that the patch is moving
clockwise around an eddy. The part we are focusing on is spread over an
area of 6km by 6km which makes it easier to track than the earlier narrow
filament.
The autonomous profiler
SkinDeEP was deployed 2 nights ago, and continues to make measurements through
today. The plan is to recover the instrument tomorrow. This will be the
longest single deployment in its 5-year life. These are also the roughest
conditions under which it has been deployed. SkinDeEP is making high resolution
vertical profiles of temperature, salinity, irradiance, and fluorescence.
This will tell us how sunlight penetrates the water to stimulate plankton
growth.
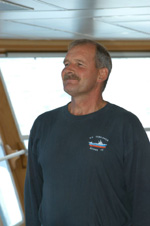 |
|
First mate Alexander Morrice on the bridge (Photo by Bill Main). |
The sea surface skin
temperatures from the M-AERI are also being made under the highest wind
speed conditions to date, so this should prove to be a very interesting
dataset for studying the surface where the atmosphere and ocean meet.
The microspar was
deployed tonight, and will remain in the water until tomorrow. This instrument
is a prototype and has a sensitive pressure sensor attached below the
waterline. The spar buoy, which is essentially a tube of about 5 meters
in length, moves with the waves, and this causes a change in pressure.
By analyzing the pressure signal, it is possible to derive information
on the wave field. These data will then be compared with the radar, which
remotely senses wave parameters.
Meal times continue to be a highlight of the day because of the quality
and variety of the food on offer. Next Day >>
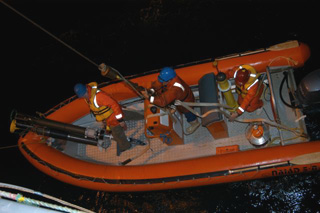 |
| Launching
the inflatable with Brian Ward (left), Peter Healey, and Craig Stevens
(right) for deployment of the autonomous profilers (Photo by Bill
Main). |
|
