Why Haven’t the Cod Come Back?
Preserved fish scales yield clues to ocean ecosystem changes
“This place is a historic treasure,” said Eric Robillard. But you wouldn’t think of it that way at first glance.
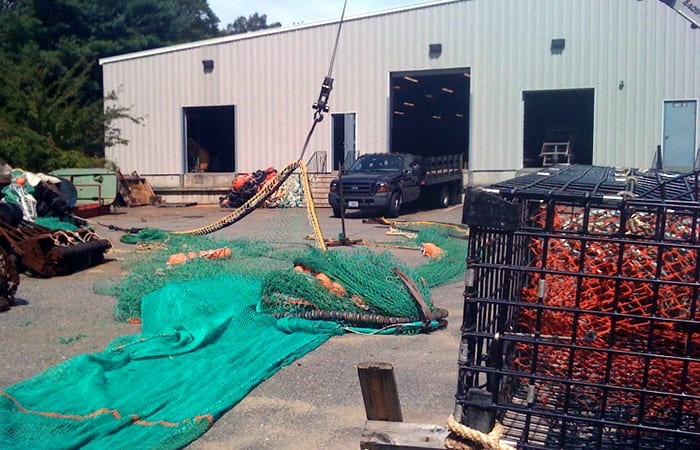
The building is hard to find, a nondescript warehouse located on a street full of them. The only signals that you’re in the right spot are the trawler doors sitting out by a loading dock and a weathered National Oceanic and Atmospheric Administration logo—the gull, sea, and sky all beginning to fade to pale shades of welkin and lapis.
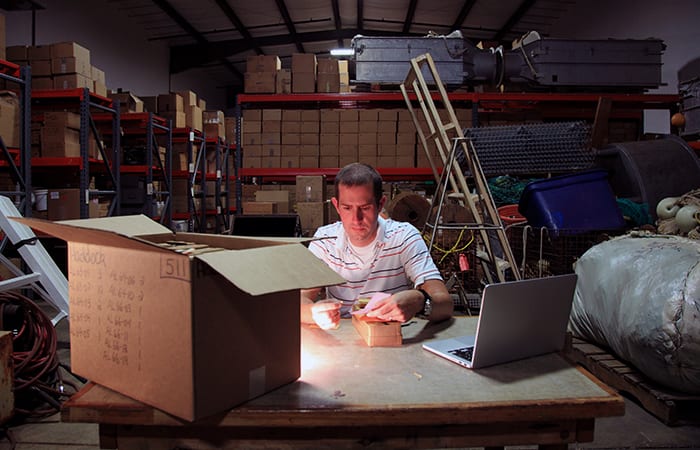
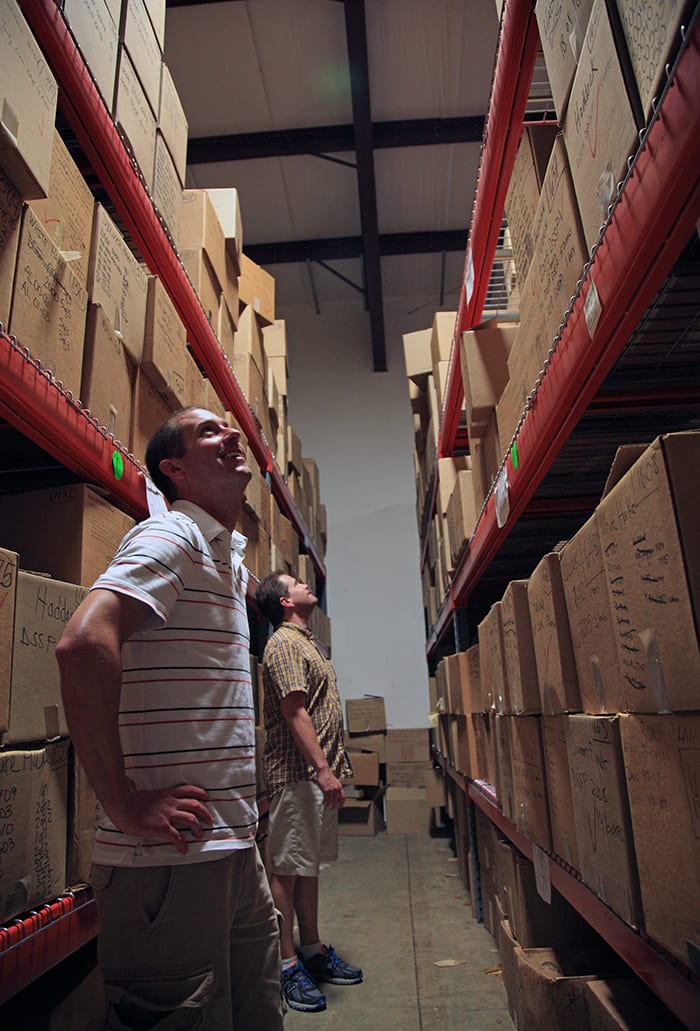
Inside, stacks of repaired trawler nets and buoys await future deployment on annual surveys by NOAA’s Northeast Fisheries Science Center to assess fish stocks. These expeditions glean the treasure stored here, said Robillard, who heads the center’s Fishery Biology Program. Past the usual warehouse detritus—a gutted microfiche machine and a refrigerator-size microwave—are 1,800 cardboard boxes, stacked floor-to ceiling on rows of 15-foot-high metal shelves.
This is the humble, hidden trove that has proved so valuable for Joel Llopiz, a biologist at Woods Hole Oceanographic Institution (WHOI).
“I had to go through all of these,” he said, his hand gesturing across the caverns of cardboard boxes. The fluorescent ceiling light is out, so he holds a trouble light up like a torch, craning his neck and looking over row after row, reading the names of fish species—haddock, cod, yellowtail—and years—2001, 1985, 1957—handwritten on the side of each box. At last, he stops searching.
“This is it.”
He hangs the light on a shelf, rolls over a ladder, and pulls down a box from high above. Dust motes swirl around the caged lightbulb as Llopiz opens the box and begins dismantling a matryoshka series of smaller boxes and envelopes until finally unwrapping a piece of pink paper. He shakes out what appear to be dried oatmeal flakes into his hand.
“These,” he carefully spreads the flakes out across his palm, “are haddock scales from the 1930s.”
“We collect over 100,000 samples from over 30 important Northeast fisheries species every year,” said Robillard: scales, otoliths (ear stones), stomachs, spines, and opercula (bony flaps that protect gills) of fish, as well as shells of clams and scallops. Collected since the 1930s, these samples awaited technological advances that allow them to be examined in ways never imagined when they were first collected.
‘Regime shifts’ in the sea
Now, Llopiz and WHOI colleague Simon Thorrold are tapping into this archive as a window into the past, looking for changes in the ecosystem that may be compromising one of the world’s most productive fishing grounds, Georges Bank. Their research could help crack a troublesome mystery: Why have the once-abundant stocks of codfish and other species failed to fully recover, even after decades of management intended to end overfishing?
Llopiz and Thorrold are looking for further evidence of a “regime shift”—a fundamental reorganization of the region’s marine food web. Changes generally are driven by organisms at the bottom of the food web called primary producers: the diatoms and other copious single-celled organisms that are grazed upon by small creatures. If conditions change and one species becomes more or less abundant, “the effects would cascade up the food web, affecting larger consumers like haddock,” Llopiz said.
The research looks to tease apart when regime shifts may have occurred, what caused them, and what impact they had on the Georges Bank ecosystem. Llopiz and Thorrold treat each scale as a snapshot of the food web for the year it was collected, telling them which primary producers anchored the food web and how the haddock fared under that regime.
First, they ascertain the concentration of a carbon isotope, 13C, within the scales. All primary producers take up 13C from the surrounding environment. But they do so each in its own way, leading each producer to have a unique ratio of 13C to 12C, a more abundant form of carbon. This ratio is called an “isotopic signature.”
The signatures pass from producer to consumer changing only slightly. Even though a diatom may be eaten by a copepod, which is then eaten by a shrimp, which is then eaten by a haddock, Llopiz and Thorrold can still detect the 13C signature from the diatom within the haddock scale.
The 13C signatures help differentiate one ecosystem regime from another. With an extensive archive of samples from a prolonged period of time, patterns may emerge in the 13C values that indicate one or multiple regime shifts.
Another piece of the puzzle, specifically related to the impact on haddock, is another stable isotope, 15N. By examining it, the scientists can determine what is called the “trophic level” of each haddock, or its place within the food web hierarchy.
Unlike 13C, the isotopic signature of 15N relative to the more abundant 14N does change substantially as it passes up the food web. The metabolic processes for most consumers selectively retain and incorporate higher levels of 15N relative to what they excrete, meaning that the higher up in the food web an organism is, the more 15N it has.
For haddock, a higher trophic level might mean feeding on larger, more nutritious prey that can lead to optimal growth and reproduction. Conversely, a lower trophic level could be associated with scrounging for lower-quality food leading to a stock that reproduces less robustly.
The scientists then pair trends in trophic levels and carbon signatures with historical environmental data, deciphering the root cause for seemingly subtle, but important, changes in the ecosystem. Looking at environmental factors such as ocean temperature, currents, and salinity, Llopiz tries to pinpoint the triggers responsible for regime shifts.
For the next step of the research, Llopiz and Thorrold will use an approach that can draw even more information out of the haddock scales, one that can identify isotopic signatures within individual amino acids. “So now, instead of getting one carbon or nitrogen value per scale, you get a value for each element-amino acid combination, and there can be twelve or so amino acids analyzed per scale,” Llopiz said.
A new paradigm in fisheries management
This research fits into a new ecosystem-based approach to fisheries management, in which managers go beyond considering just fishing pressure and account for environmental factors, species interactions, and the health of the entire ecosystem.
During the 20th century, advances in fishing technology—burgeoning trawler fleets, factory fishing ships, and advanced navigational aids—brought important and iconic fisheries to the brink of collapse. The stock of spawning cod on Georges Bank, for example, is less than one percent of what NOAA officials believe it should be in a healthy ecosystem.
Since the mid-1990s, both American and Canadian governments have enacted strict regulations curtailing overfishing. While some fish stocks have responded positively, cod continue to face significant challenges.
The New England Fisheries Management Council has recommended that the annual landing for Georges Bank cod in 2013 not exceed 2,506 metric tons—a far cry from the 10,749 metric tons landed as recently as 2001. The toll on the fishing industry has been devastating, and answers as to why cod have struggled, despite steep catch reductions, have not been forthcoming.
Llopiz believes his research could potentially illuminate the role food web dynamics have on this slow recovery.
“A fish caught in an unproductive regime is not equal to a fish caught in a productive one,” Llopiz said. “Those two populations will not recover similarly.”
Understanding this, managers could set quotas and make decisions based on knowledge of the underpinnings and interconnectedness of Georges Bank’s delicately balanced ecosystem. And they could strike a better balance between fishing and conservation that responsibly stewards a resource that has been so important to the history, economy, and culture of the northeast United States.
This research is funded by Woods Hole Sea Grant.
Slideshow

Slideshow
 Fish scales from assorted Northeast fish species, dating back to the 1930s, are stored at a NOAA warehouse in Pocasset, Mass. The facility also preserves samples of otoliths (ear stones), stomachs, spines, and opercula (bony flaps that protect gills) of fish, as well as shells of clams and scallops. (Photo by Daniel Cojanu)
- Trawler nets and buoys await future deployment on annual surveys by NOAA’s Northeast Fisheries Science Center to assess fish stocks. The surveys collect and preserve samples from more than 30 Northeast fish species. (Photo by Shelley Dawicki, NOAA)
- WHOI biologist Joel Llopiz (left) and Eric Robillard, head of the NOAA Northeast Fisheries Science Center’s Fishery Biology Program, search among cavernous rows of shelves filled with boxes of fish scales and other samples stored in a NOAA warehouse in Pocasset, Mass. The facility is a treasure trove for Llopiz and other scientists who anaylze the samples for their research. (Photo by Daniel Cojanu)
Related Articles
- Behind the blast
- Sonic Sharks
- Tracking big fish at fine scales
- Hope in fossilized fish bits
- A cascade of life
- As illegal fishing rages on, is there any hope on the horizon?
- Casting a (long) line to the twilight zone food web
- Wilmington’s shark tooth divers can thank the last ice age for their treasure trove
- Edie Widder: A light in the darkness


