Oceans of Change
WHOI scientists learn how the ocean shapes—and is shaped by—global climate
 This article printed in Oceanus Fall 2019
Estimated reading time: 26 minutes
"THE SEA NEVER CHANGES, AND ITS WORKS, FOR ALL THE TALK OF MEN, ARE WRAPPED IN MYSTERY." So observed the narrator of "Typhoon," Joseph Conrad's 1902 novella. But today, we know that his mariner protagonist was wrong on both counts. The ocean, in fact, is changing profoundly. And while its complex mechanisms are no longer shrouded in mystery, countless riddles remain unsolved.
Covering 71 percent of our blue planet, the ocean is a focal point for climate research. Because it stores 95 percent of the excess heat created by greenhouse gases that humans put into the atmosphere, the ocean acts both as a buffer against rapid warming stoked by today's greenhouse gas emissions, and as a memory bank of today's rising temperatures.
As world leaders in ocean science and engineering, researchers at Woods Hole Oceanographic Institution (WHOI) are at the front line of climate science. Directly or indirectly, virtually all of their work is answering fundamental questions about how the waters that wrap the Earth are responding to a warming planet. Taken together, their investigations are helping to shed light on a troubling new era.
"Ninety-seven percent of our water is in the ocean. If you want to understand anything about rainfall on land or even about drought, you need to understand the ocean."
—WHOI climate modeler Caroline Ummenhofer
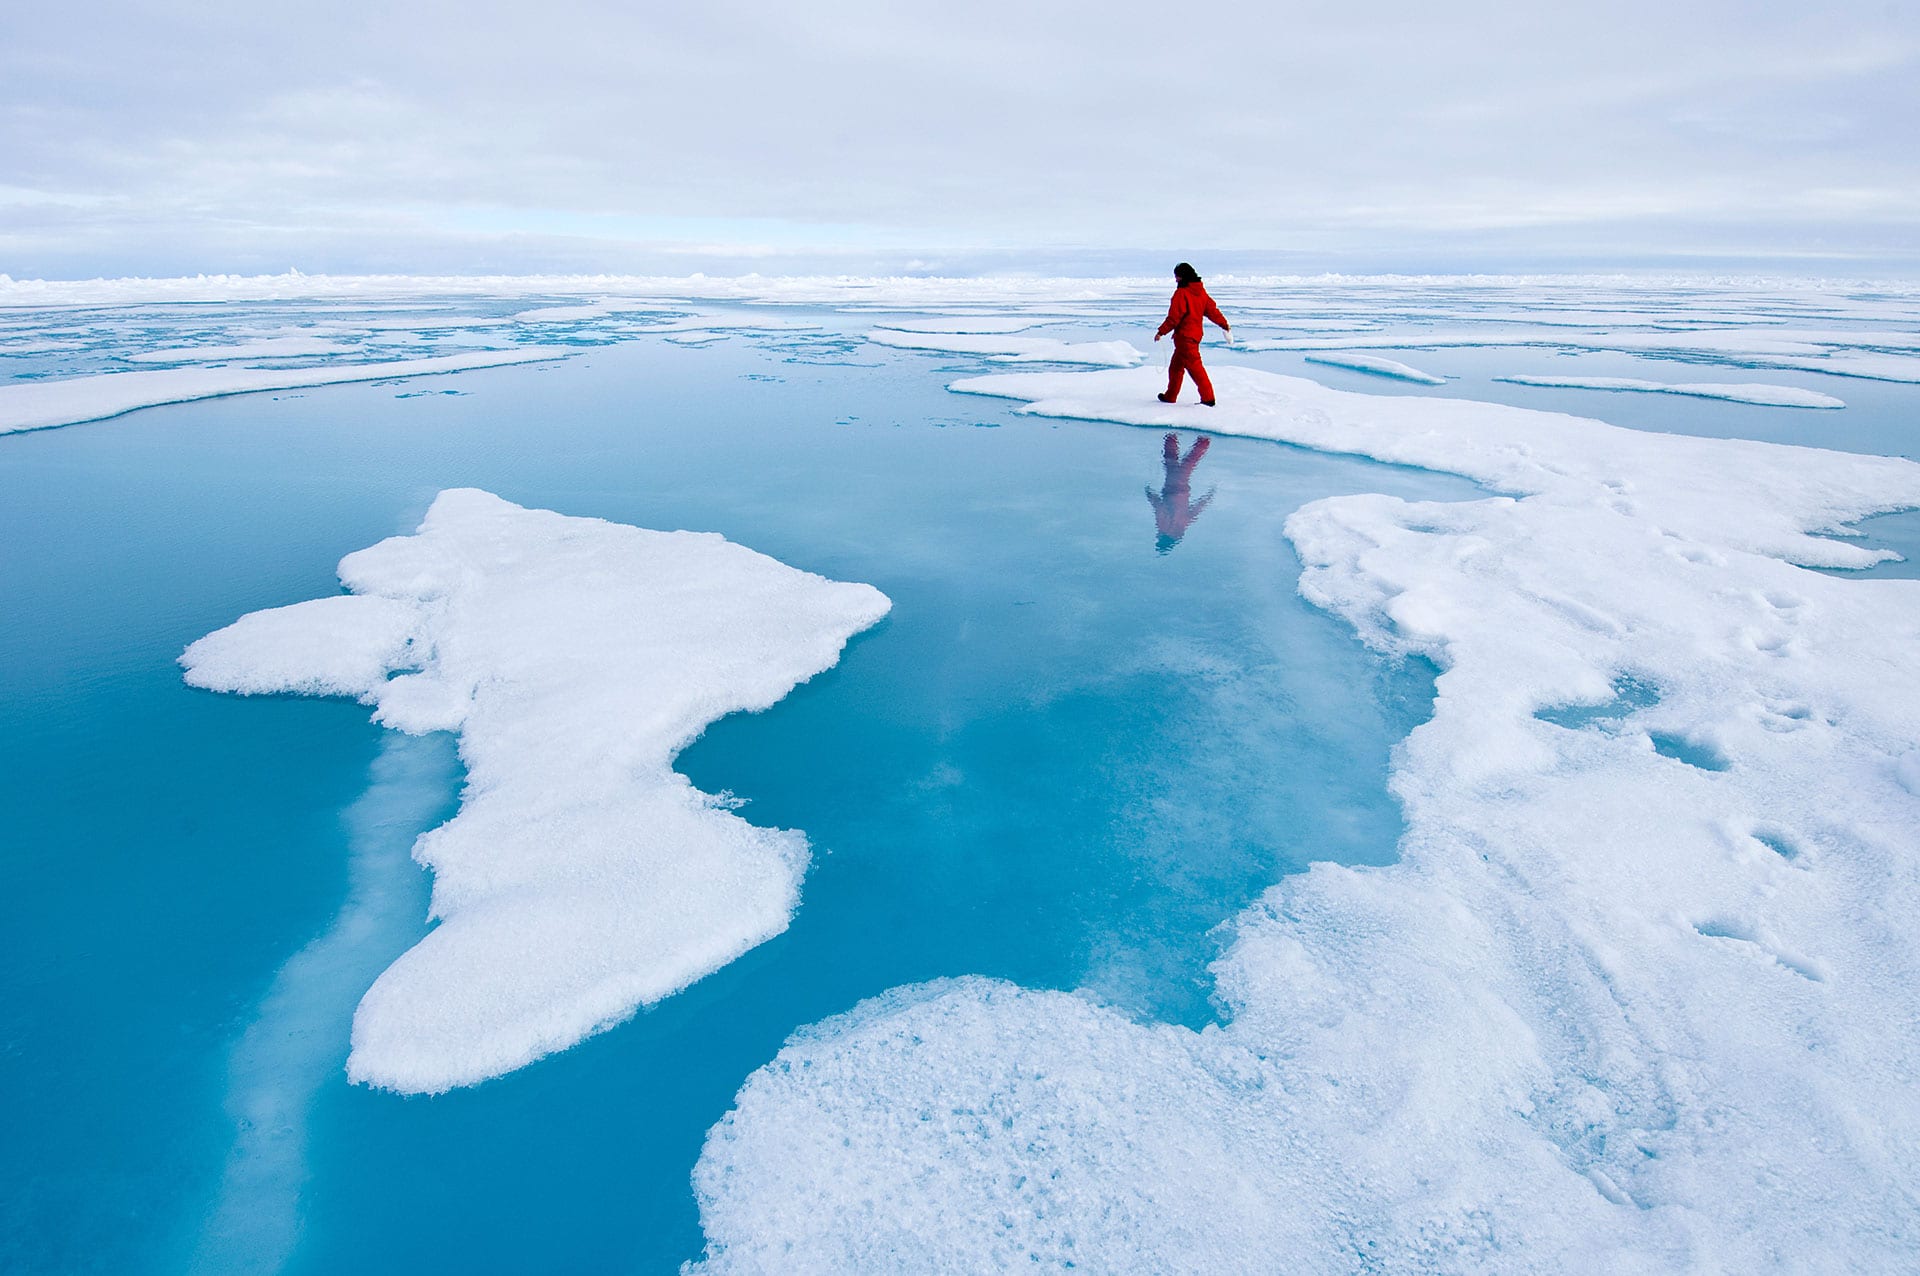
(Photo by Christopher Linder, ©Woods Hole Oceanographic Institution)
Headline News
Evidence for the ocean-climate connection is everywhere.
In 2014, a report from the Intergovernmental Panel on Climate Change (IPCC) noted, with italicized emphasis: "It is virtually certain that global mean sea level rise will continue for many centuries beyond 2100."
Not only is the ocean warming and expanding, it is also acidifying as it absorbs carbon dioxide (CO₂). "Once-in-a-century" storms that have killed thousands of people are making regular appearances: from Hurricanes Katrina in 2005, Sandy in 2012, and Harvey and Maria in 2017, to Myanmar's Cyclone Nargis in 2008 and the Philippines' Typhoon Haiyan in 2013. Devastating droughts, a consequence of the altered global water cycle, are parching South Asia, Africa, Australia, Central America, and the American West. Scientists speak matter-of-factly of the possibility that, within the next 500 years, Greenland's ice sheet could disappear entirely.
"The urgency of understanding climate change is really the urgency of understanding the impacts of climate change. And to do that, you have to know how the ocean works."
—WHOI physical oceanographer, Susan Wijffels
"The realization of what a vital role the ocean plays in Earth's climate system has driven not just scientific developments, but observational and engineering developments, too," said Susan Wijffels, a physical oceanographer whose work on past and present ocean data has changed the way researchers quantify the ocean's uptake of heat. Growing up in the Australian outback, Wijffels learned early on about the central role of the ocean in tempering the earth's climate. Today, her mission is to decipher the intricacies of this natural buffering process.
"If we want to have a shot at navigating changes over the next 50 or 100 years, we have to demystify the ocean," she said.
"Traditionally, the earth's water cycle has been observed from land-hydrologists, water resource managers, and atmospheric scientists worked on it," said climate modeler Caroline Ummenhofer. Her studies of Indian Ocean monsoon patterns, and of extreme weather events from Australia to the U.S. Midwest, have challenged conventional scientific wisdom.
"Ninety-seven percent of our water is in the ocean," Ummenhofer said. "If you want to understand anything about rainfall on land or even about drought, you need to understand the ocean."
According to biological oceanographer Carin Ashjian, who has made critical findings about how global warming has affected marine ecosystems, "The urgency of understanding climate change is really the urgency of understanding the impacts of climate change. And to do that, you have to know how the ocean works."

Oceanic Memory
Since the turn of the 20th century, the average level of the global ocean has crept up between 6 and 8 inches.
It is rising primarily because of two factors. One is melting ice sheets and glaciers. The other is warming water itself, which takes up more volume because of thermal expansion.
When Geoffrey "Jake" Gebbie, a physical oceanographer and paleoclimatologist, analyzes today's rising ocean, he looks to the distant past. Waters receded and waters rose long before human-induced climate change. Understanding how, and at what pace, these natural phenomena occurred will sharpen predictions about how the ocean in the Anthropocene (the current, human-dominated geologic age) will respond to global warming.
"These waters are so old and haven't been near the surface in so long, they still 'remember' what was going on hundreds of years ago"
—WHOI physical oceanographer and paleoclimatologist Geoffrey 'Jake' Gebbie
In a paper published in January 2019, Gebbie presented a curious discovery. While today's ocean surface waters are warming, waters in the middle layer of the Pacific-about 2 kilometers (1.2 miles) down-are actually getting colder, in response to the cooling trend that marked the onset of the Little Ice Age, which lasted between the 14th and 19th centuries. The period was marked by severe winters that arrived early and lingered well into spring (Dutch paintings from the era often featured ice skaters frolicking on frozen canals).
To arrive at this finding, Gebbie and his colleagues drew on observations from the 1872-1876 voyage of the HMS Challenger-a three-masted wooden sailing ship that made the first modern oceanographic expedition, lowering thermometers to the sea floor using hemp ropes. Comparing these historical data with modern-day measurements, Gebbie found evidence of waters untouched by the planetary warming that began with the Industrial Revolution.
"These waters are so old and haven't been near the surface in so long, they still 'remember' what was going on hundreds of years ago," he said.
Although the net effect of this submerged layer of cool water on future climate conditions is unclear, there is an upside.
"The long memory of the ocean is a saving grace," said Gebbie. "It has been buying us more time than we otherwise would have had to come up with solutions that address climate change."
The downside is that this thermal shock absorber comes with a price: Once today's warm surface waters reach the depths, they will stay there for several hundred to a thousand years.
"The ocean cannot destroy the heat that it's currently taking up," Gebbie said. "It will sequester today's warm surface water, recycle it, and later expel it back into the atmosphere."
In a separate 2019 study, Gebbie looked at paleo-oceanographic records-such as the chemical composition of shells found on the sea floor-to calculate how much the ocean has risen due to warming waters since the end of the last Ice Age some 20,000 years ago. The answer: about 130 meters (427 feet), which comes to about one meter for every two degrees Celsius of warming (or three feet for every one-degree-Fahrenheit rise).
"That's alarming," Gebbie said, "because the world has already warmed by one degree Celsius just over the last 150 years. And although our inference may only apply over long time periods, it does give some guidance on where the planet is headed. Even greater sea-level rise could occur if Greenland or West Antarctica pass a threshold of excess melting."
Collecting carbon clues-Marine chemist Ken Buesseler (left) and research specialist Steven Pike prepare to deploy a sediment trap to gain insight into the role of the upper ocean in Earth's carbon cycle and climate system. (Photo by Jennifer Kenyon, ©Woods Hole Oceanographic Institution)
The Twilight Zone's Crucial Carbon Pump
When CO₂ enters the ocean, where does this heat-trapping gas go?
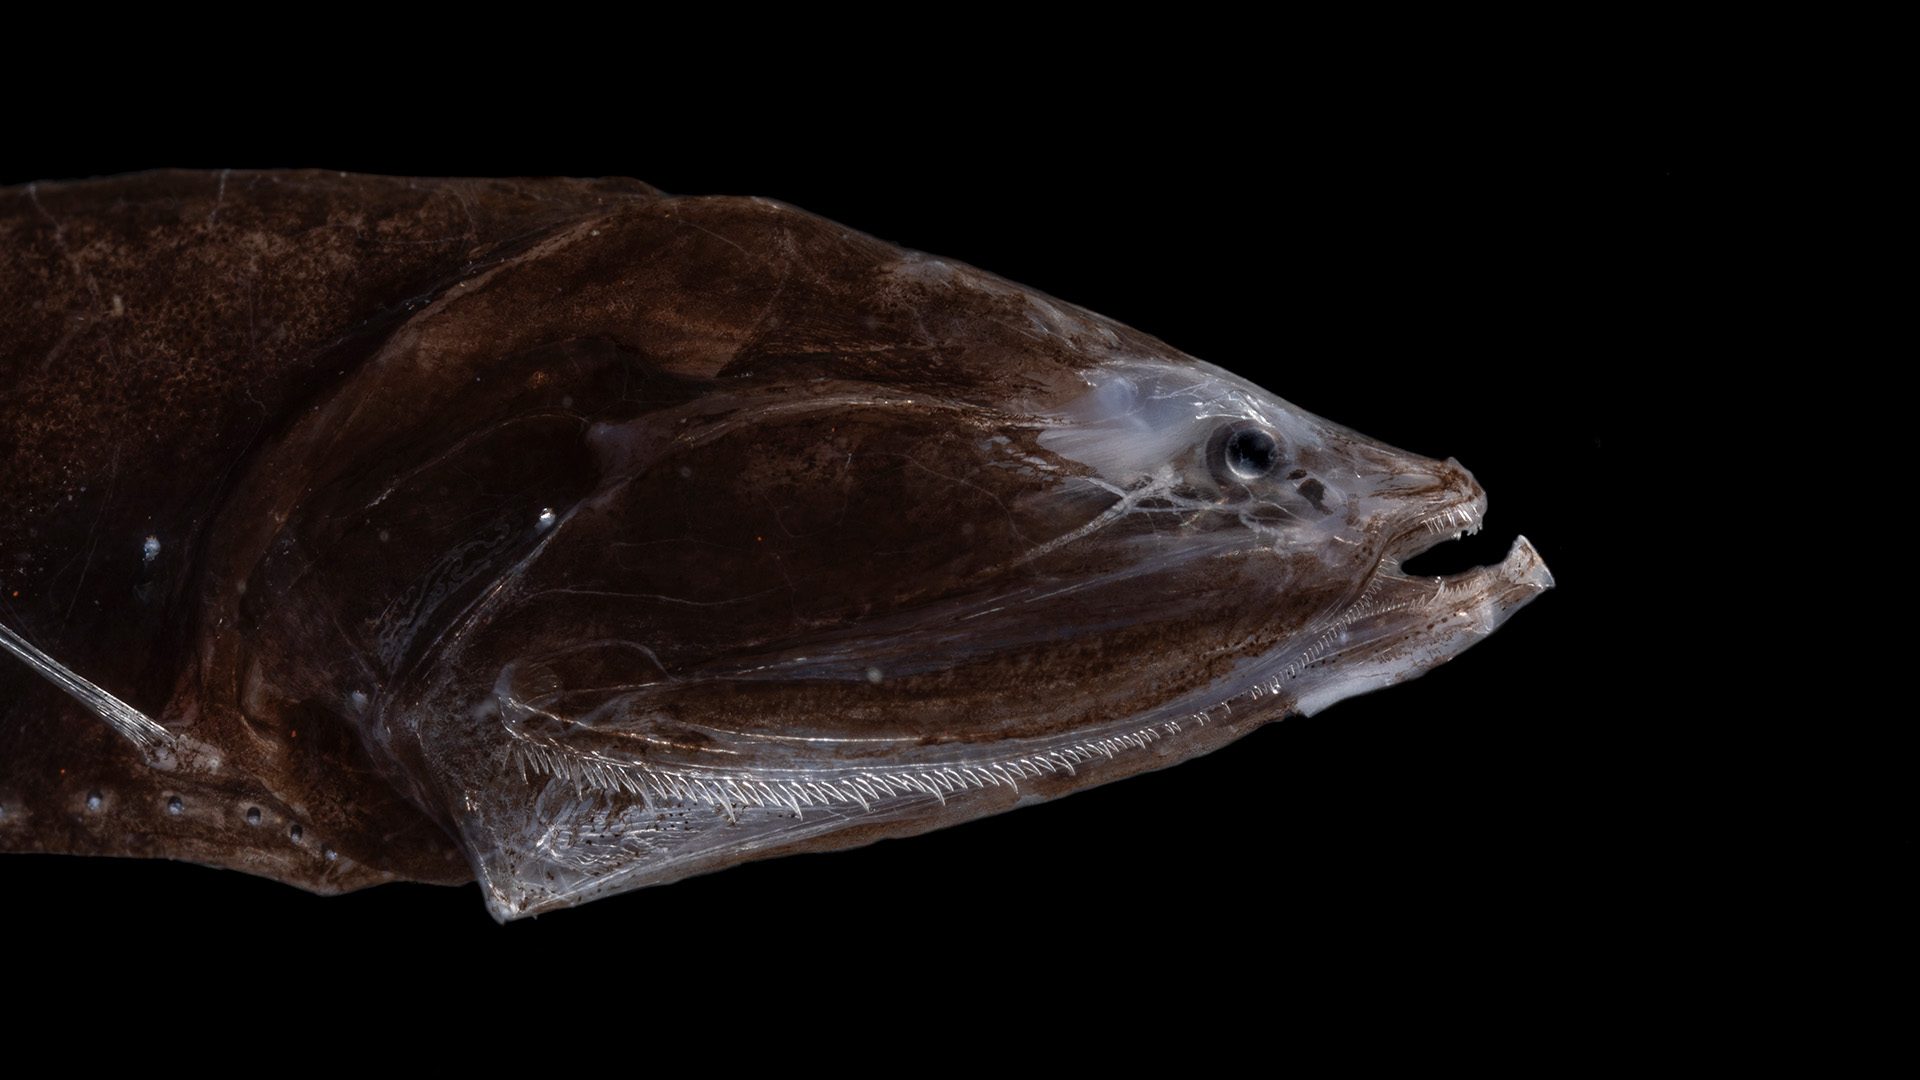
Geochemist Ken Buesseler and others have shown that one key to the ocean's capacity to remove or sequester carbon is the ocean's "twilight zone," a mysterious stratum of ocean beneath the sunlit surface layer, which ranges from 30-200 meters (about 100-650 feet), to about 1,000 meters (3,300 feet) down. Also called the mesopelagic zone, this enigmatic mid-layer of water is home to otherworldly creatures with names to match-bristlemouth, hatchetfish, devil squid, stoplight loosejaw. Were it not for these deep, inky-black waters, the climate on our planet would be unrecognizably warmer.
The removal of CO₂, its conversion to organic carbon, and the carbon's dispatch to the ocean's depths is known as the ocean's biological pump.
"If you turned off this biological carbon pump-let's say, you somehow made the ocean sterile and sucked out all of the twilight zone's organisms-you would more than double the amount of CO2 in the atmosphere that humans have added," said Buesseler. "That would take us to temperatures we haven't seen in 50 million years, when the Earth was 20 degrees Fahrenheit warmer than today, there was no ice on either Pole, the seas were much higher, and many parts of the world where people now live were uninhabitable."
The pump operates through different mechanisms. In one, a flurry of carbon-laden particles from the surface-dead phytoplankton, feces produced by zooplankton, and other material collectively known as "marine snow"-sink, with about 90 percent serving as the food supply for twilight zone animals and bacteria.
In addition, multitudes of fish, squid, zooplankton, and other mid-ocean denizens migrate nightly close to the ocean's surface to feed, returning to the twilight zone by daybreak, carrying the carbon in their food with them. Theirs is the largest animal migration on the planet, and a vertical one at that. These migrating species transport massive amounts of carbon from surface waters to the deep ocean.
At the same time that the biological pump moves carbon, physical processes such as the global ocean's overturning circulation-a system of surface and deep currents around the globe-transport suspended and dissolved carbon to the deep ocean, but on longer time scales.
Buesseler wants to know exactly what fraction of surface carbon is being shuttled to the twilight zone and on to the deep ocean, where it may stay for hundreds to thousands of years. That calculation would profoundly shape climate predictions.
"The twilight zone is the gateway to the deep ocean for carbon sequestration," Buesseler explained. "But there's a huge range of estimates of how much is entering the twilight zone-from four to 12 gigatons of carbon annually." (For comparison, one gigaton weighs about the same as six million blue whales.) "That eight-gigaton difference in the estimates is huge-about the same magnitude as the amount of carbon humans put into the atmosphere every year. If we reduced that uncertainty, we could predict climate changes better and more wisely invest the billions of dollars that go to climate adaptation or mitigation. We could better predict sea level rise and help planners determine where to build roads and bridges and how to adapt our coastal cities to rising sea levels."
Today, Buesseler sees a new potential danger on the horizon. Located largely in waters outside of national boundaries, the twilight zone is starting to pique the interest of commercial fishing operations harvesting organisms to be converted into feed for chickens, farmed fish, or the nutraceuticals market. Unless it is done sustainably, such extraction could disrupt the ocean's vital carbon pump.
"This threat has motivated WHOI's Ocean Twilight Zone program to some extent," he said. "We need to understand how much carbon is getting through to the twilight zone, and this takes knowing not only how many organisms are there but much more about their life histories and diversity. We need to get ahead of the game before it becomes commercialized."
The monsoon's rainfall, drought, and winds are notoriously hard to predict.
(Photo downloaded from PBS LearningMedia, www.pbslearningmedia.org.)
Precious Coral Archives
The South Asian monsoon-the fiercest monsoon system in the world-affects one-sixth of the human population.
The main source of water for nearly one billion people living on the Indian subcontinent, the South Asian monsoon drives the region's health, well-being, and prosperity. (Sixty percent of Indian agriculture, for example, depends on rain rather than on irrigation, and farming employs about half of India's population.) Yet the monsoon's often-torrential summer rainfall, winter drought, and seasonal winds are notoriously hard to predict. Equally baffling is how the monsoon has responded to anthropogenic factors, and whether global warming is exacerbating its powerful forces.
Biogeochemist Konrad Hughen has devised ingenious methods of tracking the monsoon's evolution across centuries, filling in a picture of Earth's natural climate variability and the places where climate shifts have altered familiar weather patterns. This year, in a study that analyzed Red Sea corals, he showed that monsoon winds have strengthened over the past 250 years.
Corals contain some of the best environmental records of long-term climate change nature has to offer, and Hughen-a leading coral "archivist"-effusively praises their value.
"They are amazing archives, time machines, incredible scrolls from the past," he said. "They are meteorological stations that have been chugging away for hundreds of years, preserving faithful data about climate. And they don't move, so you can clearly see changes over time."
Tropical corals grow fast, live for hundreds of years, and lay down annual growth bands-similar to tree rings or ice cores-in their calcium carbonate skeletons. Not only do these bands serve as a timescale going back 400 to 500 years or more, but the coral skeleton chemistry also reflects ocean conditions at the time the coral was alive and accreting its structure. Researchers use microdrills to sample every half millimeter of coral cores, then chemically analyze the powders from these coral "log books," which are more like monthly or even weekly weather diaries.

In conceiving his 2019 study, Hughen drew on the fact that winds driven by the South Asian monsoon stirred up howling dust storms through the Tokar Gap in Sudan, eventually depositing the dust into the Red Sea. The dust releases the element barium into the seawater, which dissolves and is then incorporated into coral skeletons. Hughen used barium levels as a proxy for wind speed, demonstrating that as the climate warmed, monsoon winds became both more intense and less variable.
Analyzing coral core samples, Hughen has proven that the variability of the North Atlantic Oscillation-a cycle of high and low atmospheric pressure systems between the Azores and Iceland-is increasing.
"The highs get higher, the lows get lower," he said. This more extreme pattern may intensify winter weather patterns, both mild and severe, in the U.S.
Hughen worries that warming waters and ocean acidification will destroy the coral reefs-and the climate records their skeletons contain.
"Corals are dying and disappearing in the same way that ice caps are melting," he said. "Coral bleachings from 2015 through 2017 were hideous, and they were globally widespread. I've been doing this for 20 years, and I feel like more often than not, I'm coring dead or dying or bleached coral."
If corals continue to perish on massive scales, their dead colonies will become susceptible in less than a decade to bioeroders such as burrowing worms and clams-eroding their skeletons, and the precious climate records they contain.
Hughen sees an urgent need for a global coral sampling program to collect cores from healthy reefs while they are still alive. These cores would be a trove of climate information to be analyzed over the coming decades.
"We need to do it now," Hughen said. "Even five years from now might be too late. The window is closing."

Models of Change
In addition to preserving long-term records of past climate, the ocean provides clues to predicting future short-term weather patterns, such as storms and droughts.
One of the challenges of predicting climate trends is that human-caused changes overlap with natural fluctuations in climate that have existed for millennia-predictable patterns of wet years and dry years, for example. How can scientists tease apart natural cycles of weather from human-induced "outlier" events that seem to crowd the weekly news cycle?
Climate modeler Caroline Ummenhofer utilizes climate models to reveal connections between ocean processes and their impacts all over the world. She is especially intrigued by the Indian Ocean-a remote body of water that has historically been undersampled by scientists. Her studies have linked conditions in the Indian Ocean to the Asian monsoon, and to droughts, floods and/or wildfires in Australia, East Africa, and Indonesia.
People don't realize how much their weather-in particular, rainfall-is affected by the ocean.
—Caroline Ummenhofer, WHOI climate modeler
Research based on ocean models and observational data suggests that this scientifically overlooked body of water may have absorbed an astonishing 70 percent of the earth's global heat gain from 2000 to 2015. And the Indian Ocean is holding on to that heat because-unlike the Atlantic and Pacific Oceans, which are not hemmed in by land-it is bounded on the north by the Indian subcontinent and the Mideast.
"The Indian Ocean is a hotspot of climate change," Ummenhofer said. "It is the canary in the coal mine." Heat waves are affecting its waters, fish populations are being displaced, kelp forests are collapsing, and corals are suffering massive bleaching.
Ummenhofer wants to know how that extra heat will affect the Indian subcontinent's monsoons. Adding heat to any body of water "energizes the system," she said, ramping up the likelihood of extreme weather.
"We've seen this with tropical cyclones and big rainfall events. When air holds more moisture, it can also rain out more water in a shorter amount of time."
In 2010, for example, Australia suffered extreme flooding-rescue workers compared it to Hurricane Katrina's devastation in the U.S. in 2005. It was Australia's wettest spring on record, with much of the country drenched with four times the normal amount of rain. Indeed, so much water had fallen, scientists detected a drop in global sea level from the evaporation that caused the torrents.
Ummenhofer sought to find out whether warming temperatures in the Indian Ocean and western Pacific played a role. She created two computer simulations: one that included a warming ocean, the other in which she artificially stripped out the warming trend-in a sense, fashioning an alternate reality. She ran the models not once but up to 100 times, to tease out the true climate signal amid all the statistical noise.
"No matter what, 2010 was going to be a wet year," she said. "But that it was so wet was significantly more likely because of the extra warming."
Ummenhofer has also researched ocean saltiness. Scientists have long considered sea surface salinity levels to be "Nature's rain gauge," because when seawater evaporates it leaves salt behind, while the evaporated water is eventually released over land as rain. Ummenhofer, along with WHOI physical oceanographer Ray Schmitt and Laifang Li (now at Duke University), found a clear link between higher salinity levels in the North Atlantic Ocean and increased rainfall on land in the African Sahel. The trio also showed that surface salinity in the subtropical North Atlantic was a strong warning signal for extreme rainfall in the U.S. in 2015, a year that saw record-breaking floods in the South and was the second-wettest year on record in the Midwest.
"People don't realize how much their weather-in particular, rainfall-is affected by the ocean," she said. "If you're a farmer in Iowa and you care about how much rain your crops are getting, then you should care about the ocean."
Warm ocean temperatures caused large-scale ecological disruption that affected different species, including lobster. (Photo © Alexandr Konstantinov | Dreamstime.com)

The Ocean's Moveable Feast
Today, warming waters are redrawing the lines of the marine food web.
Over the past few decades, biologist Carin Ashjian has explored this movable feast and how it has responded to changing ocean conditions. She wants to know how ecosystems are shifting, how species are moving, and how these factors fray or strengthen food webs.
Because of warming seas, southern species have found northern waters newly hospitable. Killer whales now show up in Alaskan waters north of the Bering Strait. Salmon species are wending their way to lagoons north of the Arctic Circle, where indigenous fishermen catch fish with nets cast out from the beach. Ashjian fears that commercial fishing-currently prohibited in Arctic waters because the ecosystem is still not fully understood-might ruin the Arctic habitats if not effectively regulated.
To gain a better understanding of the impacts of such climatic changes, Ashjian serves on the scientific steering committee for a developing international effort called the Synoptic Arctic Survey, or SAS, in which scientists on research cruises in the Arctic will collect data on ocean circulation, carbon cycling and ocean acidification, and ecosystem functioning and productivity. This comprehensive dataset will serve as a baseline by which researchers can track changing ocean conditions and their impacts over the coming years, decades, and centuries.
* * *
Physical oceanographer Glen Gawarkiewicz is tracking those changes, and their practical implications, right now. In May 2012, he was on a cruise around Cape Hatteras, North Carolina with fisheries biologists and acousticians, searching for cold-water fish.
"But we had a nine-degree-Fahrenheit anomaly. It was so warm, there were no cold-water species. I thought, 'Oh, my word.' It was a change I never could have imagined."
"There are huge year-to-year differences in abundance, and we're not sure what drives them."
—WHOI physical oceanographer Glen Gawarkiewicz
Since then, Gawarkiewicz has expanded his field of vision, from what he calls the "small patch" of the North Atlantic that was and still is his specialty to the warming Arctic atmosphere, the Jet Stream, and the Gulf Stream.
"They're all interconnected," Gawarkiewicz said.
The temperature anomaly that astonished him was due to a stationary wave in the U.S. Jet Stream (a meandering current of air in the atmosphere) that for six weeks held back the cold air in southern Canada that would normally have moved down into southern New England.
"The air temperature was very warm-we were wearing t-shirts in mid-January on Cape Cod," Gawarkiewicz said. "That skewed ocean temperatures for months afterward. And it caused incredible, large-scale ecological disruption that affected different species, such as puffin chicks and lobster."
Gawarkiewicz has since documented similar disturbances in his small patch of ocean.
"Cold-water fish are struggling. Cod, in particular, has been retreating to the north. On the other hand, sea bass and Jonah crab are coming in because of warm waters," he said. "There are huge year-to-year differences in abundance, and we're not sure what drives them."
To help answer this question, Gawarkiewicz teamed up with the Commercial Fisheries Research Fleet to recruit fishermen as citizen scientists.
"The climate shifts that we talk about theoretically, they're experiencing every day," Gawarkiewicz said.
The fishermen take bi-weekly measurements of salinity, temperature, and depth, and note unusual ocean conditions. The scientists and fishermen later discuss and interpret the data. Scientists benefit because the fleet is a cost-effective way of collecting data, since research expeditions are typically expensive to conduct, while fishermen gain insights into the ecosystems on which their livelihoods depend. It's an effective win-win scenario.

Summertime ice melt along the Greenland Ice Sheet has sped up in recent decades, with more fresh water flowing into the surrounding ocean. (Photo by Matt Osman, ©Woods Hole Oceanographic Institution)
A Melting Arctic
On August 1, 2019, during the tail end of an intense heat wave over Europe, the Greenland ice sheet experienced its biggest one-day melt in recorded history, spewing 12.5 billion tons of water into the sea-enough to fill 5 million Olympic-sized swimming pools.
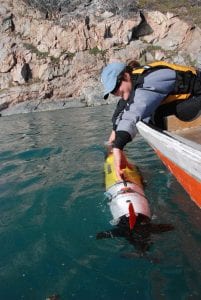
Researcher uses a REMUS to collect data. (Photo by Robin Littlefield, ©Woods Hole Oceanographic Institution)
The news headlines didn't surprise glaciologist Sarah Das. She focuses on the cryosphere-the frozen water part of the earth's surface. Today, the Arctic is one of the regions most sensitive to climate change, with air temperatures rising faster than anywhere else on the planet.
In December 2018, Das and her colleagues published a study showing that surface melting and runoff across Greenland's mile-thick ice sheet started increasing in the mid-19th century-the dawn of the Industrial era, when humans began burning coal, oil, and natural gas that emitted tons of carbon dioxide into the atmosphere. The melting sped up dramatically in the 20th and 21st centuries, and shows no signs of abating.
"We were able to show for the first time, and unequivocally, that the current melt and runoff in Greenland is unprecedented and is also increasing at an accelerating rate," she said.
As a geologist, Das tries to frame her work in Earth-history time scales-far longer than the brief (years-to-decades) modern observational record-to put today's rapid changes into a larger perspective and to inform how the future might unfold.
While calving icebergs represent one highly visible aspect of rising sea levels, more than half of the Arctic water pouring into the ocean comes from runoff from melted snow and glacial ice. Between 2005 and 2014, loss of ice mass from the Greenland ice sheet alone accounted for a fifth of global mean sea level rise. Now the second-largest contributor to rising seas worldwide, Greenland is on track to become the top source of added water.
Das's study drew on data gleaned from ice cores extracted from more than 100 meters (about 330 feet) down into the ice, frozen records by which she reconstructed past melt intensity year by year. She found that, rather than increasing in a steady linear trend as climate warms, the melt rate trajectory of Greenland's ice sheet is "nonlinear," curving up faster and faster for every degree of warming. According to Das, compared to even the late 19th century, it now takes very little additional warming to trigger huge spikes in ice sheet melting and runoff.
"The current melt and runoff in Greenland is unprecedented and is also increasing at an accelerating rate."
—WHOI glaciologist Sarah Das
Warmer air temperatures, which are amplified in the Arctic, bring more summer heat, more melt, and more ice loss to the ocean. At the same time, warmer waters lapping Greenland's shores creep up on the ice sheet from the edges and the underside, causing the ice to melt faster and to calve off into icebergs.
Current projections of sea level rise range from 0.3 to 1.5 meters (one to five feet) between the years 2000 and 2100, and from 1.0 to 12 meters (three to 38 feet) between the years 2000 and 2300, with a large part of that projected to come from increased land ice loss. While IPCC projections take into account many aspects of the atmospheric part of the ice-loss process, they don't account for all of the newly understood, ocean-driven dynamic changes in glacial behavior-especially the melting of ice from underneath by warm waters-that may prove to be far more consequential, especially in the continent-size ice sheet at the bottom of the globe.
"Antarctica is still the biggest wild card when it comes to ice loss," said Das. Projections indicate that if all of Greenland's ice melted, the global sea level would rise by nearly seven meters (24 feet)-which is frightening enough, but if all of Antarctica liquefied, global seas would rise by more than 61 meters (200 feet).

Watchful Eyes on the Ocean
Oceanographers frequently use the scientific terms "synoptic" (a wide range of observations made in a single period of time) and "panoptic" (panoramic and continuous surveillance over a longer period of time).
WHOI President and Director Mark Abbott, a biological oceanographer, translates these elegant Greek-derived words into plain English: "everywhere and all the time." That's the kind of research it will take to figure out the ocean's role in our changing climate.
"The quality of weather forecasts and the fact that meteorologists can do pretty good forecasts 10 days out is a transformation, both in atmospheric observations and weather models," Abbott said. "But we haven't achieved the same sophisticated forecasting with the ocean. Our observing systems have nowhere near the time and space scales needed to understand both long-term trends nor how ecosystems change rapidly."
One of the boldest "everywhere and all the time" efforts right now is the Argo Program, a global array of some 3,800 free-drifting floats that measure temperature, salinity, and velocity of the upper 2,000 meters (6,500 feet) of the ocean, with all data relayed and publicly available within hours after collection. This vast trove of information will be key to tracking changing ocean conditions globally. Within the next decade, Deep Argo floats will be dispatched 4,000-6,000 meters (13,123-19,685 feet) down, to measure warming closer to the sea floor. As part of the Argo Program, WHOI deploys about 100 floats, mainly in the Atlantic Ocean.
An international effort that began in 1999, Argo has transformed ocean science.
"There are too many discoveries to count. About a paper a day comes out," said physical oceanographer Susan Wijffels, co-chair of Argo's international steering team, the program's primary scientific oversight group. "Besides tracking big shifts in ocean heat from region to region-shifts that were associated with major climate cycles like the El Niño weather pattern-there have been big surprises relative to how surface waters mix with deeper waters in the winter, and how the ocean's circulation moves heat around."
And, said Wijffels, "For the first time ever, we can now track the planetary heat imbalance in real time, because 95 percent of the excess heat from the enhanced greenhouse gas effect goes into the ocean. By tracking ocean heat content month-to-month, we can see warning signals clear as day."
Ocean observations made by the Argo array also help ground climate model simulations in real-life data.
"Today, there's a whole set of climate projections out there-some are very optimistic, some are not," Wijffels said. "Argo is a tool that tells us whether our climate models are correct. It tells us exactly what trajectory we're on and when and if we have slowed down warming-which so far, we haven't."
"Science can inform the best path forward."
—WHOI geochemist, Ken Buesseler
(Photo by Christopher Linder, ©Woods Hole Oceanographic Institution)
Looking to the Future
Many WHOI researchers would like to see similar long-term and cross-disciplinary collaborations-using satellites, ship-based arrays, new generations of sensors, and other technologies-to record, map, and analyze shifts in the global ocean that portend further changes to Earth's climate.
WHOI's range of expertise in every realm of ocean science, coupled with its unique culture of inquiry, discovery, and innovation, make it a leader in this effort.
"We bring the best science and engineering,"
said Abbott. "And we bring a no-boundaries attitude."
Gebbie agrees. "At WHOI, we're an artists' collaborative-but with scientists. We have the freedom to go where the problems lead us."
Or as Hughen puts it, "WHOI's the kind of place where you can think of a question on a Monday and have an answer by Tuesday-just by walking into somebody's lab and asking: 'Is it possible to do this?' and having that colleague reply, 'Let's find out.'"
This scientific scope and collegiality breeds optimism.
"The ocean is changing. And it is knowable," Ummenhofer said. "It will require a great deal of effort, technology, research, and investment to know it. But if we do know it, the outcomes could be huge-better climate predictions, better weather forecasts, a blue economy."
"Science can inform the best path forward," said Ken Buesseler. "We need to do something big and aggressive. It's not outside of our capabilities."
As Abbott sums it up, "We live on an ocean planet. Going forward, we will need to learn how to live on it, by understanding how the ocean works, how it is changing, and how those changes could profoundly alter our lives. That is why we do what we do."
Madeline Drexler is a Boston-based science journalist and editor of Harvard Public Health.
This article was originally published in Oceanus magazine, Fall 2019, Vol. 54, No. 2. If you would like to receive Oceanus magazine twice a year, Become a Member.