Earth’s Riverine Bloodstream
Flowing down rivers are clues to how our whole planet works
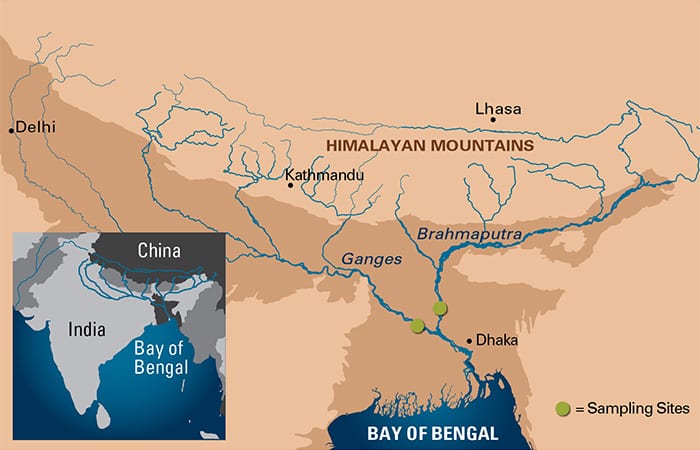
Each day from July to October, monsoon rains bring the equivalent of 35,000 dump truck loads of dirt racing down the Ganges and Brahmaputra Rivers—50 metric tons per second—and deliver it to the Bay of Bengal off the coast of Bangladesh. Swirling in that debris are tiny pieces of the Tibetan Plateau, bits of leaves that fell in India, and remnants of ancient rocks thrust up by tectonic forces to form the highest reaches of the Himalayas.
Rivers slowly gather all that material, whether born of volcano or by tree, and return it to the sea. Throughout Earth’s history, as its continents and climate have shifted, so has the nature of the material passing through the rivers.
In a sense, rivers are like airport terminals connecting air, mountains, rocks, plants, soil, and the ocean. And like travelers in airports, the materials transported by rivers can tell stories of where they’ve been, what’s happened to them, and where they’re going.
Our lab group endeavors to reveal these stories. We study the sources of materials exported by rivers and analyze how they change over time. We piece together these data to understand two intersecting planetary cycles—one controlled by geology and the other by biology—that span time and space and shape the Earth and life on it.
By parsing these biospheric and geologic cycles, we can begin to reconstruct how the turning of these wheels can shift Earth’s climate—and vice versa.
And all of this is hidden in the 50 metric tons of material flowing every second down the Ganges and Brahmaputra Rivers.
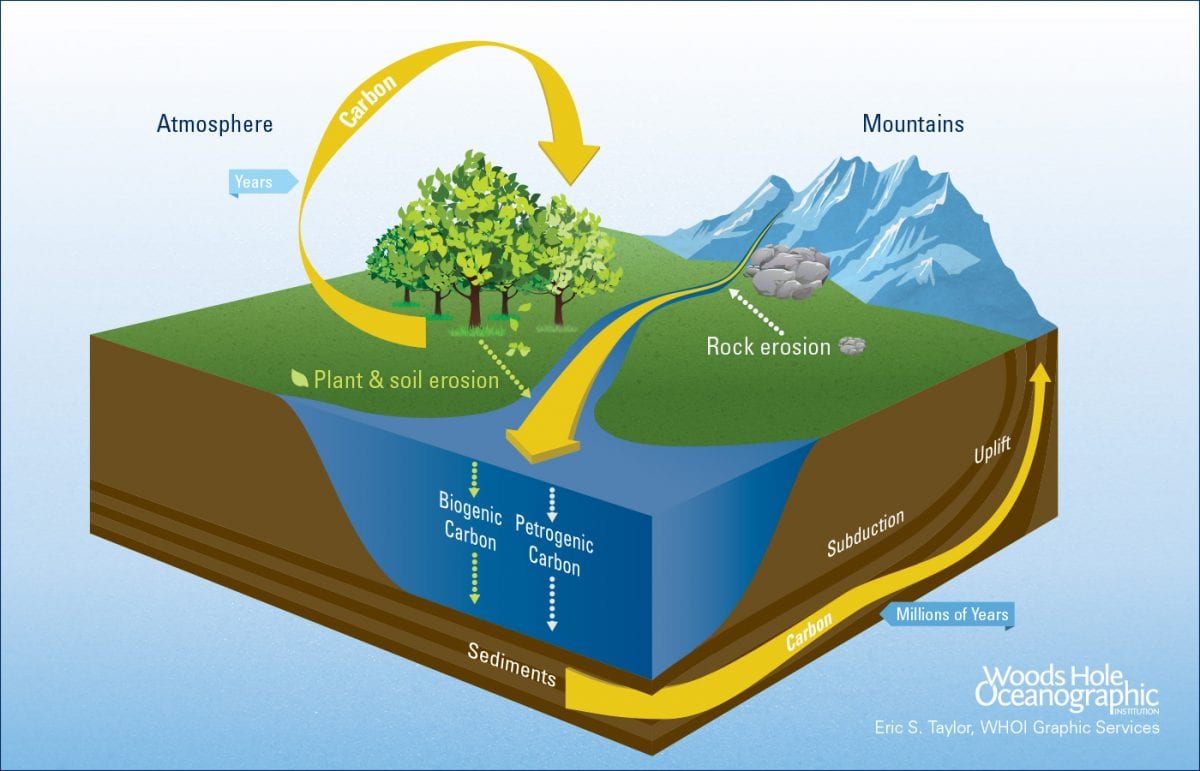
The two carbon cycles
The target of our investigations is a single element that is both a building block for all life and a key player in regulating Earth’s climate: carbon. Our goal is to follow the carbon as two major cycles shuttle it throughout the planet over many timescales.
The first is the biospheric carbon cycle. Photosynthetic plants and phytoplankton convert carbon dioxide from the air into organic carbon compounds that fuel their growth. Animals and other heterotrophs that cannot synthesize their own food obtain these useful compounds by consuming such primary producers. When plants and animals die, they are decomposed by microbes and in the process, carbon dioxide is released back into the atmosphere.
This biospheric loop is nearly perfectly efficient. Only a small fraction of the carbon escapes the loop to be swept into the sea by rivers. Over time, that carbon gets, buried in marine sediments, and eventually infiltrated into the second cycle—a much larger and slower one we’ll call the geologic carbon cycle.
In contrast to plants and soil, rocks contain carbon that has been locked away from the atmosphere for much more of Earth’s history. In collisions of tectonic plates, some biospheric carbon buried in marine sediments may be pushed down into the lower crust and upper mantle. This carbon re-emerges millions to hundreds of millions of years later in volcanic eruptions or when tectonic forces thrust segments of the seafloor up onto dry land, where it can again intersect with the biospheric cycle.
There is enough carbon locked up in the geologic carbon cycle to fill the biospheric one a thousand times over, but it leaks out very slowly. Over a long-enough time, if this slow leak of carbon out of rocks is faster than it is reburied into new rocks, the biospheric carbon cycle swells and atmospheric carbon dioxide increases.
Here’s where the climate factor comes in. Carbon dioxide is a heat-trapping gas, so an increase in carbon dioxide in the atmosphere would lead to a warmer climate. The opposite is also true: An increase in carbon burial would leave less biospheric carbon, lower carbon dioxide levels in the atmosphere, and cool Earth’s climate.
Planetary clockworks
At the nexus of the two cycles, rivers respond to both geologic and climatic changes. The rivers export more or less carbon, typically acting to counter these changes and stabilize the environment.
The emergence of the Himalayas, for example, when the Indian and Eurasian tectonic plates collided, re-exposed more rocks with carbon ready to leak back into the biosphere. But counteracting that are the steep, mountainous terrains, which lead to faster-flowing rivers that export more sediment to the sea than rivers in flatter terrain.
When atmospheric carbon dioxide levels rose in the past, the natural riverine systems revved up like a conveyor belt to compensate. More greenhouse gas spawned warmer climates with more storms and rain that increased the flow of rivers. That transported more carbon to be buried in the seafloor and eventually lowered atmospheric carbon dioxide levels.
Of course, humans have recently found ways to disrupt some of these natural cycles and feedback mechanisms—with unknown consequences. We’ve sprung a big leak in the geologic cycle by extracting and burning fossil fuels. We have accelerated the speed at which carbon in rocks is converted into carbon dioxide in the atmosphere.
Humans have also disrupted rivers’ natural stabilizing mechanisms with agriculture and dams. Dams block riverine sediments from reaching the ocean. At the same time, people’s need for more agriculture strips land of its vegetation cover and increases soil erosion into rivers, sending more biospheric carbon into the ocean. We’ve increased the speed of the conveyor belt, but blocked its path with a giant cement wall.
It seems almost impossible now to find a single river free of dams or agriculture. Even the mighty Ganges, with its 35,000 daily dump trucks of dirt, is blocked by dams and diversions, and more are being built at an alarming rate.
By studying the sources of organic carbon exported by rivers and how they change with time, we can begin to understand how the biospheric and geologic carbon cycles are connected. We can unravel how geologic forces, human activities, and climate changes affect the cycles and how the cycles, in turn, influence climate change.
Monumental questions and rivers
We tackle such monumental questions, bit by bit. Armed with nothing but a small boat, some bottles, a pump, and a filter, we attempt to take on some of the world’s most gigantic rivers: the Congo, the Amazon, the Ganges, and Brahmaputra.
To get a more complete understanding of what the river is exporting, we’re forced to sample everything from things dissolved in the water to the sand along its bed. No simple “let’s-scoop-some-water-with-a-bucket” mentality will do. Fortunately, we’ve developed some tools to make this easier.
We have to capture sediments suspended in the river water at different depths because they change quite dramatically. (Even the Mississippi at its muddiest will have a bed of sand.) To do so, we lower an open horizontal tube with a spring-loaded cap on each end. When we’ve reached the proper depths, we trigger the caps, and the tube snaps shut, a mousetrap for water.
We then push our captured water through a filter, removing anything larger than 0.2 micrometers, about 500 times thinner than a human hair. We store both the material trapped on the filter and the water that passes through, and call these “particulate” and “dissolved.”
Carbon, the coin of the realm
So how can we determine where filtered material came from? For carbon, we can exploit two properties from biology. First, every species or group of species produces a specific array of molecules within its cells, called biomarkers. (Have high cholesterol? Excellent biomarker! Love to eat omega-3 fatty acids? Another great biomarker!)
All plants produce certain waxy biomarkers to protect their leaves from drying, and certain woody biomarkers to keep their branches stiff. We can measure the amount of these biomarkers within our filtered sample to learn how much of the total carbon comes from plants, and the biospheric carbon cycle in general.
Second, carbon comes in three isotopic flavors: 12C, 13C, and 14C. These isotopes are different only in their mass and the fact that 14C is too heavy to be stable, so it decays. Plants, like many of us, like to eat fast. This means, if given the choice, they’ll preferentially use the lightest isotope, 12C.
But not all plants in all conditions have the same preference, and may use more 13C. We can use the ratio of 13C to 12C in our plant biomarkers to learn which plants in which regions are contributing to the exported carbon.
Finally, since 14C wants to decay, we can use this as a clock to determine the age of this plant-derived carbon.
So, with biomarkers and isotopes we can answer three questions: How much carbon comes from plants versus rocks? Geographically, where is the plant carbon coming from? And, how old is it?
There you have it. To unravel how the Earth system evolves, we follow its basic building block, carbon. We intercept the carbon at critical junctures in the natural system—rivers—and track it back to its sources. Piece by piece we put the planetary jigsaw puzzle together to get a bigger picture of how the Earth system operates to sustain life and how it has changed in the past, and how it will continue to change in the future.
This research was funded by the National Science Foundation Graduate Research Fellowship Program and the WHOI Ocean Ventures Fund.
From the Series
Slideshow

Slideshow
- Each day, the equivalent of 35,000 dump truck loads of dirt is swept down the Ganges and Brahmaputra Rivers—50 metric tons per second—and delivered to the Bay of Bengal off the coast of Bangladesh. Scientists are tracking carbon in river samples back to its sources to get a bigger picture of how the Earth system operates to sustain life and regulate the planet's climate. (Illustration by Eric S. Taylor/Woods Hole Oceanographic Institution Graphics Services)
- Jordon Hemingway, a graduate student in the MIT-WHOI Joint Program in Oceanography, collects a sample of river water from the Amazon River in Brazil. (é 2012 Chris Linder)

