A Current Affair
A New Seafloor Technique Measures Electrical Conductivity Deep Within the Earth
1998— The MELT Experiment was the largest seafloor geophysical experiment ever attempted, and one of its major components was MT, the magnetotelluric technique. MT offers a valuable tool toward the MELT Experiment’s goal of probing the earth’s inaccessible deep interior. But the technique remains something of a mystery even to many marine scientists. It has been used widely on land, particularly for regional-scale surveys, but only a few full-scale MT surveys have been carried out on the seafloor.
The primary data collected by marine MT experiments are measurements of changes in the earth’s electrical and magnetic fields at the seafloor. These fields are affected by electromagnetic currents within the earth, and here’s where MT’s apparent complexity starts—because the source of these currents is not within the earth, but rather in the ionosphere.
Charged particles, emitted from the sun as a solar wind, become trapped in the ionosphere by the earth’s magnetic field. These moving charges essentially create a variety of electric currents encircling the earth. If the earth were a perfect insulator, like space, that would be the end of the story. But the earth can conduct electricity. As these ionospheric currents flow around the earth, they generate a response within the planet itself. More specifically, the pattern of ionospheric currents induces almost a mirror-image pattern of currents within the earth.
These so-called “induced image currents” cause changes in the earth’s electric and magnetic fields. These changes depend on the conductivity of the earth’s interior, which, in turn, is determined by the composition and structure of the materials that constitute our planet’s interior. Thus, by measuring changes in Earth’s electric and magnetic fields at the surface, we can effectively deduce its electrical conductivity and reveal its interior structure. As CAT scans reveal images and frameworks that enable us to learn about the workings of the human body, MT experiments similarly provide essential cutaway views that allow us to learn about processes taking place within our planet.
Like standard alternating currents in most households, which have a frequency of 60 Hertz, or one cycle per 1/60 of a second, induced image currents also alternate—though they do so over a wide range of frequencies. The variations, or frequencies, we use in seafloor MT range from periods of about 100 seconds to several hours. These variations are caused by the chaotic nature of the events that entrap ions from the solar wind, as well as by more regular events, such as the earth’s daily orbit around the sun. The important point is that different frequencies penetrate the earth to different depths. If induced image currents came in only one flavor, we would be able to image the earth’s interior at only one depth. As it is, higher-frequency currents (with one cycle per 100 seconds, for example) don’t penetrate deeply and can tell us about structure 10 to 15 kilometers deep; the lowest-frequency currents (with one cycle per several hours) can tell us about depths of several hundred kilometers.
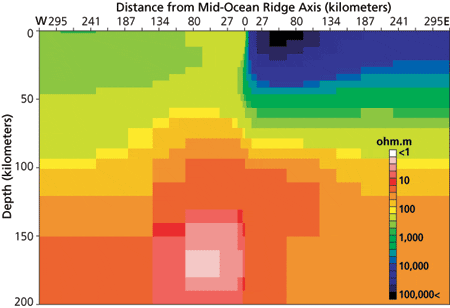
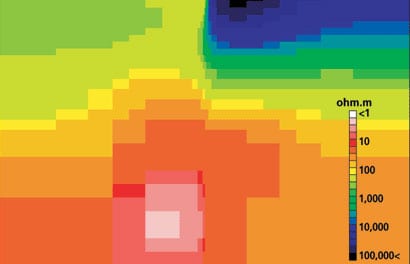
The goal of the MELT Experiment was to map basaltic melt, from its source within the mantle to the base of the oceanic crust at the mid-ocean ridge crest. While the earth can conduct electrical currents, most rocks, including those comprising the mantle, do not conduct particularly well. This situation changes considerably when melt is present: Pure basaltic melt is several orders of magnitude more conductive than olivine, a common mantle mineral. In the mantle melting column, we do not expect to see pure melt, nor anything like it, but rather some distribution of streams and pools of liquid melt within a matrix of solid mantle rocks. In this case, how the melt is distributed is important. It is possible to think of the melt as a network of wires that connect parts of the mantle. If the melt forms a well-connected network through the rock, electric currents can flow and the mantle will be electrically conductive. Of course, reality is more complicated and other factors, such as water dissolved in the mantle rock, can affect conductivity. These other factors are also important for understanding the whole process of melt production.
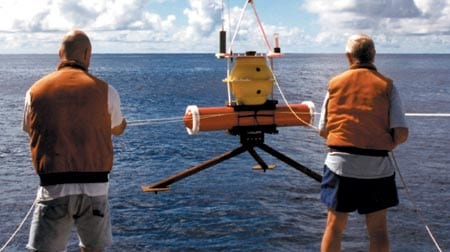
The MT component of the MELT Experiment was a truly multinational effort involving more than a dozen scientists from Woods Hole Oceanographic Institution and Scripps Institution of Oceanography in the US, and from France, Japan, and Australia. Each group contributed instruments to the array and played a role in the data analysis. From June 1996 to June 1997, 47 instruments were deployed at 32 seafloor sites to measure the time variations of the electric and magnetic fields. Two lines were set out. The main southern line had 19 sites and crossed a magma-rich segment of the East Pacific Rise ridge crest, extending 200 kilometers on either side of the crest. The second line of 13 sites crossed the ridge to the north on a magma-starved ridge segment, extending 100 kilometers on either side of the axis.
Each group’s instruments essentially did the same thing: measure changes in the electric and magnetic fields at the seafloor. But each group accomplished this in slightly different ways, deploying very different-looking instruments. As in all marine experiments, the environment makes seafloor MT measurements more difficult to make, but in one way nature helps us. The ocean is electrically very conductive and acts as a screen against electromagnetic noise—extraneous signals from other sources that would confuse interpretation of the data. On land, power lines, for example, can be a nuisance. The seafloor, however, is electrically quiet, making it possible to measure very small electric field variations. The other part of the MT signal is the seafloor magnetic field—not the steady field trapped in lavas and used to identify magnetic reversals, but the magnetic field variations linked to ionospheric currents.
To a first order, the ratio of the electric to the magnetic field at the earth’s surface is a direct measure of the earth’s electrical conductivity. We calculate this ratio for a range of current frequencies using modern processing techniques. To produce a model of the earth, data from all instruments have to be examined through a process of numerical inversion. The interaction of induced currents in the earth with the conductive bodies we hope to image (such as the melt column) affects the electric and magnetic fields over a wide region of seafloor. Generally, it is not possible to look at data from a single instrument and interpret the underlying structure. Instead, we have to use computer modeling to predict the fields that the mantle would create and compare these answers to data from all the instruments. The model is updated to improve the agreement and the process is repeated until a satisfactory model is found. There are many pitfalls involved in this process, as well as different ways of carrying it out. The groups involved in the MELT Experiment have been using a variety of methods over the past few months, and we are in the process of comparing results and discussing their implications.
The MT analyses are still in their early stages, but some first-order results are beginning to come through. The MT data show an asymmetrical distribution of melt between the areas west and east of the ridge crest, with a more extensive region to the west. The melt column also appears to be a broader feature, with a low percentage of melt in it, rather than a narrow vertical column of melt directly beneath the ridge. This indicates a more passive flow of mantle toward the ridge crest. Deeper, we see some evidence for a conductive mantle at depths greater than 150 kilometers. If this proves to be true, it could be evidence for deeper melting—deeper than the part of the mantle generally believed to be responsible for most melt generation. However, in the final analysis, water dissolved in the mantle rock may prove an important factor in mantle conductivity at this depth.
Funding for the MELT Experiment was provided by the National Science Foundation through the RIDGE Program. The many people involved in the MT component of MELT include: Alan Chave, Bob Petitt and John Bailey (WHOI), Jean Filloux and Helmut Moeller (SIO), Pascal Tarits (UniversitÉ de Bretagne Occidentale), Martyn Unsworth and John Booker (University of Washington), Graham Heinson and Anthony White (Flinders University, South Australia), and Hiroaki Toh, Nobukazu Seama and Hissashi Utada (University of Tokyo).
Slideshow