
Shan, X., Spall, M., Sun, S., & Wu, L. (2025). Beaufort Gyre Liquid Freshwater Content Change Under Greenhouse Warming From an Eddy-Resolving Climate Simulation. Geophysical Research Letters, 52(8), e2024GL113847. https://doi.org/10.1029/2024GL113847
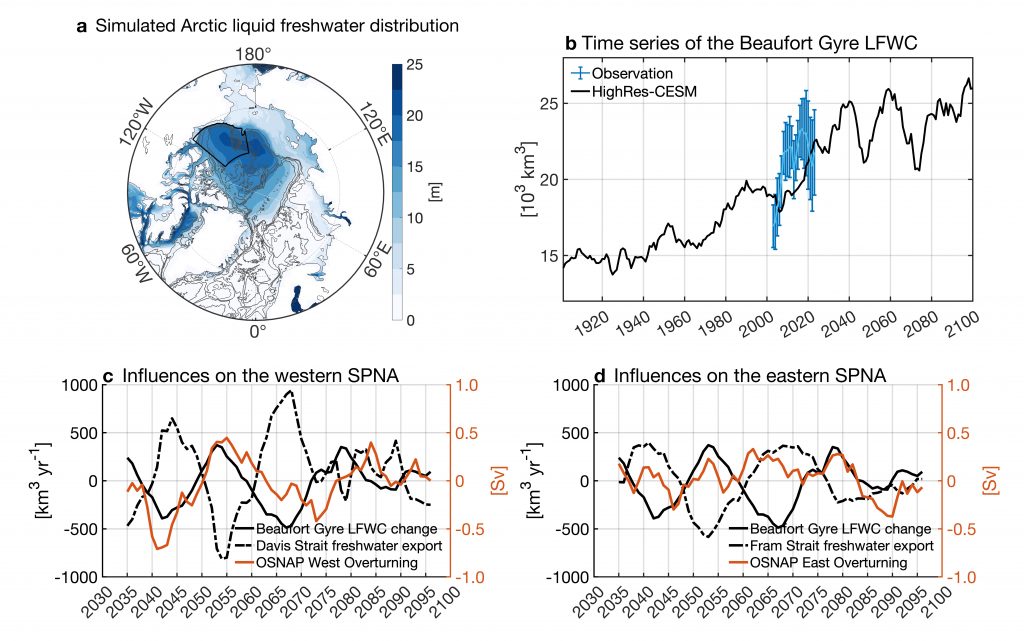
Figure provided by Xuan Shan
Response of the Beaufort Gyre liquid freshwater reservoir to greenhouse warming and implications for subpolar overturning circulation in an eddy-resolving climate simulation. (a) Simulated climatological (1970–2005) liquid freshwater distribution in the Arctic Ocean. The Beaufort Gyre region is bounded by longitudes 130W and 170W, latitude 80.5N, and the 300 m isobath (denoted by the black box). Isobaths of 300, 1,000, 2,000, 3,000 m are shown in gray. (b) Annual‐mean liquid freshwater content (LFWC) in the Beaufort Gyre region over 1901–2100 in the simulation (the black line). The blue lines show the total LFWC and root mean square error in the same region based on hydrographic measurements over 2003–2023. (c) Time series of the Beaufort Gyre LFWC (the solid black line, negative for freshwater release from the Beaufort Gyre), the freshwater export into the subpolar North Atlantic (SPNA) through the Davis Strait (the dashed black line, positive for more freshwater into the SPNA), and the overturning across the west leg of the Overturning in the SPNA Program observing system (OSNAP West, the orange line, negative for weakened deep convection) on decadal time scales. (d) Same as (c) but for freshwater export through the Fram Strait and overturning across the OSNAP East.