
Wang, S., Waitzmann, D., Ummenhofer, C. C., & Oppo, D. W. (2026). Remote and Regional Drivers of the Indonesian Throughflow Under Future Warming: Implications for Inter-Basin Freshwater Transport. Geophysical Research Letters, 53(1), e2025GL119514. https://doi.org/10.1029/2025GL119514
The Indonesian Throughflow (ITF) is an important passageway through which warm, fresh waters from the Pacific are carried into the Indian Ocean. There are large uncertainties on how individual pathways of the ITF will change over the course of the 21st century because models used in climate change studies often do not have sufficient horizontal resolution to accurately represent these narrow passageways. Here we use state‐of‐the‐art climate model simulations to investigate how the ITF is projected to change. We find that transport through the three inflow pathways is expected to weaken in the 21st century due to influences from equatorial Pacific winds and the Atlantic overturning circulation. The wind changes contribute to the ITF decline in the surface layer, while Atlantic circulation changes explain the subsurface decrease in transport. Despite a weakened ITF, the amount of freshwater this current system carries into the Indian Ocean increases because of enhanced rainfall in the Western Pacific. Our results highlight the remote and regional changes that are expected to impact the exchange of volume and freshwater between the Pacific and Indian Oceans.
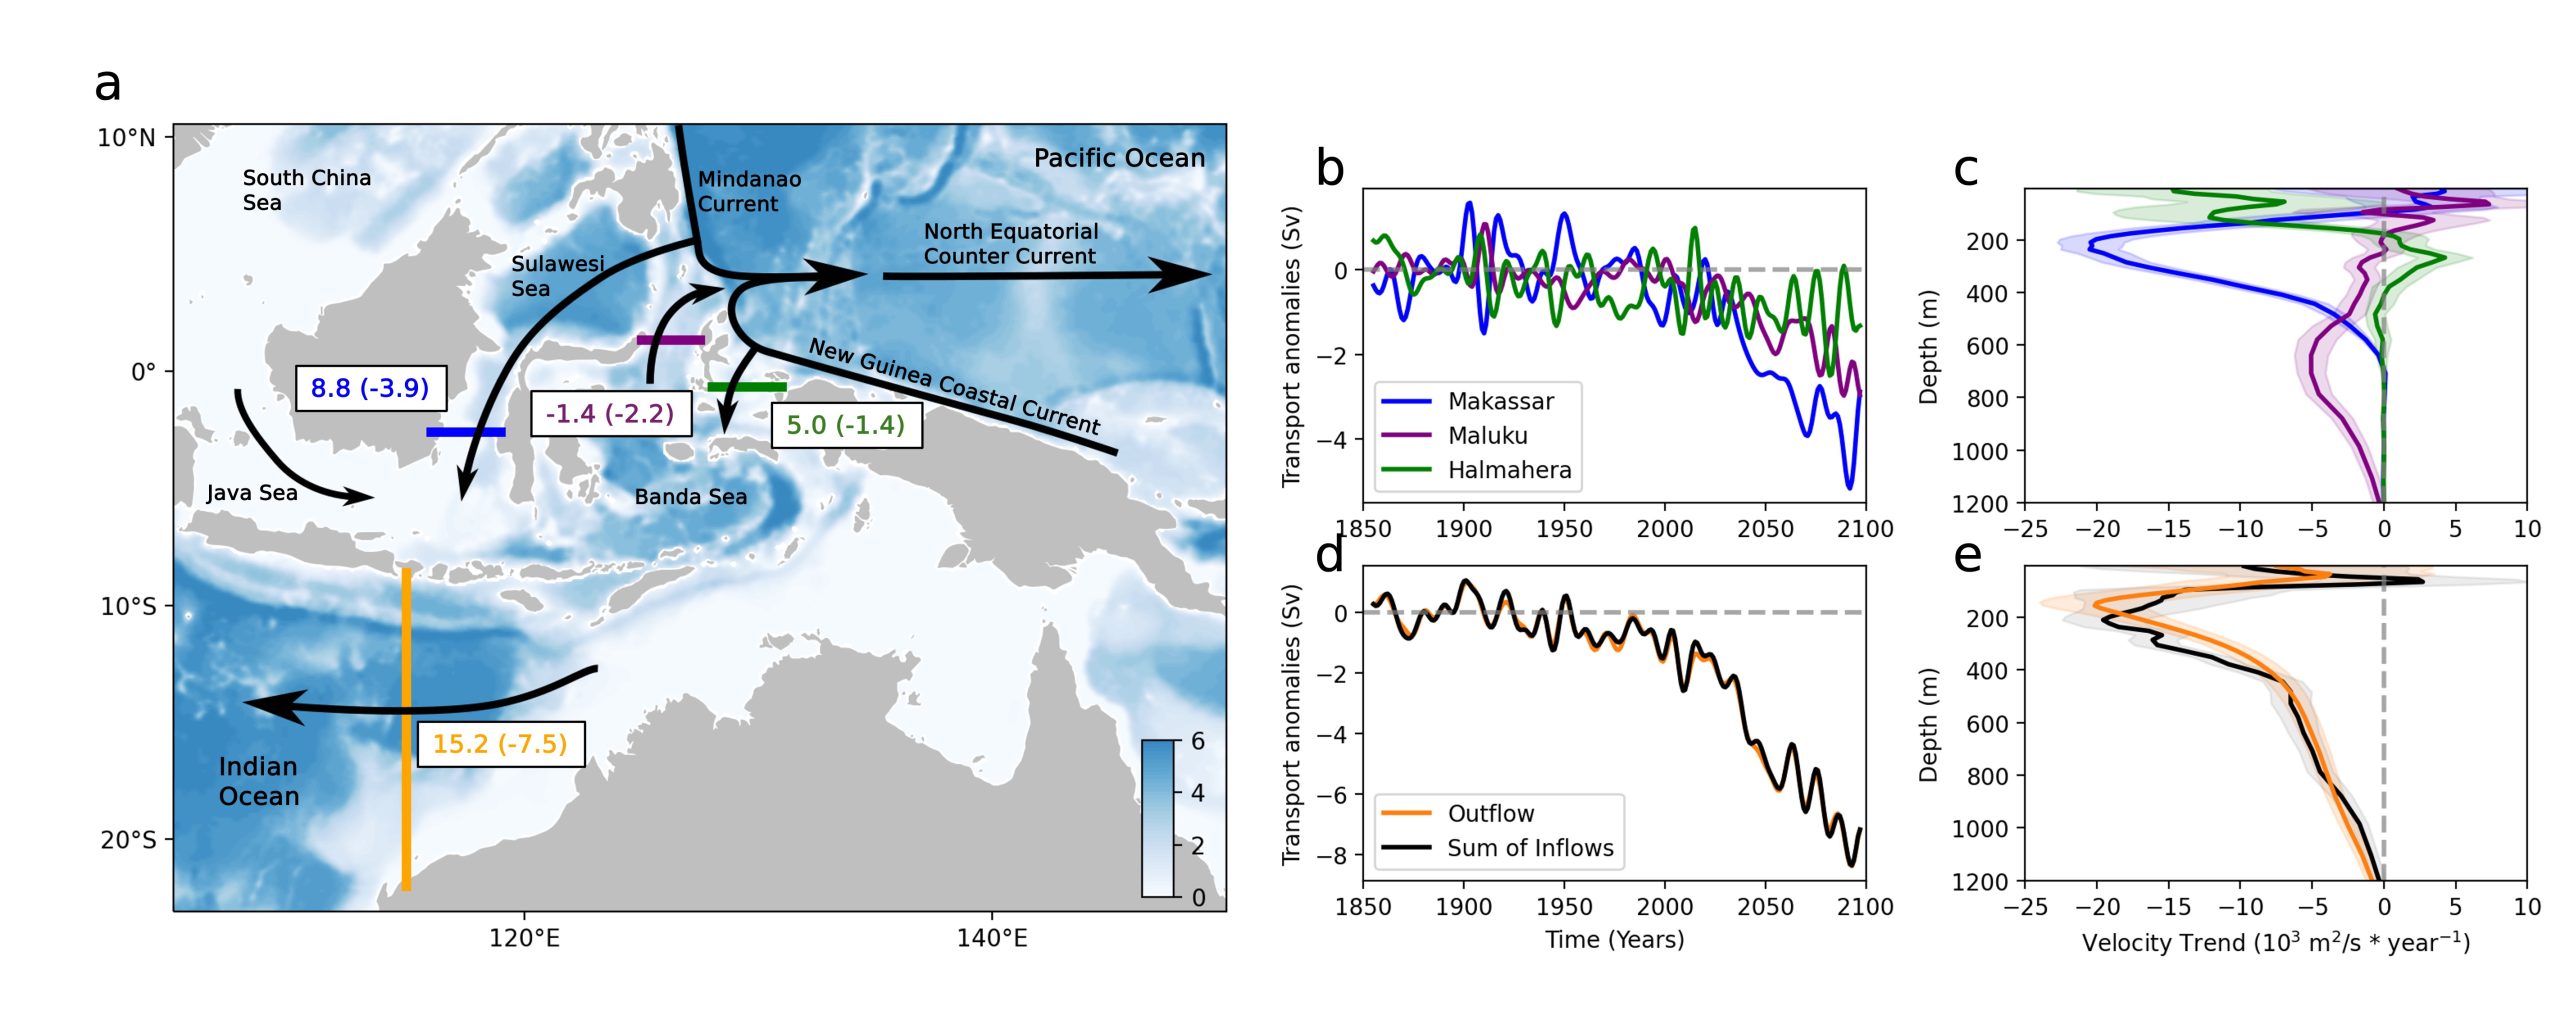
(a) Bathymetry of the Indonesian seas (in kilometers) with main ITF inflow and outflow pathways, Pacific upper ocean currents, and the Karimata Strait Throughflow shown as black arrows. The transects used to analyze Makassar Strait, Maluku Sea, Halmahera Sea, and ITF outflow transport are indicated by blue, purple, green, and orange lines, respectively. Transport magnitudes (in Sverdrups) averaged over the 1850–1950 period are also shown along with future (2080–2100) transport changes in parenthesis. Positive values denote southward/westward transport along the direction of the ITF. (b) Full‐depth transport anomalies (relative to 1850–1950) calculated for all three inflow passageways, (d) the sum of inflows and the ITF outflow. (c) Profiles of velocity trends spanning 2005–2100 for all three inflow pathways, (e) the sum of all three inflow profiles, and the ITF outflow. Velocity is multiplied by strait width at each depth. The 95% confidence intervals of velocity trends in (c), (e) are also shown (shading). Figure from Wang et al. (2026).