
August 29, 2011The ship felt empty this morning. There are some advantages to a small complement, such as single rooms and streamlined scientific procedures, but it felt lonely, bereft at breakfast, more like a transit than an oceanographic expedition. The fog is as thick today as I’ve seen it all cruise, though Second Mate Jen says she’s seen thicker, when the surface was invisible from the bridge. The Skip did a routine turn around the deck after breakfast to see that his ship was battened down and ready for heavy weather. Not surprisingly, she was. The forecast calls for something around 40 knots after midnight Friday morning continuing through Saturday. When sailors say weather, they mean wind. Wind, because it breeds waves, determines the quality of shipboard life. We’ll certainly notice 40 knots, but it won’t abjectly diminish our quality of life. However, since we’ll be in the thick of it when we reach East Greenland, a local atmospheric phenomenon—the barrier winds—may swing into action.
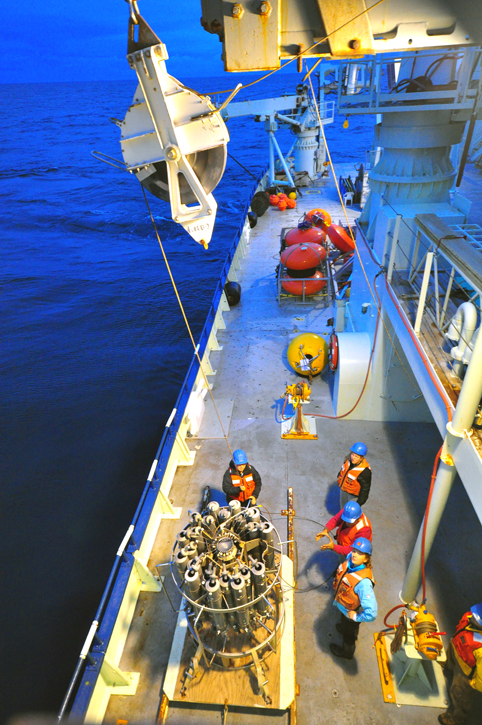
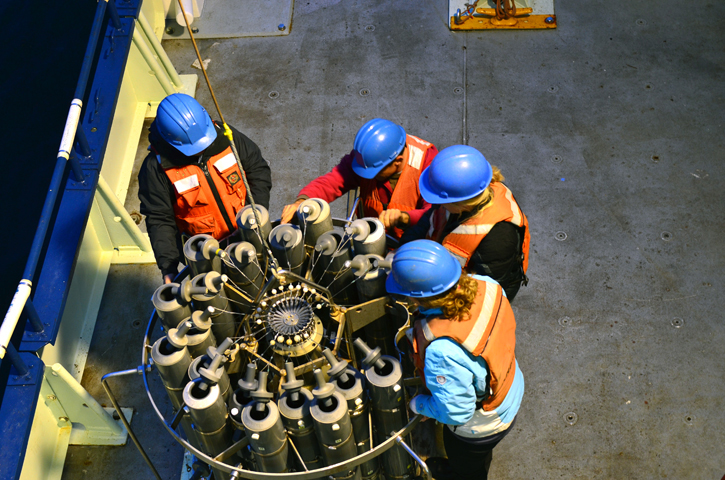
The CTD crew checks bottles after a cast. © Rachel Fletcher Picture a counterclockwise-circulating low-pressure system moving from the west (often out of continental Canada or up the U.S. coast) into the Iceland Sea north of the Denmark Strait. When the northeast quadrant of the system encounters the high, steep East Greenland coast (the barrier), the wind, which cannot climb the mountains, is thus channeled southward and at significantly increased velocity. It can be blowing fiercely by the time the winds reach the Denmark Strait. That, however, is unlikely in 40 knots. We’re more concerned that the north wind will usher the pack ice southward into our study area, blocking access to the coast. And so we wait for an ice report from the Danish Meteorological Institute. This, then, is an opportune time to introduce that other most fundamental oceanographic tool, the CTD.
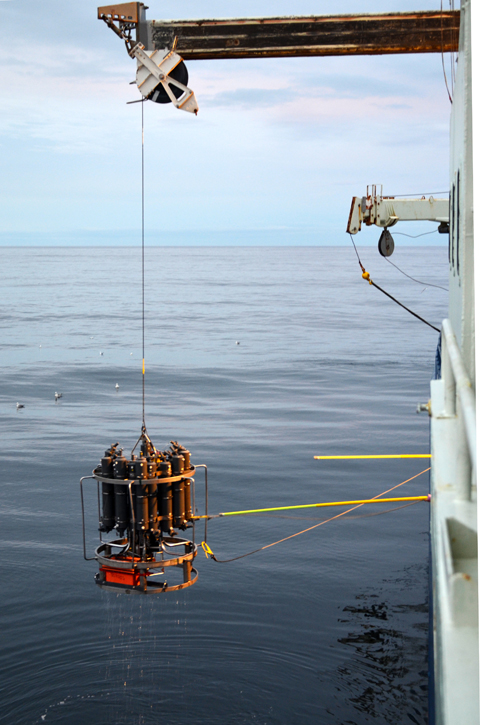
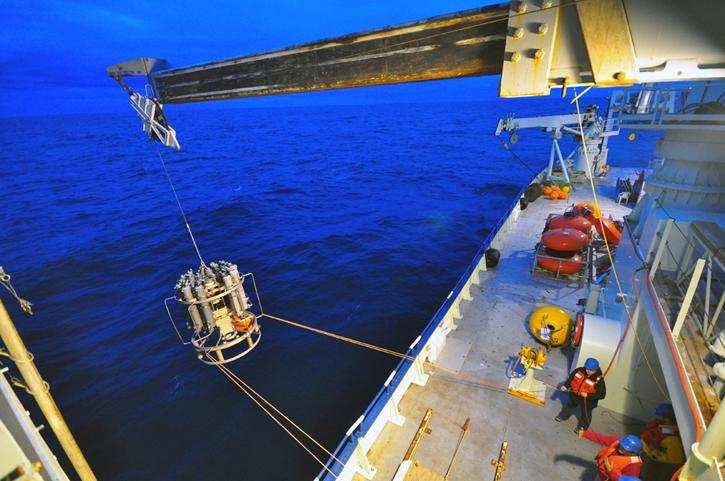
CTD is cast overboard. © Rachel Fletcher It stands for Conductivity-Temperature-Depth. By measuring conductivity and applying an algorithm or two, you can determine salinity. Temperature and depth are pretty self-explanatory. By knowing all three, you can identify the water’s fingerprint and thereby follow the current in question. The device itself, weighing in at about one ton, sometimes called the “package” or, as I’ve heard on other ships, the “rosette,” consists of a set of about twenty-four water sampling bottles, like thin scuba tanks, mounted on a circular metal frame. The bottles, which must be open at both ends on the descent lest they be crushed flat by the water pressure, can be triggered at predetermined depths from a computer in the main lab. Sensors on the CTD measure salinity, temperature, and depth, transmitting that data through the specialized oceanographic wire to that same computer. Also, the CTD package is a handy, readily used platform on which to mount other instruments such as a ADCP and current meter.
On this trip, we’re collecting water samples only in order to double-check the accuracy of the sensors on the CTD by means a device called a salinometer, operated by my lab mate, Dave Wellwood. For other applications, chemical and biological oceanographers often collect gobs of water samples to measure nutrients, oxygen, nitrogen, and other things depending on the cruise objective. On this cruise, the objective is to follow the North Icelandic Jet wherever it leads, and for that Kjetil and Bob need to know only temperature and salinity, or the T/S signature, as it’s often called and velocity as measured by the ADCP.
So that’s the machine itself, but its deployment is a big production, partly but not exclusively because it’s so heavy. The CTD package is launched from the maindeck amidships on the starboard side by a crane on the deck above. The sensors automatically log the T/S data as the CTD is lowered to within five meters of the bottom. The CTD watch standers keep an eye on the computer-reported depths to be sure that the package doesn’t hit the bottom. Then on the up-cast the CTD watch standers, communicating by radio with the crane operator, call for predetermined stops to “fire” the water-sample bottles, which with the press of a computer key, snap closed. At each stop on the upcast, the watch manually records temperature, salinity, and depth as a backup to the automatically recorded data. Then comes the recovery process. The crane operator hoists the package out of the water and raises it about three meters above the surface. Then, from the deck, the CTD watch standers hook lines onto the steel frame and help guide it down inboard onto a movable pallet. The cast process is not complete until the watch extracts the water sample into small, numbered bottles coinciding with the depth at which they were taken, washes the package with freshwater, and rearms the spring-loaded bottle cap mechanism. The pallet is set on rails so that the CTD can be pulled by a winch into the adjoining hanger for its protection and that of the operators. CTD operations are often conducted by oceanography students, sometimes their first experience of sea-going science. Work goes on around the clock. We have two three-person watches, all of whom happen to be young women, several with previous experience. They work twelve-hour watches, 1500-0300 and 0300-1500. It’s a tough schedule, interfering with normal mealtimes and sleep; everyone respects them for doing it. By all appearances, they often have a degree of fun at it and a fine spirit of comradeship.
Bob and Kjetil have chosen various lines across the Denmark Strait and others to the north along which they’ve planned numerous stops for CTD casts. We’re now north of the strait (68°29’ North by 022°19’ West) heading northwest 333° toward Greenland. Bob is well known—his operators might say notorious—for his closely packed, picket-fence CTD stops. But as he points out, this is the best, the only way to get high-resolution profiles of the current. I was just out chatting with the second watch, getting in their way as they prep the package for the next cast. It’s 1930 local time (that’s 7:30pm to those ashore). The wind is up around 20 knots (scientists designate wind speed in meters per second; if you double meters per second, you get back to velocity in knots) and it’s distinctly colder than it was two hours ago. I’ve seen CTD operations aboard Knorr continue until the wind reaches into the mid-thirties or when blue water is coming over the bulwarks jeopardizing the equipment and the people. Maybe it won’t come to that. In any case we’ll be right here to find out.
Last updated: December 27, 2011 | ||||||||||||||
Copyright ©2007 Woods Hole Oceanographic Institution, All Rights Reserved, Privacy Policy. | ||||||||||||||
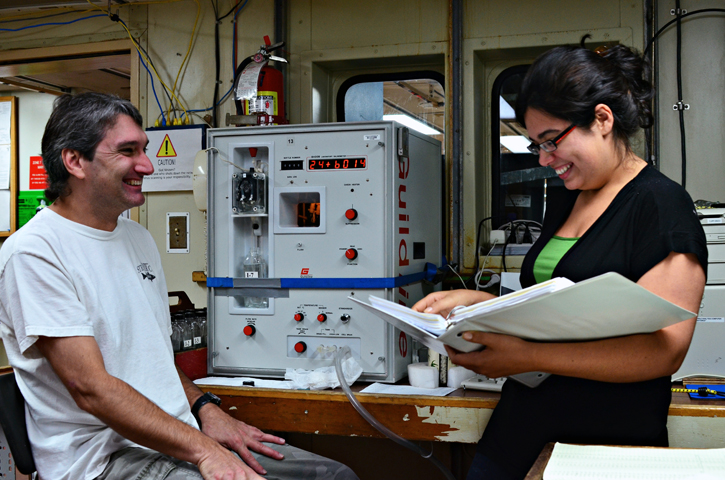
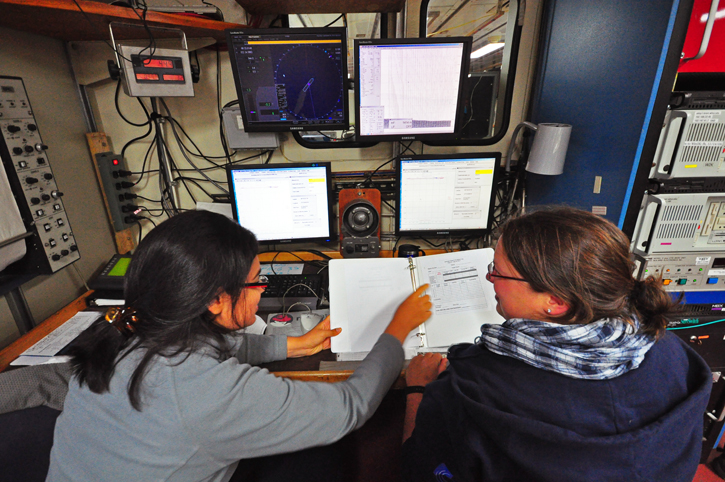 Mirjam Glessmer consults with Carolina Nobre. © Rachel Fletcher
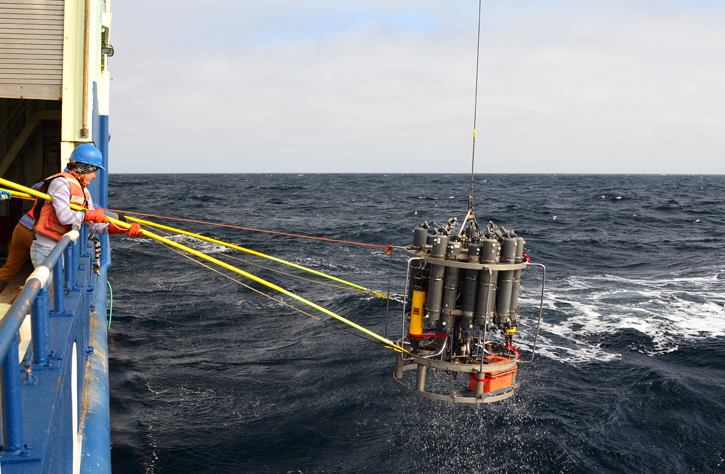 Gone Fishin', Lena Schulze retrieves a CTD. © Rachel Fletcher