Warping Sound in the Ocean
A far-out theoretical concept has practical applications
Star Trek fans would tell you that it is possible to travel faster than the speed of light using spatio-temporal warping. Honorable scientists would say that’s science fiction. However, some scientists like me have not discarded the ideas of spatio-temporal warping. It may not enable fast travel, but it turns out that warping is actually very useful for many things.
Star Trek debuted in 1966, but warping didn’t hit the scientific community until 1995, and it remained a just fancy theory for at least a decade. Here’s how it is supposed to work:
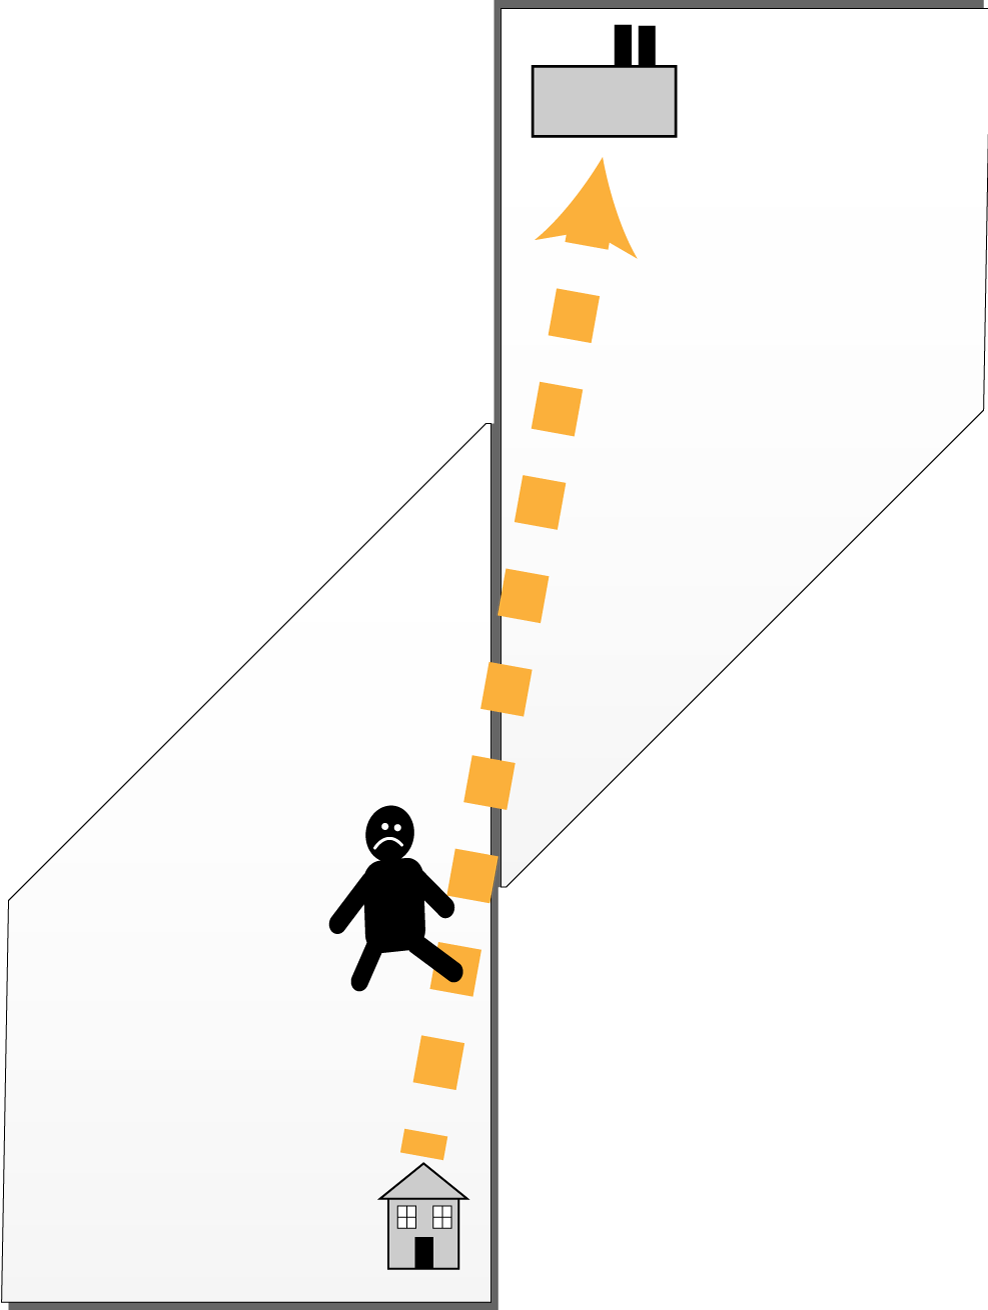
Warping space (or time) is an actual deformation of our universe. Imagine that your universe is a sheet of paper. You live in the top-left corner, and you work in the bottom right. Five days a week, you have to walk the whole length of the diagonal line between them to go to work, which is quite time-consuming.
What if you could bend the sheet and join the two corners?
No sooner said than done, you could hop from home to work.
This is an appealing idea. Unfortunately, so far, nobody has been able to actually warp time and/or space.
However, what cannot be done in real life can sometimes be done virtually, using a computer. Data can be warped at will!
“So why would anybody bother warping any data?” you may ask. For some not-so-mad scientists, there is good reason. At the Woods Hole Oceanographic Institution, for example, we warp underwater sounds!
Wait … why would someone want to warp underwater sounds?
Well, because sound is the primary means to transmit information in the underwater medium. Listen in, and you can know what’s going on in the ocean. And warping makes it easier to unravel a cacophony of underwater noise and hear more clearly.
‘Seeing’ with sound
If you are deep under water, you cannot see past your nose. There’s no light, and there’s also no wi-fi, no cellphone coverage, no GPS. All these technologies are based on the propagation of electromagnetic waves (light, infrared, microwave, and radio waves). These are wonderfully efficient in air, but not at all under water.
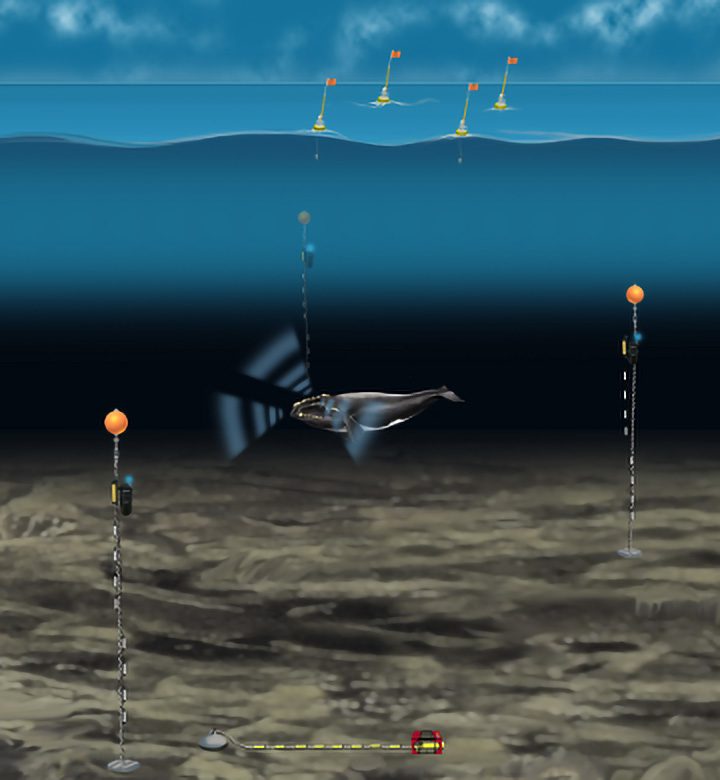
Under water, sound may not travel as fast as light, but it wins the marathon and propagates way farther. To communicate, navigate, and explore under water, everybody uses sound. Dolphins and whales communicate with sound. The Navy hunts submarines using sound. Seabed mapping, oil and gas exploration, and underwater communications are all done using good old sound. The ocean definitely is not a silent world!
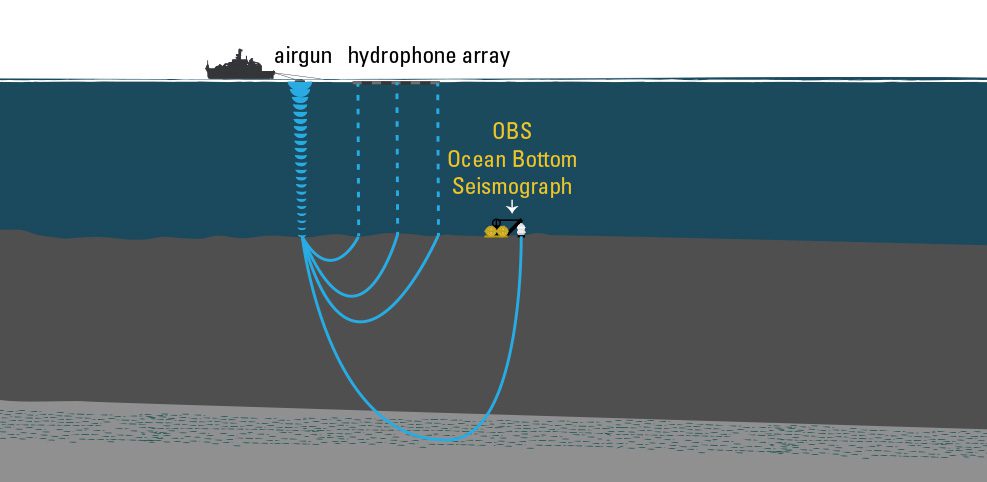
Oil and gas companies, for example, use airguns to find resources below the seafloor. These airguns basically work like a medical ultrasound, but to image the Earth, the sound waves must be much more powerful and very low frequency.
Airguns generate sound waves that propagate vertically from water to seafloor, then inside the seafloor, and at some point, they bounce on something (hopefully an oil reservoir) and come back toward the surface and are recorded by an array of underwater microphones, called hydrophones, and/or ocean bottom seismographs.
The more sound-wave listening devices you have, the more data points you get from different locations, giving you more information over space and time to interpret your sound signals. But it’s complicated and expensive to build, deploy, and maintain arrays of listening devices.
Wading in shallow waters
Tracking sound waves that travel vertically down into the deep abyss and up again is difficult enough. But for practitioners of underwater sound forensics, tracking sound waves horizontally, over dozens (and hundreds and thousands) of kilometers is even harder, and in coastal waters, it is a nightmare.
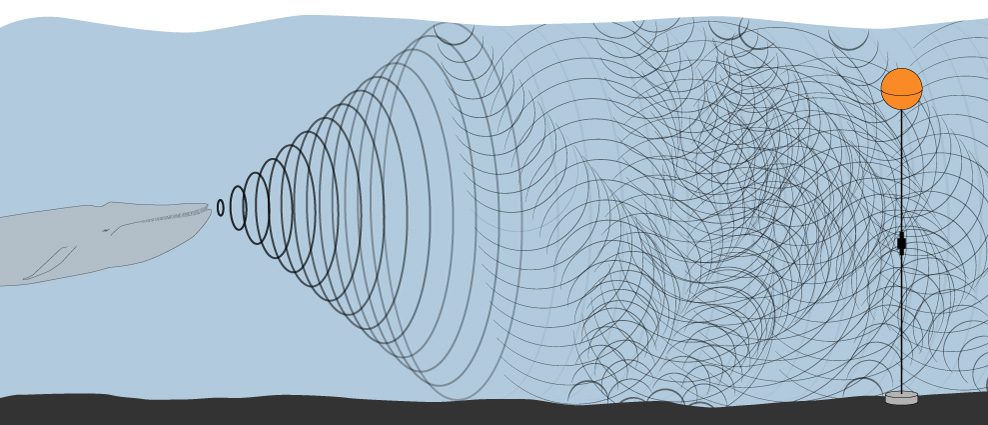
In shallow waters, space is confined into a narrower channel between the sea surface and seafloor. Sound waves bounce up and down between them like sound waves bouncing off the sides of a very narrow canyon.
Let’s try to make it clearer. Close your eyes and picture yourself in the middle of a wonderful valley, surrounded by mountains. You know it is a great place to play with echoes, so you just shout “HELLO.” A few second later, the mountains reply “… HELLO … hello … hello.” These are the sound waves you emitted that bounced on three mountains and came back to you.
Now imagine that the sound can bounce everywhere, as they do in shallow waters. You’ll receive hundreds of mixed hellos, and you may hear something like “HEhLhelleloolLloHeleoo.” There are so many echoes altogether that you cannot separate them.
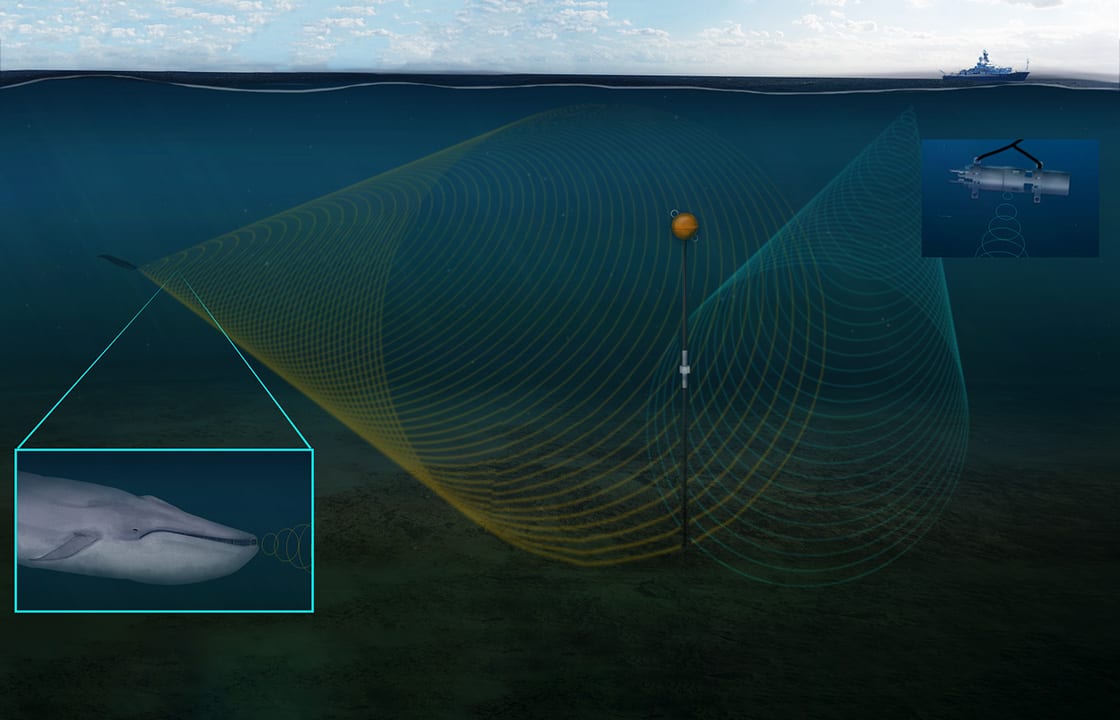
Look at the illustration above. In shallow waters, the seafloor and sea surface funnel the sound waves forward, acting as a “waveguide.” But the individual echoes (usually called propagating “modes” in science speak) that bounce off the “walls” of the seafloor and sea surface all interfere with one another. The effect is called waveguide dispersion, and as a result of it, the sound emitted by a source (say, a singing whale) in coastal waters is different from the same sound when it is recorded by a hydrophone a few kilometers away. That complicates things. How could we know that we are listening to a whale if it does not sound like a whale?
We have to unravel a hodgepodge of sounds, in which each individual signal is messed up because of dispersion. And at the same time, we’d like to do it without using expensive hydrophone arrays.
Warping is an exciting and effective way to accomplish this—with a single hydrophone.
The key notion is that the mixed-up dispersion patterns of the echoes/modes also carry information about how the sound is propagating—and thus about the environment (the water, the seafloor) that the sound is propagating through. If we can unmix the echoes/modes, we may be able to understand what is going on and infer information about both the source (yes, it’s a whale, and it’s five kilometers away!) and about the marine environment (what a surprise, the seafloor is muddy!).
Now, how do we do that? Unmixing the modes is the tricky part. It requires adequately processing the recorded sound data with a computer—a technique whose name you’ve probably heard of: “signal processing.”
Decomposing sound
There are a number of tricks we employ in signal processing. One classical trick is to transform sounds into pictures. To do that, we “decompose” a signal into constituent parts in order to change how it looks (which in science speak is called its “representation”).
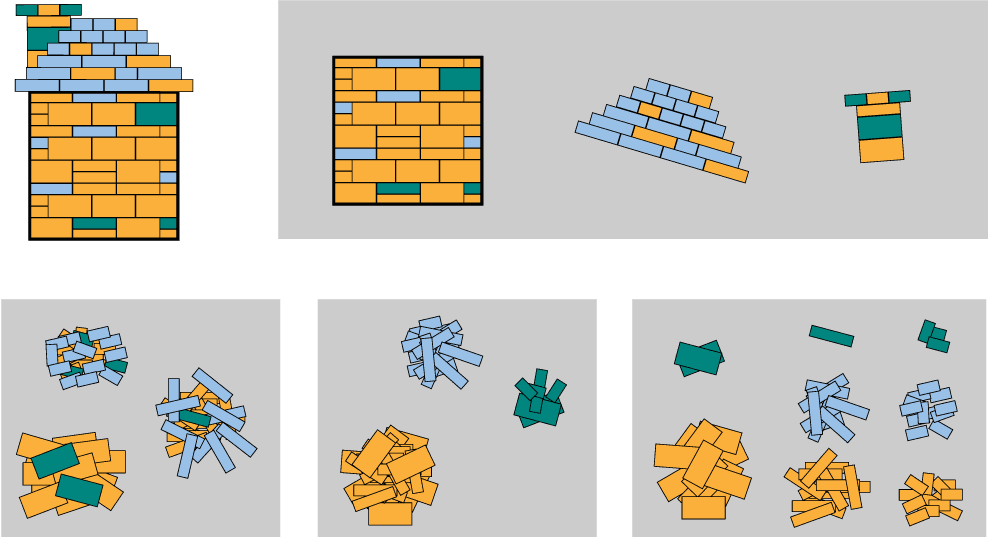
I know this sounds obscure, so let me translate with an analogy. Let’s say our sound signal is represented as a toy house built with 100 Lego bricks. Many representations of the house are possible, and we can “decompose” these representations by several categories. For example:
- Based on house elements, the house has four walls, one roof and a chimney.
- Based on brick size, it has 30 3.6-by-3.6-millimeter bricks, 30 7.2-by-7.2 bricks, and 40 3.6-by-14.4 bricks.
- Based on brick color, it has 20 green bricks, 50 orange bricks, and 30 blue bricks.
- Based on brick type, it has 3 3.6-by-3.6 green bricks, 15 7.2-by-7.2 orange bricks, 10 3.6-by-7.2 blue bricks, 1 7.2-by-7.2 green brick, etc.
Signal decomposition works exactly the same. One needs to choose an adequate representation and decompose the signal into it. In our underwater sounds context, the idea is to find a representation where we can easily unmix the modes. Here’s a quick example:
This is a classic representation of the sound of an airgun recorded eight kilometers away from the airgun source in the North Sea. It shows how the sound evolves with time. The vertical axis (acoustic pressure) is a measure of how powerful the signal is. It shows that the signal we recorded is powerful between 0.2 and 0.6 seconds, so that it lasts 0.4 seconds. Yet, we know that the original airgun sound from the source lasted less than 0.1 seconds. How can this be?
To try to make it clearer, say the source emits “BAM.” It has three letters and lasts three seconds. A few kilometers away, however, our hydrophone received “bbaAAaBbAmMM,” which has 12 letters and last 12 seconds. The received sound lasts longer than the signal at the source.
What happens is that different sound frequencies travel at different speeds. A good analogy is a race in which each individual runner is a frequency. When the starting gun goes off, every runner (and frequency) starts at the same time. But as the race progresses, the space between the faster and slower runners increases. Similarly, different frequencies travel at different speeds; the faster ones arrive first and the slower ones arrive later, so that the length of the signal increases.
Let’s go back to the airgun. The different frequencies of sound from the airgun traveled at different speeds, and thus our received signal is longer than the source signal. Is that it! No, that would be too easy.
Our hydrophone recorded many echoes/modes of the original airgun sound. Our received signal is completely different from the source signal. We need to unmix the echoes/modes to fully characterize it. We will have to decompose the airgun signal in another way, to transform the sound into another representation like this one:
This picture shows how the signal evolved over time (horizontal axis). In particular, it shows (on the vertical axis) how the sound signal’s frequency (high pitch versus low pitch) changed. We can see five or six yellow-greenish curved shapes. We have separated out and revealed all the individual modes that made up the signal!
Still, the separation between modes is a little mushy. Would you be able to see clean borders to separate them? The green-yellow is leaking from one mode to another. It would be a hard job to draw a conclusion. Our signal representation is not as clear as we would like. We need to do something else.
This is where warping becomes quite useful. (This is an article about warping, remember?)
Do you recall the warping example at the beginning of the story? Bending a sheet of paper to make traveling to work more convenient? We will do the same here—in two steps.
Time warp
First, we warp the signal by bending time. Mind you, we don’t truly bend time, but we can do it on the data using a computer. No faster-than-light travel here, but time warping it is! The graph below looks similar to the graph above, but look carefully. In the graph below, the sound signal is plotted not against time, but against warped time. We’ve warped time—stretching it so that the signal now lasts over 2.5 seconds, not one second, as it is in the graph above. As a result, the signal also gets stretched apart a bit, allowing us to separate out the modes.
Not quite as exciting as Star Trek, perhaps. But time warping it is.
In the second step, we take that time-warped signal and, as we did above, we chart it against frequency. And see what we have here:
Five nice horizontal bananas. Yes, these are our five modes again, but now separated and easy to distinguish.
Each banana contains info about what happened to the signal as it propagated through the ocean. That includes information about the location of the signal’s source, as well as information about seabed and/or water that it traveled through. Separating out the various bananas/modes unmixes the dispersion mess and makes this info available to us. Mind you, warping did not create anything. But it made the representation better.
Without warping, this would have required an expensive array of receivers. But if you warp time to separate the modes, you can get all the information you need from one hydrophone—making acoustical oceanography experiments much easier and cheaper.
Mixing basic and applied science
But what is gained on one hand must be paid on the other. Here, the price is data processing. Warping underwater sounds is not as easy as it seems.
To warp properly, you need to know what you want. Do you remember our sheet of paper? You must know where you are and where you want to go. If you randomly bend the paper, you may not gain anything, or even makes things worse.
The same holds true with warping sound. It’s a bit of a chicken-versus-egg scenario. In a way, you need to know which modes you’re looking for in order to unmix them with warping.
This is where basic science usually clashes with applied science. From the basic science point of view, warping is a wonderful signal-processing method. From the applied scientists’ point of view, warping is a useless data-processing trick. Why would you need such a stupid method that requires knowing what you are looking for in order to find it?
The solution is to build a bridge between basic science and applied science. To do so, the two groups need to understand both the geeky warping concepts and the pragmatic physics of sound propagation in the oceans.
If we do, we can routinely use warping for real-life oceanographic applications. We can use less expensive one-hydrophone methods to home in on the locations of baleen whales in the Arctic or to reveal a more detailed picture of the seafloor off Cape Cod (I wasn’t kidding, there’s really mud down there!).
Now, dear readers, you may have to warp your minds a bit to imagine how we can do that.
Illustration by Natalie Renier, WHOI Creative
This research has been funded by the Délégation Générale de l’Armement (French Department of Defense), the Office of Naval Research, the Office of Naval Research Global, and the North Pacific Research Board.
Related Articles
- How WHOI helped win World War II
- Learning to see through cloudy waters
- A curious robot is poised to rapidly expand reef research
- Whale Safe
- Measuring the great migration
- WHOI breaks in new research facility with MURAL Hack-A-Thon
- Bioacoustic alarms are sounding on Cape Cod
- A tunnel to the Twilight Zone
- The Deep-See Peers into the Depths
