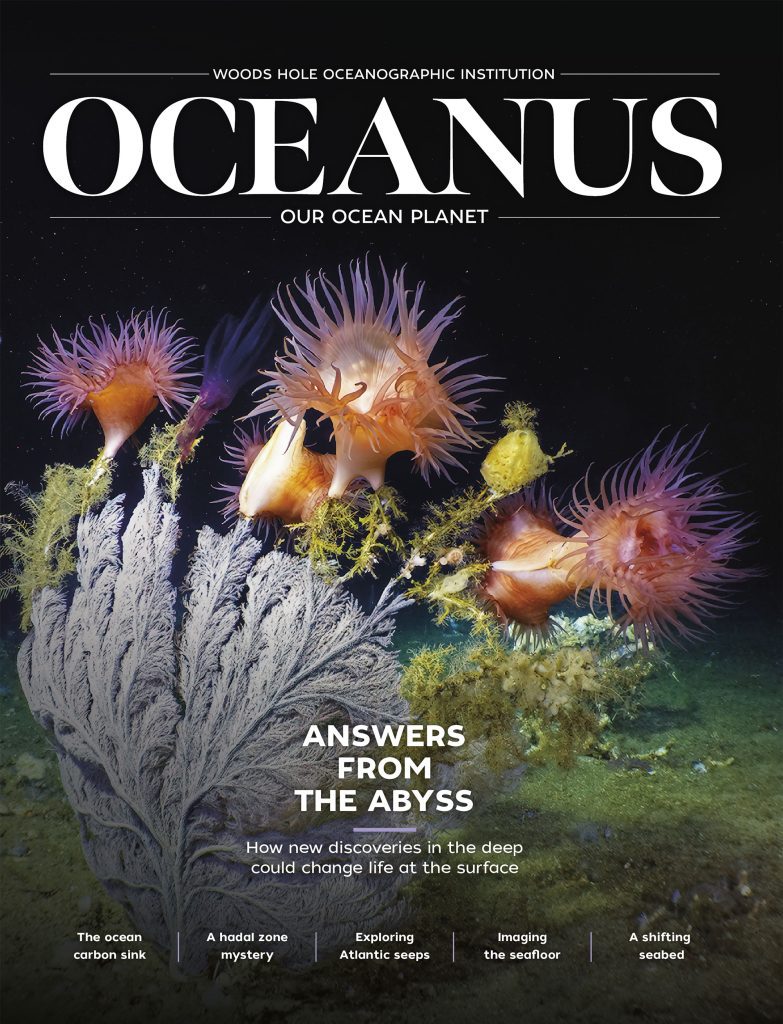
 This article printed in Oceanus Winter 2022
Estimated reading time: 18 minutes
The coast is a landscape in flux: sand migrates, marshes flood, cliffs erode and collapse. It is the place where land, sea, and sky meet in dynamic, and sometimes threatening, ways.
Yet despite its volatility, the coast continues to draw people to its fragile edge. Researchers estimate that a third of the global population lives within 60 miles of a coastline, and even more visit annually. And while these environments are valuable sources of food, jobs, and recreation, communities that live there must contend with a unique set of hazards, many of which are being exacerbated by climate change.
“The coast is the one region on the planet where all sorts of Earth processes, like earthquakes; and relevant ocean processes, like sea-level rise; and atmospheric processes, like enhanced rainfall and storm intensity, intersect,” says Rick Murray, deputy director and vice president for science and engineering at the Woods Hole Oceanographic Institution (WHOI). “We need to be much smarter about where and how we live at the coast. WHOI and our peer institutions have huge roles to play in providing the very best information to help us create socially, economically, and environmentally healthy coastlines.”
Researchers at WHOI are working to predict and mitigate hazards from major storms, rising seas, and tectonic shifts. Their work will help communities understand and adapt to these threats and find new ways to coexist with our changing coastlines.

The science before the storm
In late August of 2021, Hurricane Ida swept over the west end of Cuba as a category 1 storm and entered the Gulf of Mexico. It passed over a patch of particularly warm water — more than 86 °F — and, over the course of a single day, intensified into a category 4 hurricane that slammed into Louisiana with winds reaching over 170mph. The storm wiped out power for nearly a million people in Louisiana, including the entire city of New Orleans.
Hurricane Ida, like Hurricane Katrina 16 years earlier, intensified faster than expected owing to a boost of energy from a large, rotating mass of warm water that spun off of the Loop Current — a deep, fast ocean current that carries warm water from the Caribbean toward the Gulf coast of the United States.
"We need to be much smarter about where and how we live at the coast.”
—WHOI deputy director and vice president for science and engineering Rick Murray
The Loop Current enters the Gulf of Mexico between the Yucatán Peninsula and Cuba and exits as it curls around the southern tip of Florida. But in between those two points its path can vary — some years it bypasses the Gulf of Mexico almost entirely, hugging the Cuban coast, while other years it forms the loop for which it is named, bulging into the eastern portion of the Gulf. When the Loop Current is meandering far into the Gulf, sections of it can break off, creating spinning masses of warm water more than 100 miles across (160 kilometers), known as Loop Current eddies or warm-core rings.
“Both the Loop Current and these eddies contain extremely warm water,” says Amy Bower, a physical oceanographer at WHOI. “They carry this warm tropical water to higher latitudes, right into the path of hurricanes.”

Hurricanes draw their strength from warm water. In the Loop Current and its eddies, that warmth reaches hundreds of feet down through the water column, providing more fuel than sun-warmed surface waters contain. But the movements of these circulation patterns are hard to predict — scientists don’t yet know what causes the Loop Current to bulge into the Gulf of Mexico or when it’s going to break off rings.
Bower is leading a consortium of institutions in an effort to try to understand the Loop Current and what causes its path to fluctuate. The work could improve hurricane predictions and help provide more accurate short- and long-term forecasts for coastal communities in the Gulf.
“The goal is to get to the point where there’s an operational forecast system for the Loop Current,” Bower says. “In order to do that, we really need to understand the physics better and figure out which physical factors matter the most.”
In the Yucatán strait, where the Loop Current enters the Gulf, the researchers will put acoustic sensors on the seafloor, paired with buoys at the surface to measure salinity, water temperature, and water current speed. They’ll also scatter 20 Argo floats — drifting instruments that repeatedly descend through the water column and back to the surface in five-day cycles for months at a time — around the Gulf. The floats will collect a multitude of vertical profiles of water temperature and salinity as they travel, and transmit that information to scientists on shore every time they surface. These observations, combined with data from satellites and additional sensors, will feed into models to try to determine which factors are most relevant to Loop Current movements.
“Hurricane forecasters need to know where the warm water in the Gulf of Mexico is, and how deep it extends,” Bower says. “And right now, our long-term forecasting ability isn’t there. More than two weeks ahead of time, we don’t know where the Loop Current is going to be.”


The Coastal Research Amphibious Buggy (CRAB) is just one of the platforms used in North Carolina’s Outer Banks to make observations above turbulent coastal waves. (Left photo by Daniel Hentz, Right courtesy of Britt Raubenheimer, © Woods Hole Oceanographic Institution
While Bower works to improve hurricane predictions, WHOI scientist Britt Raubenheimer and her colleagues are trying to understand how these storms will affect coastlines when they hit.
Collecting data during a major storm can be a challenge: standard weather instruments often lose power or are damaged by winds and flooding. That means most measurements are taken during more moderate conditions or are estimated from looking at damage after the fact.
“We can look on Google Earth or at satellite data and see that a building is no longer there,” Raubenheimer says. “But as far as what happened to change that? Flooding can wipe out a structure, but so can wind. There are a lot of things we don't know.”
Raubenheimer is leading a national effort to get better data immediately ahead of and during hurricanes and similar events. The group, called Nearshore Extreme Events Reconnaissance (NEER), helps teams of researchers rapidly deploy instruments to study how flooding and other natural processes interact with the built environment during major storms.
“If we want to actually make better predictions in the future, better models in the future, better decisions in the future, we need to improve our understanding of nearshore processes during powerful storms,” Raubenheimer says.

She is working with Forrest Masters, a civil engineer at the University of Florida to design sturdy monitoring stations intended to be quickly installed on coastlines ahead of storms to measure wind speed, wave height, storm surge, erosion, and water quality. Theses rugged, 33-foot tall towers, dubbed Sentinels, are designed to withstand wind, impacts from debris, and up to 16 feet of storm surge.
The data the Sentinels collect will help researchers understand what could happen during future storms and provide crucial, real-time information for emergency responders. They operate on battery power and will be able to broadcast information via priority-access cell networks, making it instantly available to search and rescue teams and other emergency personnel.
“Emergency managers will have real-time measurements of flood water depth, how quickly the floodwaters are coming up, and what roads might be inundated by now, for themselves and for evacuees,” Raubenheimer says. “These observations can help managers, residents, and others know what the conditions are in these places and when, after the storm, they can get back in.”

Rising waters
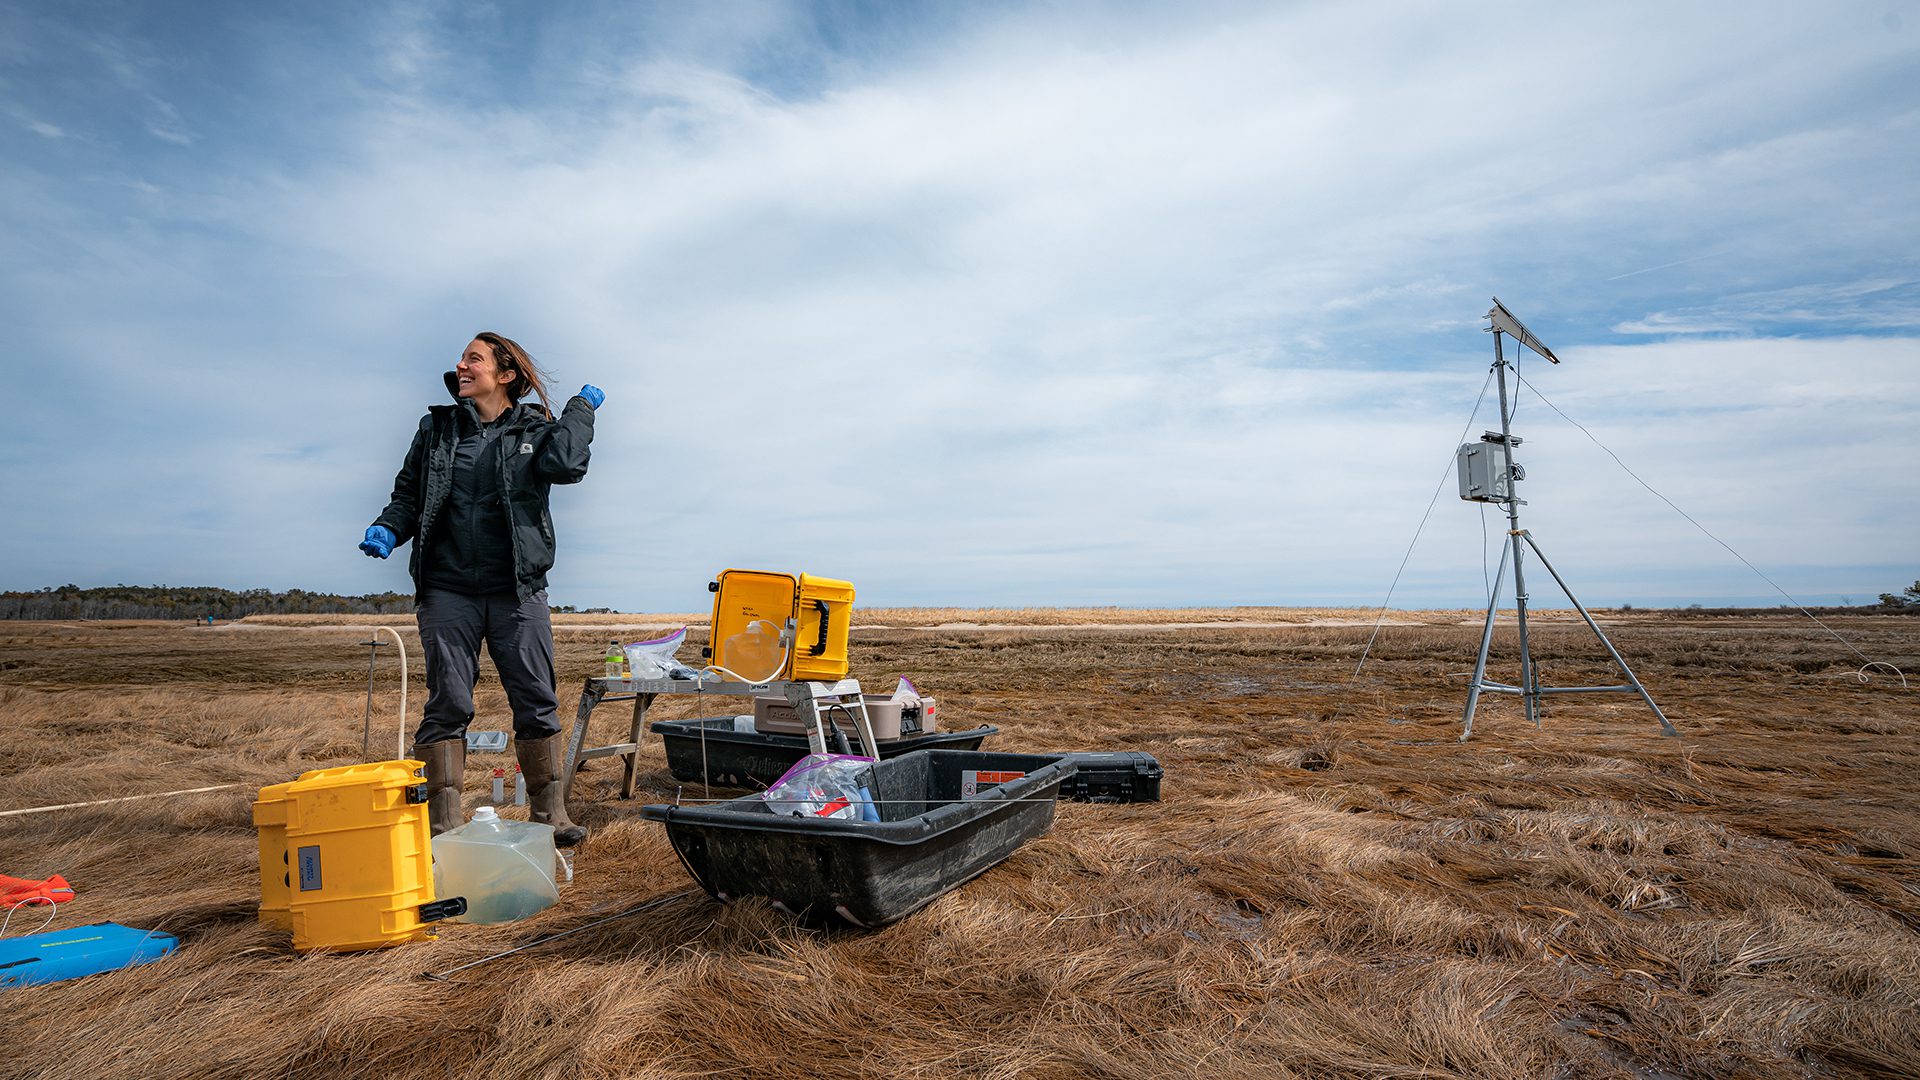
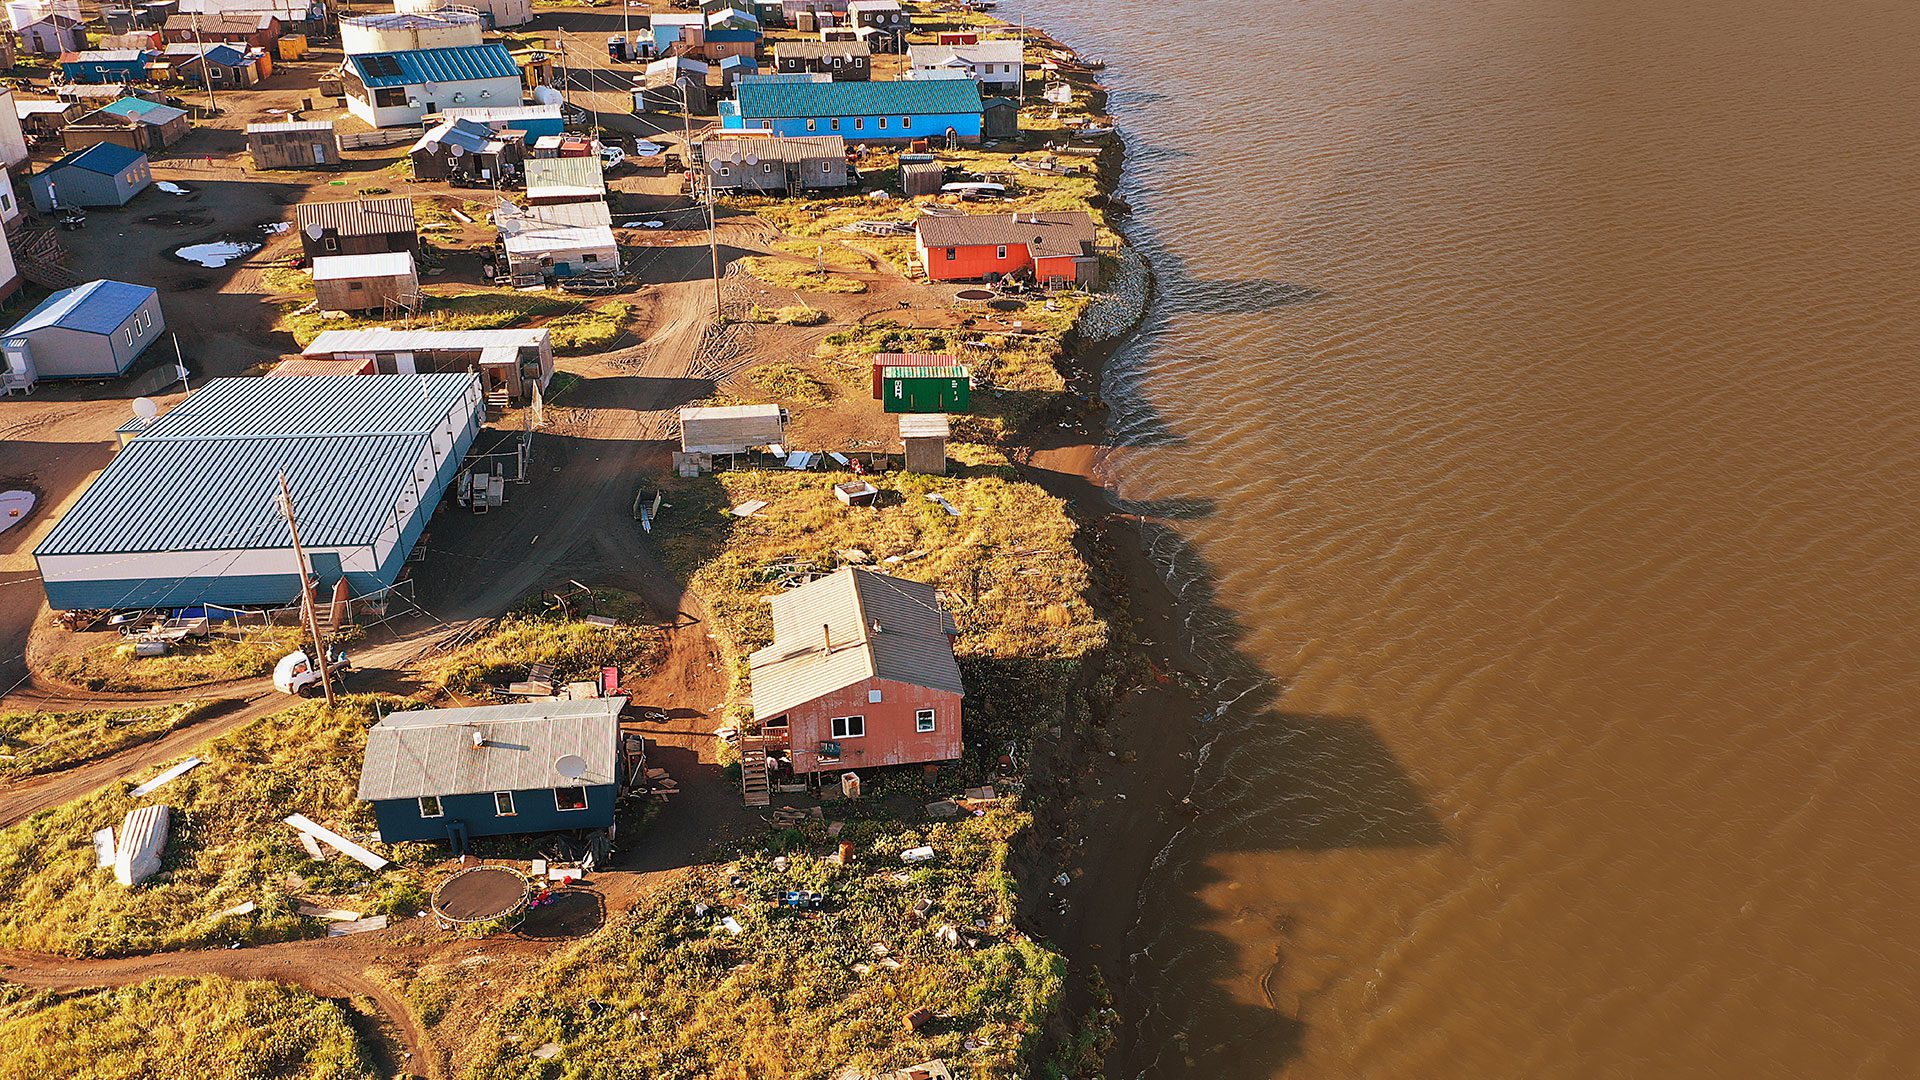
In summer, the landscape near Simpson Lagoon, along the northern coast of Alaska, is grassy and flat for miles in every direction. Buildings and pipelines run by the local oil industry are the only things that interrupt the view.
“You walk along this beautiful green tundra that goes right to the coast,” says Julia Guimond, a coastal groundwater hydrologist who will be joining WHOI as an assistant scientist this January. “But occasionally, you will see areas that appear degraded, where everything has died off and driftwood has washed up.”
These barren spots are potential areas where ocean water has washed over the tundra, depositing sand and killing plants. Guimond is studying saltwater intrusion over land in Alaska — where and why it’s happening and how it’s impacting the coastal tundra environment.
This landscape used to be protected from most storms and waves by a barrier of sea ice along the coast. But warming Arctic temperatures are making it harder for that ice to form, leaving this tundra and other coastal landscapes in Alaska vulnerable. The lack of ice, combined with rising sea levels and more intense storms, means that these areas are flooding more frequently than ever before and, in many places, beginning to erode away.
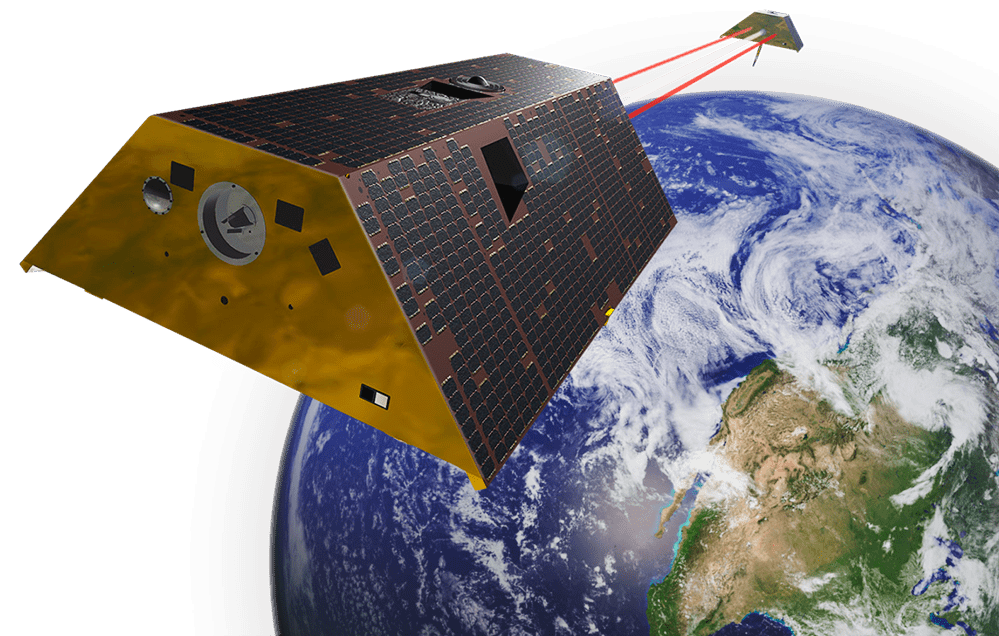
By measuring minor changes in the axial alignment between two of NASA’s GRACE-FO satellites, scientists can calculate subtle shifts in the Earth’s gravitational field caused by changes in water mass around the planet. (Photo by NASA Visualization Technology Applications and Development)
“In some high-latitude environments, you get erosion rates that are on the order of meters per year,” Guimond says. “Thinking about how saltwater intrusion interacts with the permafrost can give us insight into areas that are potentially more prone to erosion. High-lattitude coastal communities and infrastructure are built on the permafrost — when permafrost thaws it can have implications for the infrastructure stability as well as the community resilience.”
Coastal towns around Alaska are facing the very real risk of having the ground vanish out from under them. Newtok, Alaska, a Yup’ik village along a river near the Bering Sea, made the difficult decision to relocate more than two decades ago because of erosion and thawing permafrost. The process of moving to the newly constructed Mertarvik, Alaska, about nine miles away, is expected to be completed in 2023. Other villages are considering undertaking similar moves.
Guimond has created a numerical model to examine the effects of saltwater entering frozen environments. When saltwater, which has a lower freezing temperature than fresh water, interacts with permafrost, it can potentially trigger thawing in areas that normally stay frozen year-round. She will be using data from her recent fieldwork in Alaska to help refine that model to better understand the local system and predict how it will respond to future changes.
“What if we have a large storm event, or more frequent storm events? How will sea-level rise compound such events?” Guimond says. “With field data and numerical models, we hope to be able to start to answer some of these really important questions.”
Flood risks are increasing in coastal landscapes all over the world as ice sheets melt and added heat causes ocean water to expand. While the long-term effects of sea-level rise will eventually cause low-lying areas to vanish beneath the waves, many places are already contending with the effects of ‘nuisance’ or ‘sunny day’ flooding — low-level flooding from particularly high tides and similarly innocuous events.
“Places that used to flood are flooding more often and places that never used to flood are now flooding,” says WHOI scientist Chris Piecuch. “And the cumulative effects of nuisance flooding, in terms of damaged infrastructure and economic impact, can outweigh the effects of a big storm event.”
Sea-level rise doesn’t necessarily occur evenly across the global ocean — it’s not like adding water to a bathtub — so some areas will be at risk sooner than others. Piecuch is looking at changes in the weight of the ocean to understand where and how sea levels are changing, and the risks those changes pose to coastlines in North America and beyond.
As large masses of water and ice move around, they cause a measurable change in the Earth’s gravitational pull, which minutely affects the flight of a pair of NASA satellites in orbit. The change in distance between those two satellites can be used to calculate fluctuations in the Earth’s gravity field. Piecuch uses that data to try to understand the processes causing water to flow around the planet and within the ocean.
“It’s only by understanding the basic workings of the ocean like this that you can have any hope of anticipating what’s going to happen in the future,” Piecuch says.
With the help of colleagues at several other institutions, Piecuch is also looking into our planet’s distant past to understand how sea levels have changed in earlier times. They are using data derived from salt-marsh sediments and coral micro-atolls to determine historic sea levels.
“The data we have from satellites over the past few decades are invaluable, but there are a lot of questions that they don’t answer,” Piecuch says. “We really want a richer understanding of how sea level behaves across space and time more generally, across climate history.”

When the seafloor moves
The Hoh people of northwestern Washington tell a story of a fight between Thunderbird and Whale that shook the earth and caused waves to swamp the coast, taking trees, villages, and people with it. The Tillamook tribe in Oregon has a similar story, as do the Yurok in Northern California, the Nuu-chah-nulth on Vancouver Island, and many other indigenous tribes in the region.
All along the Pacific Northwest coast, native people have passed down records of earthquakes and catastrophic tsunamis in legends and oral histories for generations. These stories match up with the tales told by sediment records from coastal lakes and estuaries in the area, where layers of mud and decaying plants are interrupted by a layer of sand and seashells every 400 years or so.
These events are the result of tectonic movement in the Cascadia Subduction Zone, a 600-mile plate boundary running parallel to the coast from Vancouver Island to Northern California. Here, the oceanic Juan de Fuca plate is shoving underneath the North American plate, catching and slipping as it goes.
“This is an area that, historically, gets very large earthquakes spaced hundreds of years apart,” says Dan Lizarralde, a marine geophysicist at WHOI. “The two plates lock and build up a lot of stress, and when they release it, it’s dramatic.”
Subduction zones, areas where one plate is moving under another, generate some of the largest earthquakes and tsunamis of any tectonically active area. The Tōhoku earthquake and tsunami, which resulted in the nuclear disaster at Fukushima, was the result of a subduction zone quake generated east of Japan. The largest earthquake ever recorded, a magnitude 9.5 known as the Great Chilean earthquake, was created by a rupture at a subduction zone near Chile’s southern coast. The quake and ensuing tsunami killed more than 1600 people and left an estimated 2 million Chileans homeless. Deadly tsunami waves barreled across the Pacific, claiming more lives in Hawaii, Japan, and the Philippines.

Some subduction zones are very active — Japan experiences frequent earthquakes from nearby plate boundaries — but Cascadia is deceptively quiet most of the time. The fault is silently building up stress and, since it is not releasing energy in smaller seismic shifts, it may abruptly release all that stress in one destructive earthquake. WHOI researchers, along with collaborators from the Lamont-Doherty Earth Observatory, University of Texas at Austin, and the U.S. Geological Survey, are trying to determine the shape and structure of the fault to understand the risks it poses and how coastal communities can prepare for them.
This spring, Lizarralde and WHOI geophysicist Juan Pablo Canales led a cruise to take a detailed look at one particular section of this subduction zone. They used a remotely operated vehicle (ROV) to place 107 ocean bottom nodes — sensors that can detect seismic data — closely spaced together along a 50km (31-mile) line on the seafloor near Newport, Oregon. Once the nodes were deployed, the researchers broadcasted a series of acoustic signals capable of penetrating many kilometers into the earth. As different wavelengths bounced off layers of sediment and rock, the nodes recorded the return signals, which will be translated into images of these layers. Thanks to the tight spacing of the nodes and the type of signals they used, the researchers will be able to resolve the fine-scale material properties that control, for example, how earthquake ruptures begin and propagate along this section of the fault.
“This is the first time in the academic community that we’ve acquired data of this type on the seafloor and it’s amazing. We’re going to learn a lot,” Lizarralde says. “After seeing the data, I’m pretty optimistic that we’re going to be able to say something about the shear strength properties of the plate boundary fault, which control the buildup of stress and the size of an earthquake.”
The data will help the researchers understand the friction between the two plates and what causes them to slip or bind in this section of the fault. But this level of detailed imaging and precise placement isn’t possible on a large scale yet and there are many places under the ocean where we need a better understanding of what’s going on and how it could threaten coastal communities.
This is where seismologist John Collins comes in. Collins runs the Ocean Bottom Seismograph lab at WHOI, a national facility tasked with preparing and deploying instruments to record seismic data on the seafloor all over the world. Unlike the nodes, which are placed precisely and retrieved after a relatively short time, ocean bottom seismographs are dropped from ships and may sit on the seafloor for a year or more, recording data. They’re able to cover a much larger area and identify tectonic hazards that we may not even be aware of yet.
“If you have a record of seismic activity in the vicinity of your array, you can identify the geometry of nearby faults and how much deformation might be on them,” Collins says. “It’s giving you a background picture of your hazard situation.”
Currently, the information from these sensors can’t be retrieved until they are brought back to the surface. But Collins and his colleagues are working on ways to get that information into the hands of modelers and emergency managers more quickly.
One method is to send an autonomous underwater vehicle (AUV) to buzz by each seismometer, offload data through an optical link, and surface to send that data back to shore via satellite. Another option is to add enough processing power to the seismometers to enable them to analyze and compress seismic data into a small enough package to be transmitted acoustically to a surface buoy and then on to scientists.
If the information from these seismometers could be retrieved in near-real time, it could be incorporated into monitoring networks and early warning systems for earthquakes and tsunamis.
“We’re talking about ways to put smarts on our system on the seafloor so that it sends one number—peak ground acceleration—from that point every second,” Collins says. “That number could feed into the whole California alerting system to help detect offshore geohazards.”

Living with hazards
Ecologist and writer Rachel Carson described the meeting of land and sea as “a place of compromise and conflict and eternal change.” The addition of human infrastructure has only made things more complicated.
If no action is taken, WHOI’s own facilities are going to flood regularly in the next few decades. So are many of the low-lying areas around Woods Hole. The institution is planning a massive project to raise the level of its dock, rebuild the adjacent structures to withstand predicted sea-level rise and storm surge, and move many of its labs to higher ground. WHOI is also partnering with nearby scientific institutions, local businesses, town management, and other stakeholders to assess threats and develop solutions for the area as a whole.
“We want to quickly get beyond examining the problem and into actually developing ways to be more resilient.”
—WHOI’s director of special projects for marine facilities and operations Leslie-Ann McGee
“We want to make sure the community can continue to thrive with timely adaptations to what is going to happen,” says Leslie-Ann McGee, WHOI’s director of special projects for marine facilities and operations. “We want to quickly get beyond examining the problem and into actually developing ways to be more resilient.”
Learning to coexist with coastal hazards will require investment, and it won’t look the same for every community. Some locations need improved early warning systems and well-marked evacuation routes. Others need to construct dunes or restore marshes. Some buildings and roads need to be updated and others need to be abandoned.
These aren’t easy solutions to implement, but living on the coast has always been challenging. And with a better understanding of the hazards we face, we have the opportunity to build a more resilient future at the edge of the sea.