Estimated reading time: 4 minutes
Oceanographer Amy Bower, legally blind since 1993, wants more people with disabilities to have the same opportunities that she has had to do something exciting like studying ocean science.
“It’s just heartbreaking to think that there could be a kid who has the same curiosity and interest in the world but can’t access stuff because they’re blind. That would be a killer,” says Bower, chair of the Physical Oceanography Department at the Woods Hole Oceanographic Institution (WHOI), who gradually lost her vision due to a genetic degenerative retinal disease.
Bower’s desire to expand opportunities for the blind, those with learning impediments, and other segments of the population who are underrepresented in science led her to initiate a new project, Accessible Oceans. It aims to advance science literacy and STEM education by making ocean science more accessible in nontraditional and nonvisual ways.
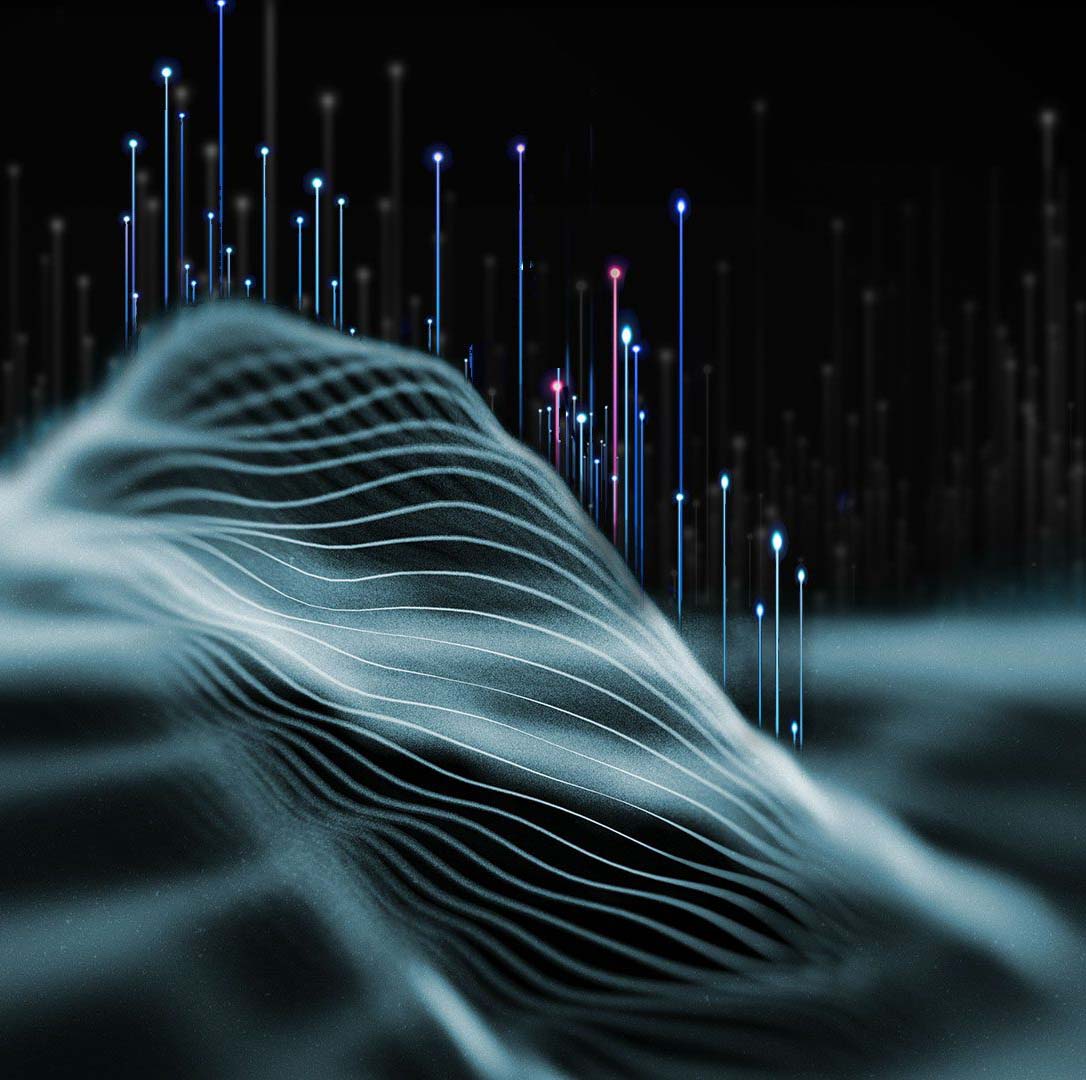
She and an interdisciplinary team of scientists and sound experts are working to design auditory displays of ocean data about phenomena such ocean-atmosphere exchange and underwater volcanic eruptions. The displays will go beyond just music, narration, or environmental sounds that you might hear through headphones while walking through a typical museum exhibit.
Through auditory displays, the scientists want to use “data sonification” to convey complex quantitative ocean science information, such as charts and graphs about ocean phenomena, that is challenging to express non-visually, said Bower, the project’s principle investigator. The two-year pilot and feasibility study, funded by the National Science Foundation’s (NSF) Advancing Informal STEM Learning program, started in September.
“We want to develop best practices for sonifying quantitative information, which is representing data with sound,” Bower adds of the pilot effort that she hopes could lead to a follow-on broader program. Quantitative analysis is “an educational stepping stone” for gleaning more information out of data, she says.
The team is using what are known as data nuggets—curated ocean data sets— from the NSF-funded Ocean Observatories Initiative (OOI) to design and evaluate auditory displays that can communicate ocean science.
The team selected five data nuggets to work with and represent through sound, including the two-way transfer of carbon dioxide between the ocean and atmosphere, the seafloor falling several feet during the 2015 Axial Seamount volcanic eruption, and the reaction of microscopic marine organisms off the coast of Oregon during the 2017 total solar eclipse.
Oceanographer Leslie Smith helped develop the data nuggets from the enormous amount of information that the OOI’s ocean sensors continuously collect. Now Smith, president of Your Ocean Consulting, LLC, is helping the Accessible Ocean project turn some of those nuggets into sound. To build the OOI data nuggets, “we pulled out specific bite-sized data sets, or nuggets, that show very specific phenomena in the ocean” such as carbon flux that might be taught in an introductory oceanography course, Smith says.
The team will break down those nuggets for the fifth or sixth grade level, and they will co-design sounds with scientists, teachers, visually-impaired students, and others, while also drawing on their feedback to determine what works best.

When it comes to audio representations of certain types of ocean data, there are some low hanging fruit options. The flux of carbon dioxide, for example, could be represented by breathing in and out sounds. Or ocean depth and temperature could be represented through vocalizing from a deep to a high voice to represent low or high numbers. However, other data, including charts and graphs, may be more complicated and require trial and error to settle on audio that's representative of the data.
“We want to go beyond just frequency modulation with the sound” to deepen the non-visual understanding of data, said Bower. How to get beyond the low-hanging fruit “is the research,” she said.
According to project co-principle investigator Jon Bellona, “sonification is for our ears what visualization is for our eyes.” Bellona, senior instructor of music technology and audio production at the University of Oregon, will do the actual transforming of data into sound.
Bellona said it’s fun to be able to wrestle with what are the important factors of ocean phenomena that data sensors are telling us, and to imagine how to convey that through sound so that anyone—whether or not they have visual impairments—may be able to listen to that data and grasp some understanding of what’s being communicated.
Smith and others emphasized the need for an ocean and data-literate society. “If we only make everything accessible to people who learn visually, or to people who have their full vision capabilities, there is a big portion of the population that we are just cutting out, and that’s not fair,” says Smith. “If we can figure out a way to break down that barrier, then I think it’s a win for everyone.”