
Timmermans, M.-L., Le Bras, I., O’Brien, J., Margevich, A., Macoun, P., Williams, B., & Zimmermann, S. (2025). Introduction to the Special Collection on the Arctic Ocean’s Changing Beaufort Gyre. Journal of Geophysical Research: Oceans, 130(7), e2025JC023013. https://doi.org/10.1029/2025JC023013
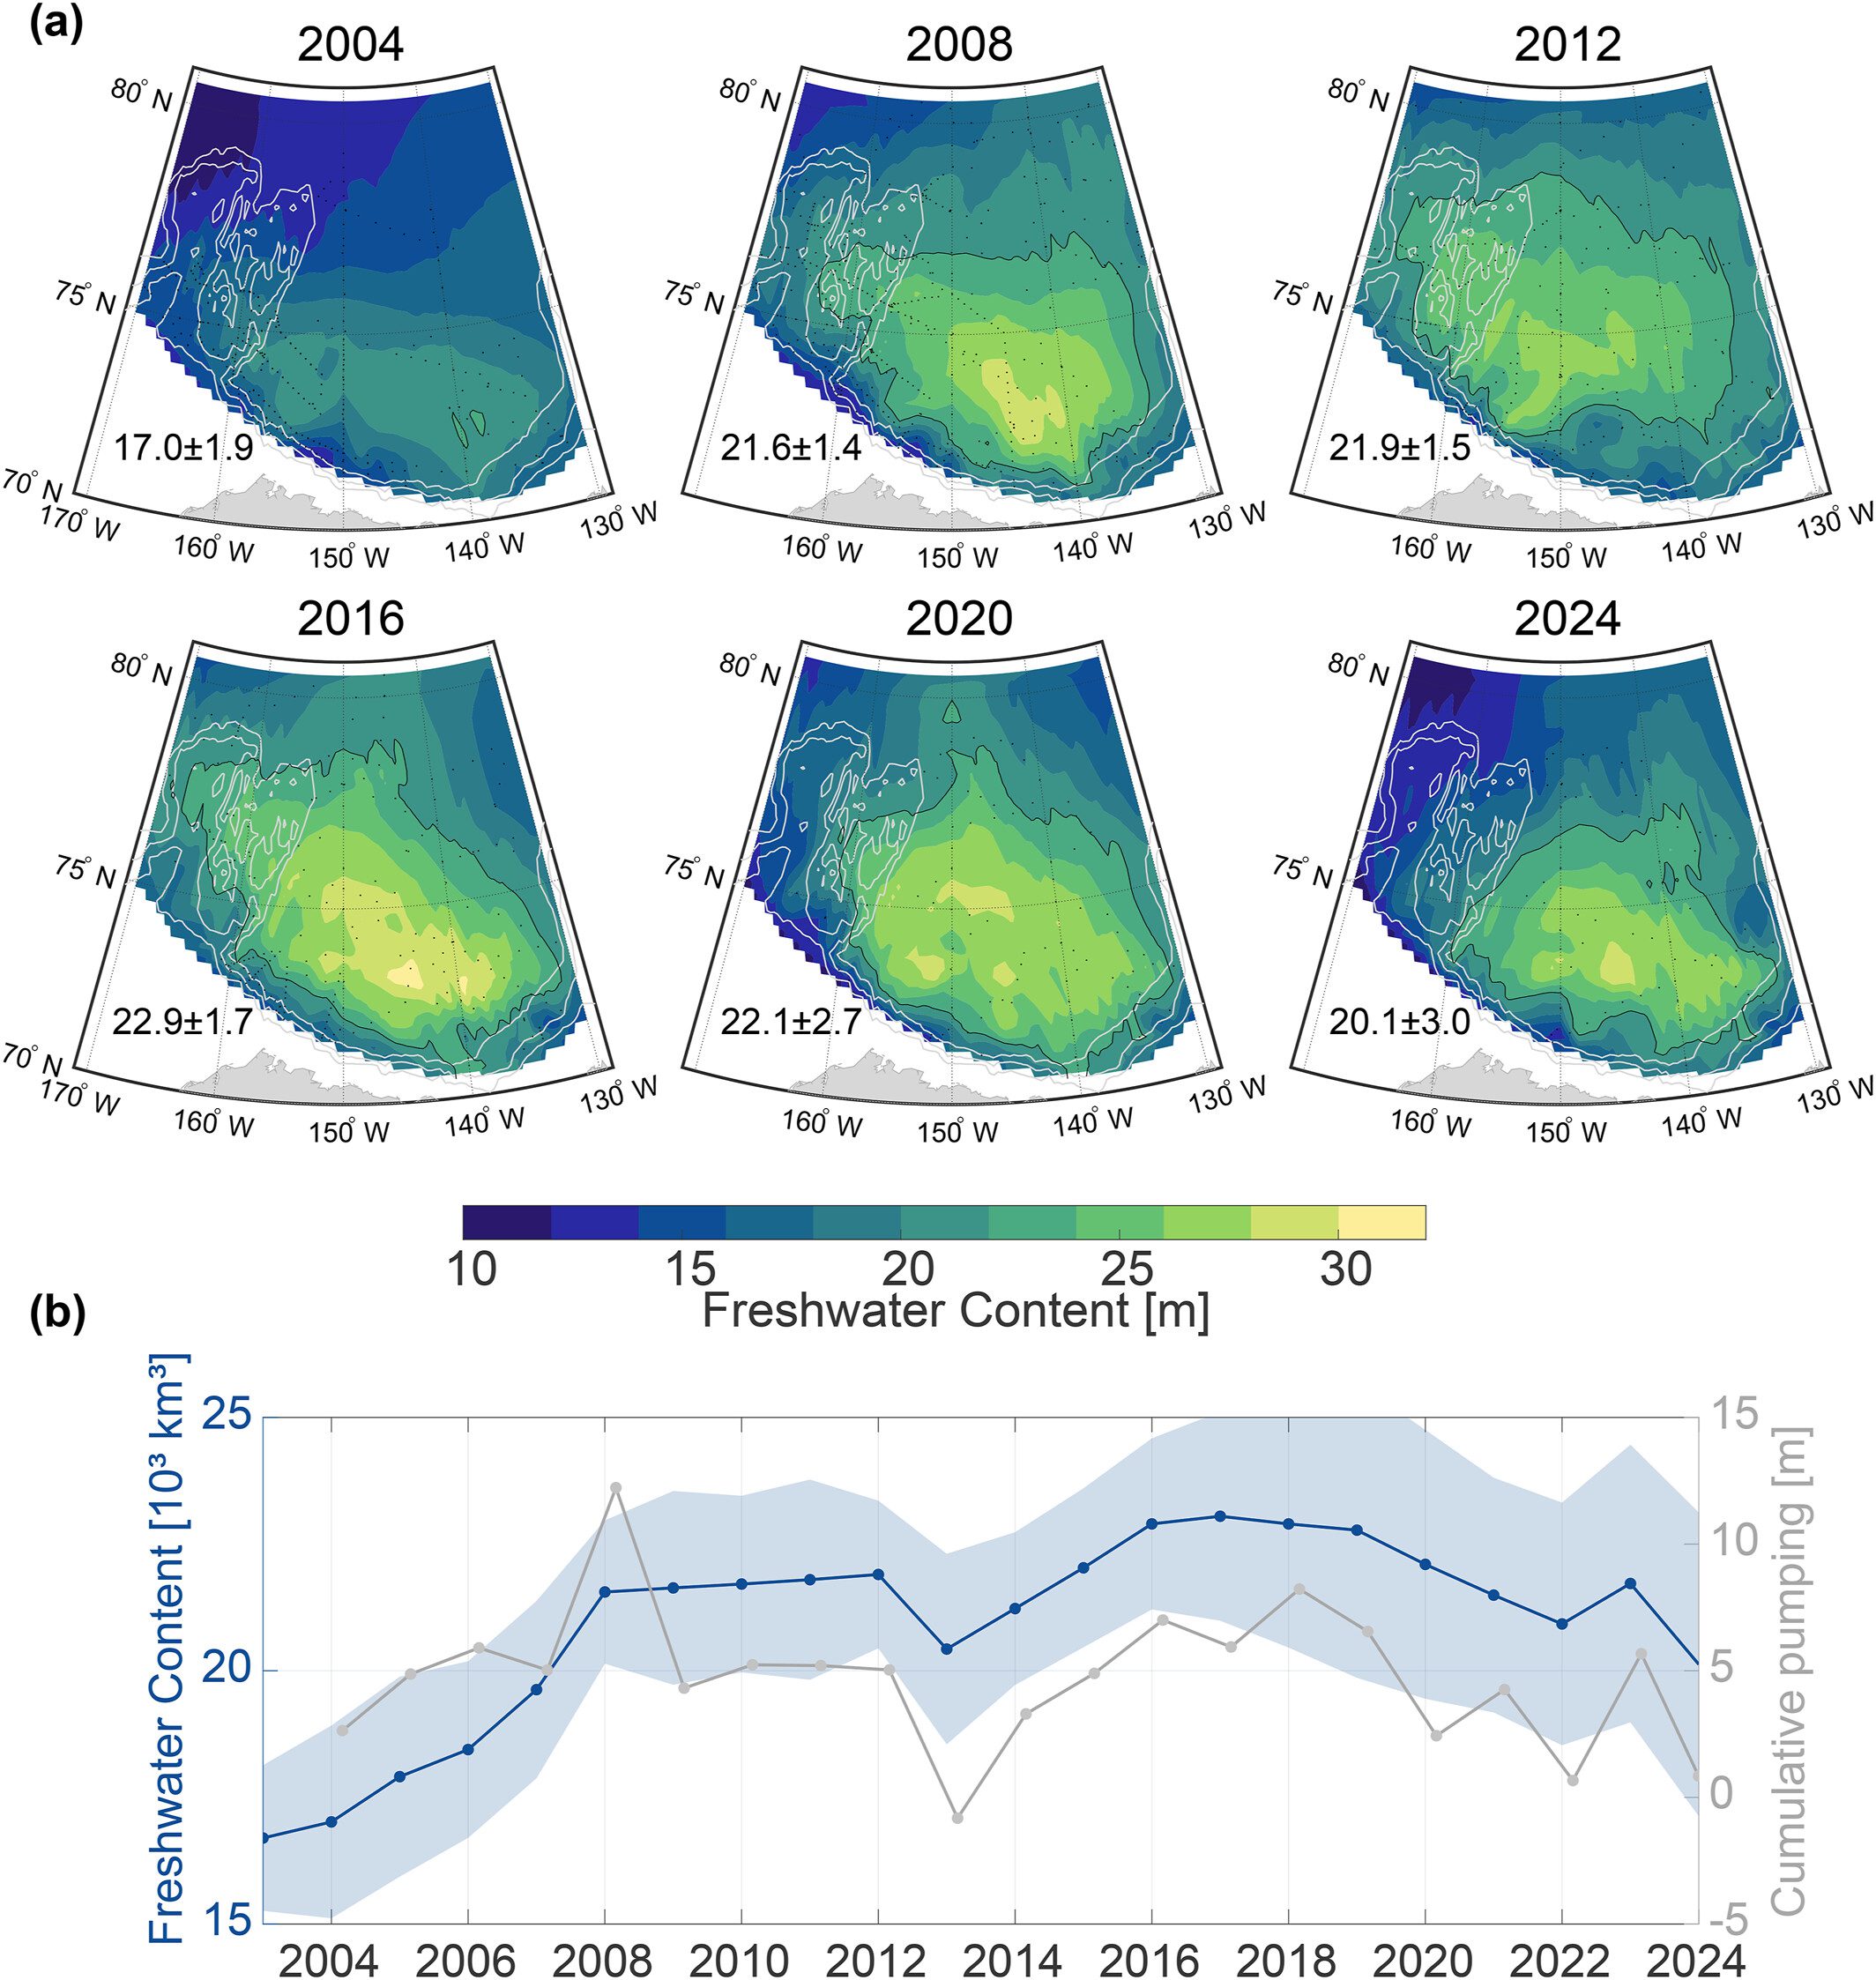
(a) Maps of freshwater content (relative to salinity 34.8) for the years indicated. The black dots show the locations of observations taken sometime from July to October in the respective years, and the black line shows the 22-m freshwater content contour. Maps were constructed using optimal interpolation on a 50-km square grid following the method outlined by Proshutinsky et al. (2009). (b) Time series of total freshwater content and root mean square error in the Beaufort Gyre Region (BGR) (left -axis) and cumulative Ekman pumping over the BGR (gray, right -axis); this is the annual cumulative sum of the monthly average Ekman pumping beginning in March of each year. Image provided by Isabela Le Bras.