
Taschetto, A., McGregor, S., Dommenget, D., Gillett, Z., Nicholls, N., Sharmila, S., van Rensch, P., Verdon-Kidd, D., Boschat, G., Chung, C., Lieber, R., Abram, N., Allan, R., Allen, K., Ashcroft, L., Brown, J., Cai, W., Chand, S., Cowan, T., Dao, T. L., de Burgh-Day, C., Freund, M. B., Gallant, A., Gergis, J., Holbrook, N. J., Heidemann, H., Holgate, C., Hope, P., King, A., Lim, E.-P., McBride, J. L., McKay, R. C., Nguyen, H., Pepler, A., Perkins-Kirkpatrick, S., Power, S., Risbey, J. S., Santoso, A., Ummenhofer, C. C., Wang, G., & Zhang, X. (2025). Climate impacts of the El Niño–Southern Oscillation on Australia. Nature Reviews Earth & Environment, 1–21. https://doi.org/10.1038/s43017-025-00747-x
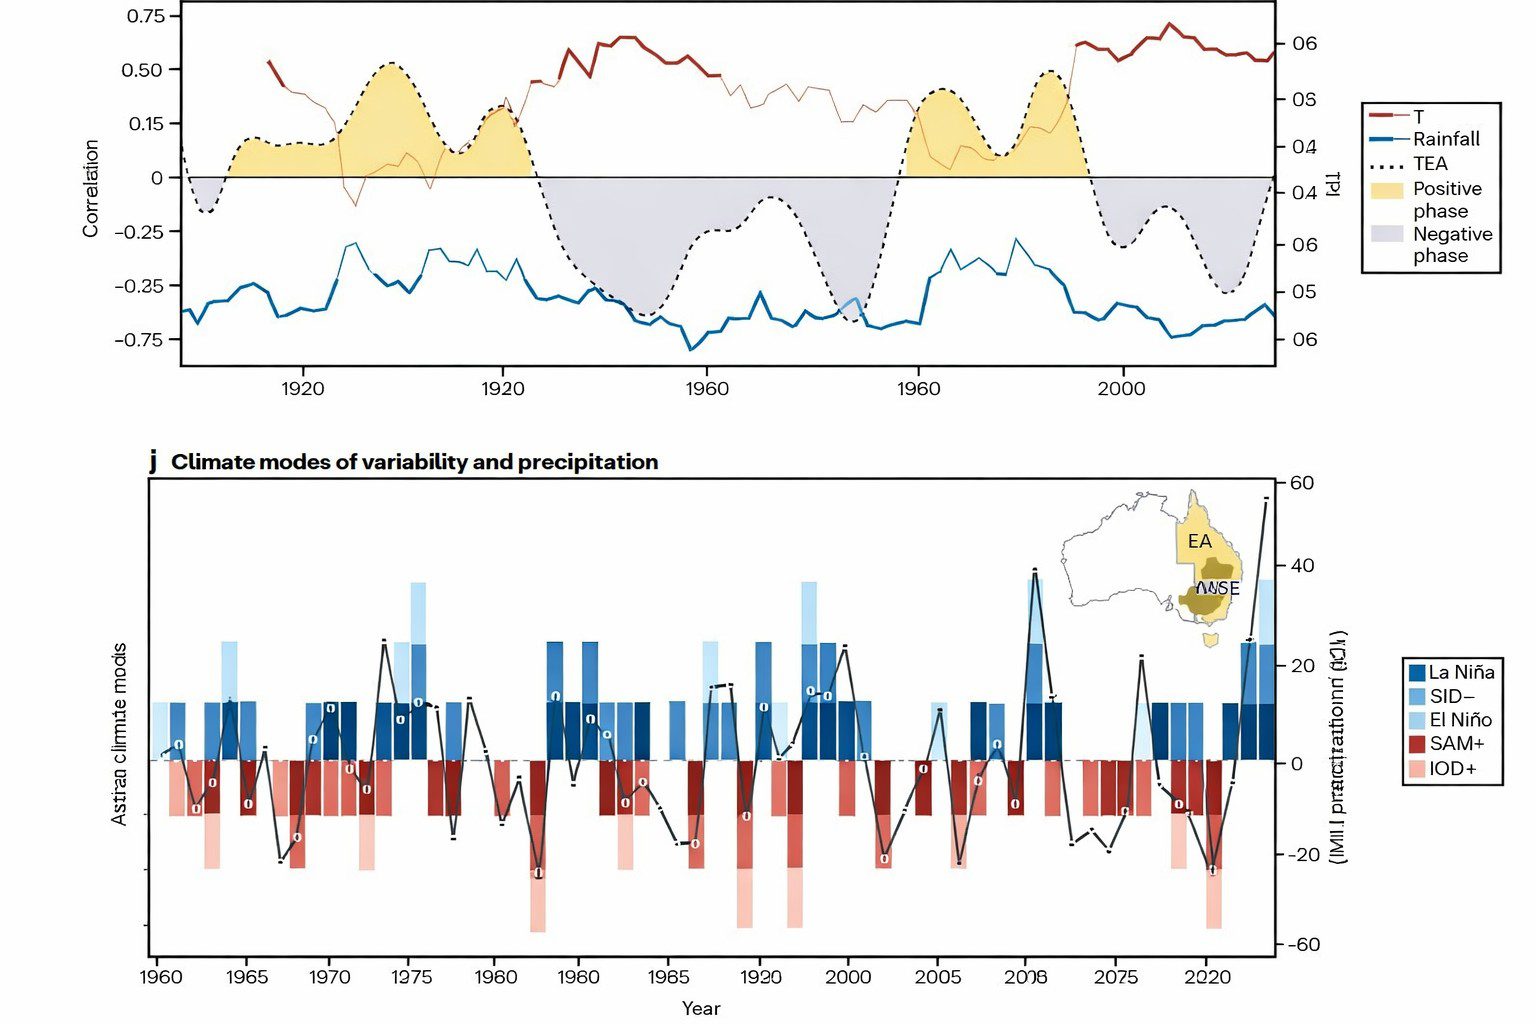
(Top) Multidecadal variability in the teleconnection, illustrated as the 14-year sliding correlation between September to November (SON) Niño3.4 and east Australian rainfall (blue line) and Tmax (red line). Thick portions of the lines show statistically significant correlation coefficients at the 90% confidence level. The Interdecadal Pacific Oscillation Tripole Index (TPI) filtered time series is overlaid (dotted line; positive and negative phases shaded yellow and grey, respectively). Australian Gridded Climate Data (AGCD) rainfall and HadISST data from 1900 to 2023. AGCD Tmax data available from 1910 to 2023. (bottom) Combined influence of ENSO, Indian Ocean Dipole (IOD), and Southern Annular Mode (SAM) on east Australian precipitation depicted by the time series of climate modes of variability and precipitation averaged over the Murray Darling Basin (MDB; line). East Australia (EA; yellow) and MDB (brown) regions are represented on the top-right map in the lower panel. [Adapted from Taschetto et al. 2025]