|
|
 |
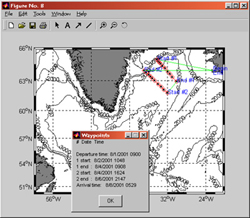 |
Sample Cruisetrack product.
|
Software - Cruisetrack
Index | BBL | Planview | Xshelf | Cruisetrack
Motivation
Cruisetrack is a planning tool for seagoing oceanographers.
With it the user can build their next cruise and figure out how long that cruise
will take to complete. It operates entirely in the Matlab environment; the
only non-Mathworks product it requires is the m_map
toolbox developed by Rich Pawlowicz.
Installation:
- Visit the m_map webpage (Version 1.4) and install this package in its entirety.
Although it is not required, I recommend that you install all
of the GSHHS coastlines. In addition, at a very minimum, install
the TerrainBase 5 minute topography. If you want to use 2 minute
bathymetry, install the ETOPO2 2 minute database. Make sure that when you have the bathymetry data files installed to update m_tbase.m and m_etopo2.m to change the path to the data.
- Download and unzip this file [Get latest version here (zipped file)].
Winzip should extract them all easily into a directory of
your choice.
- Update your Matlab path to reflect the location of these new files.
- At the Matlab command prompt, type cl_ct. This will launch the GUI.
History:
| | |
| Version |
Date |
Changes |
| 1.7 |
11Jun08 |
- Added an option to use rhumb lines or great circle routes for computing distances and tracks in Cruisebuilder.
|
| 1.6 |
05Feb08 |
- Fixed a problem when using Cruisebuilder to cross the date line with sections. Note that if you are using a custom bathymetry file for projects near the dateline, use ALL West Longitude values for your LON array (i.e. don't use 178E, use -182W.)
|
| 1.5 |
29Aug06 |
- Upgraded from Smith/Sandwell 2 minute database to the ETOPO2 2 minute database. If you don't have the m_etopo2.m m-file installed, be sure to download the latest m_map package.
- South and North bounds input boxes swapped in the GUI. South is now first, as it should be.
|
| 1.4 |
13May02 |
- Previous versions required an m-file
called s2hms; now this is not needed (I put it right
into cl_ctgrg.m).
- Cruisetrack will now not give a warning if trackfile
name inputs are left empty (i.e. if you do not want
to have a homeport).
- Updated cl_ctsandgrid so that it automatically sets
the directory of the Smith/Sandwell bathymetry to m_map/private.
- Set fontsize to 8 in the GUI so that all text is visible in Linux Matlab.
|
| 1.3 |
19Apr02 |
- "Save defaults" button added. Now the user can easily save their default GUI variables without messing with any code.
|
| 1.2 |
11Mar02 |
- "Section summary" output added. When
"Save cruisetrack output to ASCII file" is checked,
summary text files will be generated for each section, and
named cruiseout_1, cruiseout_2, etc. where cruiseout is
the name you specify. These summary files only include weather
time and misc event times for the purpose of determining
when each section BEGINS.
- Initialization file and GUI cleaned
up so that it is easier to change defaults. Now, you JUST
have to change cl_ctini.m
- Cruisebuilder radio button startup
option removed - now, you choose your mode via popup window.
- In cruisebuilder fixed depth and fixed
spacing modes, you have the option of manually specifying
the lat/lon of the section endpoints. This feature can be
turned on/off with the checkbox.
|
| 1.1 |
Jan 02 |
Major rebuild; GUI totally redesigned. |
| 1.0 |
2001 |
Inital build |
Overview
Type cl_ct at the Matlab prompt. The Cruisetrack
GUI should appear (shown above). Note that it is composed of several
different "windows" and buttons. This description will proceed in
a counterclockwise direction from the Common plotting options window.
This window is so named because these choices apply to plots you
will make as you pick points in Cruisebuilder and plots you will
make as Cruisetrack output. The Quick plot option also will allow
you to display coastlines, bathymetry, and ASCII Lat/Lon files without
running any computations.
On the lower left hand side of the GUI, you will find the Cruisebuilder
portion. Use this to plan your next cruise - it allows you to choose
stations manually, use a fixed horizontal spacing, or a fixed depth
spacing. The program then allows you to save what you have built
into simple text files. Once these files are saved as ASCII text
files, you can automatically update the Waypoint input area in Cruisetrack
by hitting the Update cruisetrack button. Note that this button
simply puts the section prefix name and number of sections in the
appropriate boxes in the cruisetrack time options blocks. It saves
you from having to retype them.
On the far right is the Cruisetrack program itself.
This program computes the amount of time it will take to complete
your cruise, given a variety of inputs that you can control. Cruisetrack
can be run independently of Cruisebuilder; i.e. if you already have
the Lat/Lons of your stations, you don't need to run Cruisebuilder
at all. BUT, you do need to observe some restrictions on the way
the text files are created (explained more in depth below).
There are three Help buttons located on the GUI. Pushing these buttons will
give you specific tips for each of the corresponding "windows."
Building and Plotting a cruisetrack
| Step 1. Set
Common plotting options. |
| Step 1.1 Choose coordinates which
will define your box. Negative numbers are West and South.
Enter degrees only (decimals are fine). |
| Step 1.2 Choose whether or not
to display a coastline. Note that GSHHS coastline resolution
is dependent upon your "longitude difference" or the difference
between the max and min longitude of your box. The smaller
your box, the higher the resolution. Also, if you have not
installed the GSHHS coastlines, you will automatically get
the very crude m_coast. |
| Step 1.3 Choose whether or not
to display bathymetry contours. They are plotted as black
contour lines. |
| Step 1.4 Choose the contours you
wish to display. For Smith and Sandwell and TerrainBase
databases, bathy contours are always NEGATIVE and in METERS.
If you should choose your own database, be sure you know
if bathymetry is positive or negative, and the units. |
| Step 1.5 Choose the data source
for your bathymetry. Smith and Sandwell and TerrainBase
can both be installed as part of the m_map package. You
may also use your own bathymetry file. In that case, enter
the filename (MUST be a MATLAB .mat file!) in the box after
"File". Your .mat file MUST contain 3 arrays, LON,
LAT, and data (case-sensitive!). They must
be in the Matlab MESHGRID format. Be sure to choose your
Box so that your bathy fits inside! |
| Step 1.6 By checking this box,
you may add a (magenta) line (or series of lines) to your
plots. Enter your filename in the box (including suffix).
This file MUST be a 2 column ASCII file of (1) Lat (2) Lon.
Tip: Note that you can separate line segments by NaN NaN,
so in effect you can plot an infinite number of lines (or
points) with this one command. |
| Step 1.7 Push this button to see
your plot! Note that this will NOT plot any cruisetracks
you have built. That comes later. |
|
 |
Step 2.
Build your cruise track. |
Sample cruisebuilder
output
|
| Introduction. Cruisebuilder allows
you to build a cruise by selecting multiple sections. There
are three different ways you can choose points. The first
method is called "Random". Simply put, with this mode you
point and click with your mouse to lay down the stations.
[Click here]
for a sample plot. The second mode is "Fixed spacing (km)
along lines". In this mode you simply pick the beginning
and end points of a section, and the GUI will automatically
compute the station Lat/Lons given your input spacing (in
km). BE PATIENT! This mode is very CPU-intensive, and after
you pick your second point the computer may be working for
some time. [Click
here] for a sample of this type. The third mode is "Fixed
depth spacing (m) along lines". Like the second mode, you
choose the start and end points of a line. However, in this
mode the program will choose points based on the bathymetric
profile. It will put down a station every time the depth
changes by the amount you specify. However, if this depth
criteria is not met within a certain horizontal distance
("Max horiz (km"), it will put down a station regardless
of the depth. This mode is useful if you wish to put down
more points in an area of steeply sloping topography. [Click
here] to see a sample. NOTE that the mode you choose
can be different for each section. The km/depth spacing
can also be changed in between sections. |
| Step 2.1 Manually confirm lat/lon
choices. With this box checked, you can manually override
your endpoint posits. This is useful if you know where the
section endpoints have to be, and are not accurate enough
with the mouse selection. Note that this button only applies
to the section modes, NOT the "Random" mode. |
| Step 2.2 Input your choices for
the km spacing, depth spacing and max horizontal km spacing
(for depth mode). Note that these can all be changed after
picking the first section. |
| Step 2.3 Push this button to start
picking points. Here are a couple of tips to help you along:
WATCH THE TITLE! Cruisebuilder is driven by user (mouse
click) input. For example, when you immediately start Cruisebuilder,
it will draw your map and then enter ZOOM MODE. At this
point you can zoom in by selecting the upper left and lower
right corners of a box, or cancel by using the right mouse
button. You can zoom in as many times as you wish. You can
pick as many sections as you wish. Just remember that Cruisetrack
will join your sections starting from the end of Section
1 to the beginning of Section 2, etc. You will also get
the option of saving these waypoint in "pretty format" for
the bridge. This simply means that the Lat/Lon are broken
into degrees and decimal minutes, and a header line is put
on top. |
| Step 2.4 Update cruisetrack -
automatically updates cruisetrack waypoint file prefix and
number of sections (NOTE: ONLY works if you SAVED your cruisebuilder
work out to file). These output files are simple text files,
and can be edited by hand if you desire. An example is at
left. The second column is the Latitude (decimal degrees),
the third column is Longitude (decimal degrees), and the
fourth column is the depth. |
|
| Step 3. Compute
how long your cruise will take, and plot it. |
| Step 3.1 The first thing you will
need to set is the starting date. Note that these default
values can be changed by modifying cl_ctini.m. Decimal values
are fine. |
Step 3.2 The program will load
the section files based on what you input for "waypoint
file prefix". The name you put in should be your "base filename".
The program will then load files from 1 to "number of sections"
in this format: basefilename_1, basefilename_2, etc. For
example, say your waypoint filename is junk. You have 3
sections. The program will look for junk_1, junk_2, and
junk_3. If you only have 1 section, you may also just type
in the full filename in "Waypoint file prefix" and leave
"number of sections" blank. If the files are not found the
program will automatically abort (and let you know via a
popup window). Note that Cruisebuilder automatically outputs
(if you choose to Save) the correct file format.
The section files are 4 column ASCII text files, with these
columns:
(1) Station num (2) Latitude (3) Longitude (4) Depth of
Station
Note that the station number is just for your records -
the program doesn't use it. |
| Step 3.3 Enter your "trackfile"
filenames. These are 2 column ASCII text files of (1) Lat
(2) Lon. They are transit waypoints only; i.e. the program
assumes that after trackfile1, the next point is the first
station of section 1. Likewise, after the last station of
the cruise the program will look at trackfile2. The trackfiles
can be as many points as you like. They can be as simple
as 1 line (your home port). Transit legs (between sections)
are computed automatically. It is assumed you will go directly
from the last station of section 1 to the first of section
2, etc. |
| Step 3.4 Enter your "Speed (kts)
taking data," which is the speed made good while steaming
between stations. Then enter your "Speed (kts) transiting,"
which is the speed made good steaming to/from your cruisetrack
AND the transits in between sections. |
| Step 3.5 Enter your "Cast time,"
which is the minutes ROUNDTRIP per 1000m of depth that it
will take to complete the station. On a recent survey in
the Irminger Sea, we computed an average cast time of 40
minutes per 1000m of depth. For example, for a 3000m cast,
the total time the package was in the water was 2 hours.
The program automatically computes the time to perform every
hydrocast. NOTE that if you DON'T WANT the program to assume
you are stopping to do a full hydrocast, then edit the textfile
to put in whatever you wish for the depth for that station.
If you enter zeros for the depths, then the program will
assume you are not stopping to do any hydrocasts (BUT, the
time steaming along that line will use the "Speed taking
data" speed!). |
| Step 3.6 Enter the number of "misc
events" and duration of each (in hours). This is a fudge
factor you can apply, which can be anything from mooring
deployments to iceberg photo ops. |
| Step 3.7 Enter an estimate for
your "Weather days (1 f/each X)". This is the number of
"science" (i.e. non-transit) days lost to weather. This
means a total of science steaming time plus science wire
time. |
| Step 3.8 Save cruisetrack output
to ASCII file: if you check this box you will be able to
save the output of the "cruise quick stats" box in excruciating
detail. It also saves an ASCII text file summary for each
section you have. They are named with a _1, _2, etc suffix.
For example, say you choose an output file name of cruiseout,
and you have 3 sections. You will get a cruise summary called
"cruiseout" and 3 section summaries called "cruiseout_1",
"cruiseout_2", and "cruiseout_3" corresponding to each section.
These summary files only include weather time and misc event
times for the purpose of determining when each section BEGINS.
The "end times" for each station take into account the science
wire (hydrocast) time and transit time (note that this is
at "speed taking data") between stations only. They are
intended to be used by the bridge for planning purposes. |
Step 3.9 Compute time: pops up
a quick stat box. See sample at right.
Explanation of cruise breakdown:
Time to first station: this is the time it takes to steam
your "trackfile1" to the start of section1 at "speed transiting".
Science steaming time: this is the time it takes to steam
your sections at "speed taking data".
Science wire time: this is the amount of time the CTD is
in the water.
Transit time: this is the amount of time spent connecting
your sections, at "speed transiting".
Time from last station: this is the time it takes to steam
from your last station to "trackfile2" at "speed transiting".
Lost time due to weather: 1 out of every X days that you
have selected.
Lost time due to misc events: number of misc events * duration
of each.
Total cruise time: how long your cruise will take. |
| Step 3.10 Plot track: plots your
cruisetrack, along with any options you have selected from
Common plotting options |
|
Sample cruisetrack time
output
|
|

![[Click here]](images/cthelp_randomexample.gif)
![[Click here]](images/cthelp_fixeddistanceexample.gif)
![[Click here]](images/cthelp_fixeddepthexample.gif)