|
Observations of an Along-shelf Jet Following Hurricane Edouard, 1996
A Work in Progress
In Collaboration with H. Seim (UNC) and S. Lentz (WHOI)
Abstract
The second cruise of the CMO dye studies took place between September 4-18, 1996. On September 2, 1996, two days before the start of the
cruise, hurricane Edouard, which was tracking northward along the
east coast of the U.S., passed over the CMO mooring site. The
storm caused significant diapycnal mixing at the CMO site, which
in turn led to a reduction in stratification over much of the
water column. Despite such strong atmospheric forcing, however,
certain other aspects of the shelf circulation were relatively
unaffected by Edouard.
Of particular interest to the present study was a westward along-shelf jet centered
at approximately the 70 m isobath near the CMO site. Shipboard ADCP observations
taken by Barth et al. on September 1 (the day before the storm),
as well as a dye-release experiment performed from September 7-11 and shipboard ADCP
observations taken on September 8 (5-9 and 6 days after the storm, respectively) showed
a localized westward flow approximately 10 km in width, with maximum westward velocities
at its core in excess of 20 cm/s. As the jet was nearly 20 km inshore of the
shelf-slope front, its relation to the front is unclear.
The following is a description of the observed jet in terms of its hydrographic and
velocity structure, plus some speculation regarding its possible origin, associated
dynamics, and eventual fate.
Effects of Hurricane Edouard
The effects of hurricane Edouard on the New England shelf can be seen
in hydrographic sections made before and after the storm's passage. On August 31
and September 1, 1 - 2 days before the storm's arrival at the CMO site, the
hydrographic sections shown in Figure 1 were made by Barth et al. using
Seasoar.*
The sections consisted of 3 legs, the first and second legs representing a nearly
continuous section (with a 1 hour interruption) on August 31, and the third leg
repeating the first on September 1. Particularly noteworthy in the first and third
legs is the existence of a warm surface layer inshore of the
shelf-slope front. The layer extended to approximately 10 m depth, and was
characterized by temperatures above 18 oC.
In contrast to the pre-hurricane sections, a cross-shelf transect taken during the
dye release cruise on September 5, 3 days after the hurricane (Figure 2) shows
a well mixed upper water column inshore of the front, with temperatures
< 15 oC over most of the water column.
|
Figure 1. Hydrographic section taken by Barth et al. on August 31
- September 1, 1996, 1-2 days before hurricane Edouard.
(Images from S. Pierce's CMO Seasoar data report,
http://diana.oce.orst.edu/cmoweb/csr.)
|
|
Figure 2. Hydrographic section taken on September 5, 3 days
after hurricane Edouard. (Note the change in colormap and scale compared
to Figure 1.)
|
Pre-Edouard Velocity Measurements
Shipboard ADCP velocity measurements taken during the above Seasoar transects
showed a broad northwestward flow of between 10-30 cm/s over much of the shelf,
with a transition to southeastward flow of 10-20 cm/s seaward of the shelf slope front
(Figure 3). Of note in the last leg of those sections (far right in Figure 3)
is a localized core of northwestward flow which has pinched off and is now bordered
by an eastward return flow on both its inshore and offshore sides. The data
show that this westward jet was centered at approximately 40.4 oN,
was 10-15 km in width, and extended from the surface to approximately 40 m depth.
A plan view map of the same detided ADCP measurements at a depth of 23 m is shown
in Figure 4.
|
Figure 3. ADCP section taken by Barth et al. on August 31
- September 1, 1996, 1-2 days before hurricane Edouard.
(Images from S. Pierce's CMO Seasoar data report,
http://diana.oce.orst.edu/cmoweb/csr.)
|
|
Figure 4. Plan view of observed and subtidal velocity vectors at 23 m depth
taken by Barth et al. between August 31 - September 1, 1996, 1-2 days before
hurricane Edouard. Red circle indicates the region corresponding to the right-most
panels in Figure 3.
(Images from S. Pierce's CMO Seasoar data report,
http://diana.oce.orst.edu/cmoweb/csr. Red circle added for the sake of the
present discussion.)
|
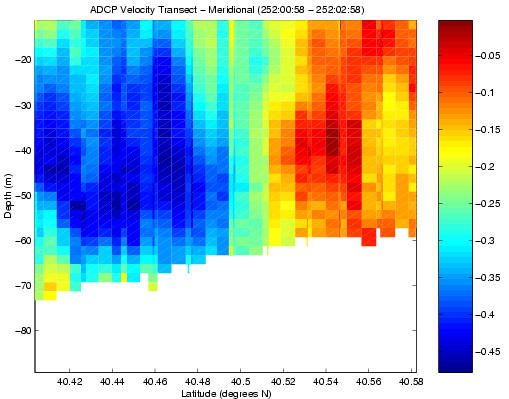
Post-Edouard Velocity Measurements
Two ADCP transects made on September 8 also showed a westward jet with
approximately the same characteristics and in the same location as in the
September 1 transect (Figure 5). Again the jet was approximately 10-15 km in
width; however, this time it was centered slightly further on-shelf at
approximately 40.45 oN. More notably it now extended over
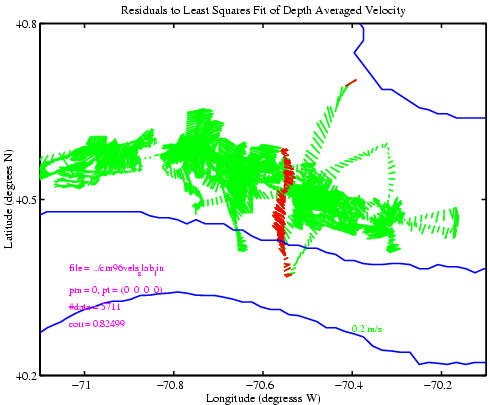
most of the water column. A plan view map of the residual barotropic velocity
(i.e., detided and demeaned) from the same ADCP measurements (Figure 6)
provide a second view of the jet's structure.**
|
Figure 5. Raw (i.e., not detided) u-component of velocity from two September 8
ADPC transects showing a westward-flowing mid-shelf jet.
|
|
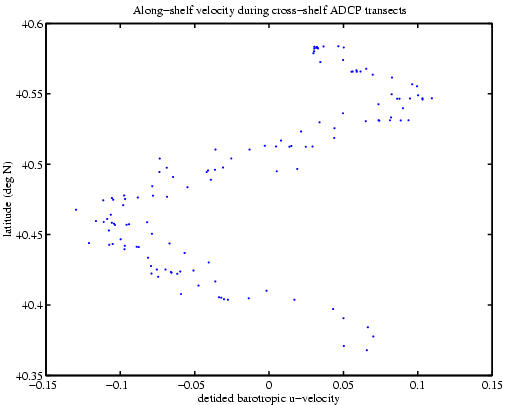
Figure 6. (a) Residual barotropic velocity from September 1996 CMO dye
cruise after removing tides and mean flow. Red vectors correspond to the
ADCP data shown in Figure 5.
(b) u-component of residual barotropic velocity as a function of latitude along
ADCP transects shown in Figure 5.
|
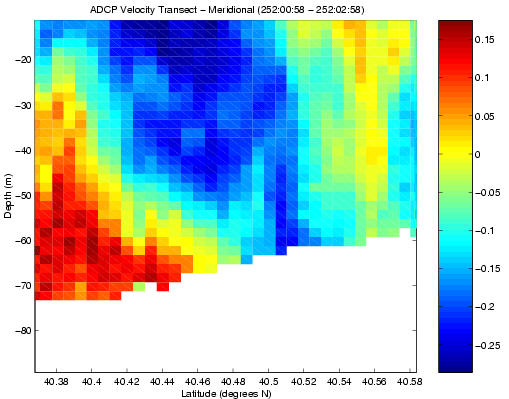
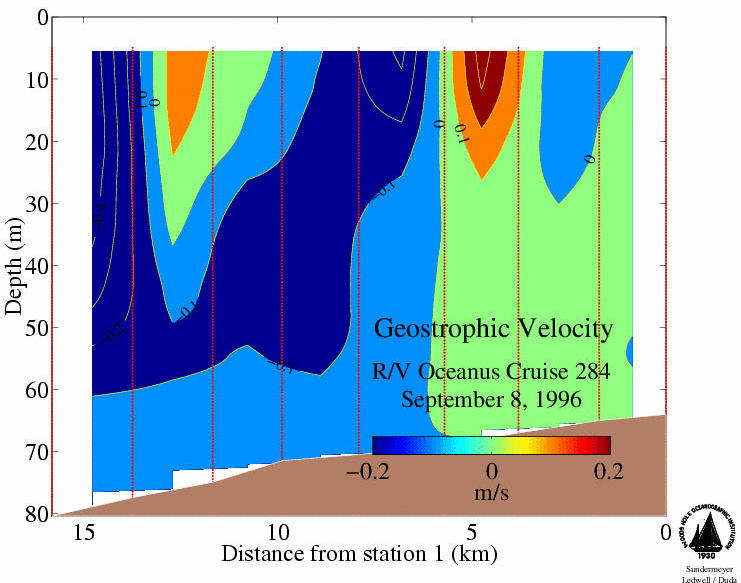
Hydrography and Geostrophic Velocity
In an effort to better understand the dynamics of the jet,
hydrographic measurements were also made during the first leg of the September 8
ADCP transect (see left panel of Figure 5). The resulting along-shelf geostophic velocity
is shown in Figure 7. The section shows good agreement with the corresponding ADCP
velocities, including a 10+ km wide (nearly) barotropic westward flow, with a counter-flow
to its northern side. A small near-surface counter flow is also evident in both
sections left of the jet's center, although the magnitude differs slightly in the
two estimates. These results indicate that the jet is geostrophically balanced to
lowest order, and hence has the potential of being a somewhat long-lived feature on
the shelf. This would at least in part explain its persistence from September 1 -
September 8.
|
Figure 7. Geostrophic velocity estimated from hydrographic data collected
during the first leg (left panel) of the ADCP transect shown in Figure 5. Note
the different colormap and horizontal scale compared to that figure.
|
Summary to Date
The above observations provide preliminary evidence of a 10-15 km wide
quasi-transient along-shelf jet centered at approximately 40.4 oN
over the New England shelf between September 1 and at least September 8, 1996.
The jet apparently began on September 1 as a baroclinic flow separation spun
off of a broad westward / northwestward flow along the shelf.
The passage of hurricane Edouard on September 2, 1996 apparently mixed the
jet over much of the water column. However, as evidenced by ADCP and hydrographic
observations on September 8, the jet remained otherwise in tact.
The existence and persistence of the jet raises a number of questions regarding
the dynamics of the shelf circulation, including its response to hurricane Edouard.
What was the relationship between the jet and the mixing and restratification
on the New England shelf before and after the hurricane? What were the dynamics
associated with the jet's origin and its likely fate in terms of frictional or
buoyancy spin-down? What were the broader impacts of the hurricane in terms of
mixing and subsequent adjustment of the waters over the New England shelf?
Again, the above description is preliminary, and leaves many questions unanswered.
However, we hope to address these in the near future.

* Please visit S. Pierce's CMO Seasoar data report,
http://diana.oce.orst.edu/cmoweb,
for more information on the CMO Seasoar cruises.
** A more detailed description of the de-tiding of the
1996 CMO dye cruise data using Candela's method can be found
here.
|