CMO Dye Studies - Sept '96 Cruise, ADCP Analysis

(Note: These are very preliminary analyses - submit comments to msundermeyer@whoi.edu.)

Objectives

Here we discuss the data collected from the shipboard ADCP during the Fall 1996 CMO dye cruise. Tidal analysis is performed on the shipboard ADCP data; the hope being that we can say something about both temporal and spatial variability in the horizontal velocity field.

Quality Control and Processing of the Raw Data

The processing of the raw shipboard ADCP data was handled by Harvey Seim (hseim@email.unc.edu), now at the University of North Carolina at Chapel Hill. The processed data are 3-minute averages, and include all the times when dye or epsonde/elitesonde microstructure instruments (Neil Oakey's group) were in the water, but not the transits to and from the CMO site (we were testing modes on the way out, and the weather kicked up on the way back). Quality control on the data lead to the discarding of 10-15% of the velocity profiles; most of the errors resulted from bottom-tracking problems. A conservative estimate of the absolute accuracy of a given point in a 3 minute average is in the 3-7 cm/s range. Precision is much better, so shears formed from the data should be pretty good. A noise floor for shear measurements has not yet been determined.

Ship Track During ADCP Survey Velocity Color Plot

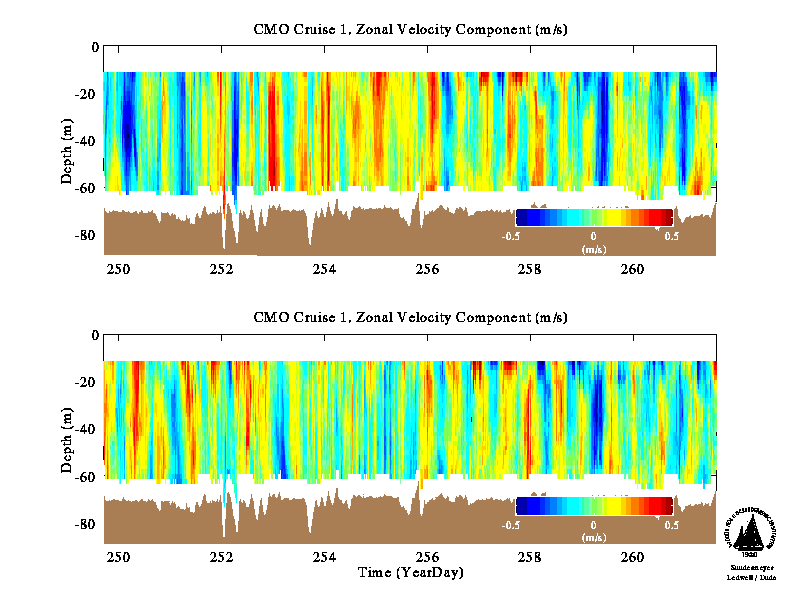
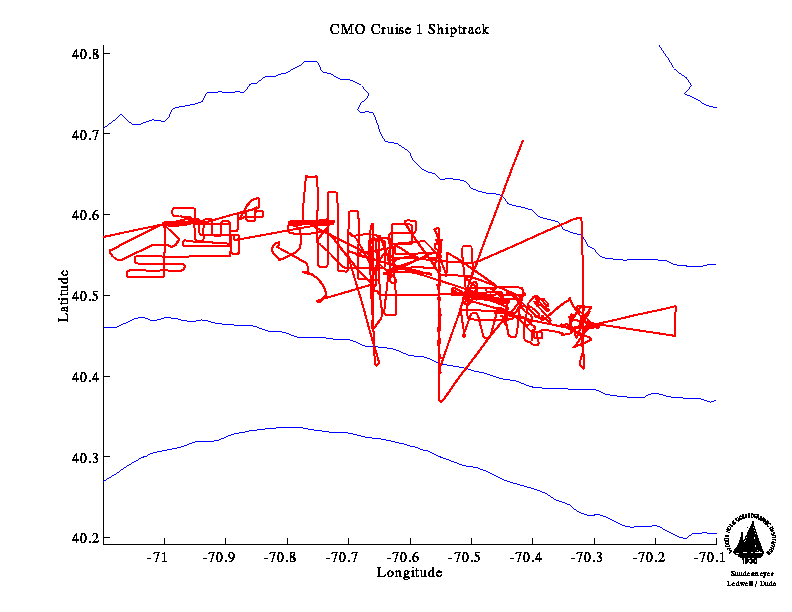
The data spanned a period of approximately 12 days, and covered an area approximately 25 km meridionally and 75 km zonally. The u and v velocity components as a function of depth and time for CMO dye cruise 1 are shown to the right. The ship track corresponding to these data is also shown to the right.

Barotropic Velocity Spectra

Velocity Color Plot

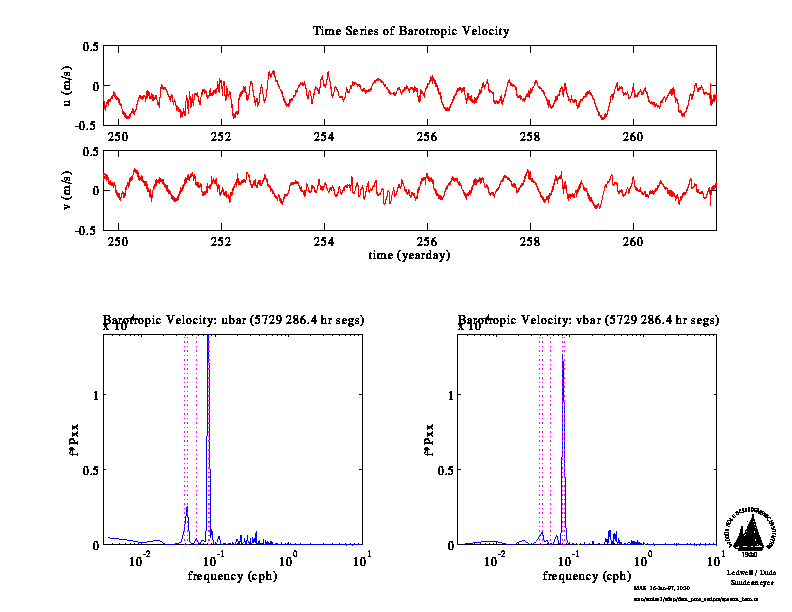
The tidal energy in the data is revealed by power spectra of the barotropic velocity field for the zonal and meridional components. Spectral peaks are readily apparent for the diurnal and semi-diurnal bands, while no significant peak is visible at the local inertial frequency (dotted lines in the figure indicate inertial, principal lunar (M2), principal solar (S2), principal lunar diurnal (O1), and the luni-solar diurnal (K1) frequencies.)

De-Tiding Using a Tidal Model

Velocity Color Plot Velocity Color Plot

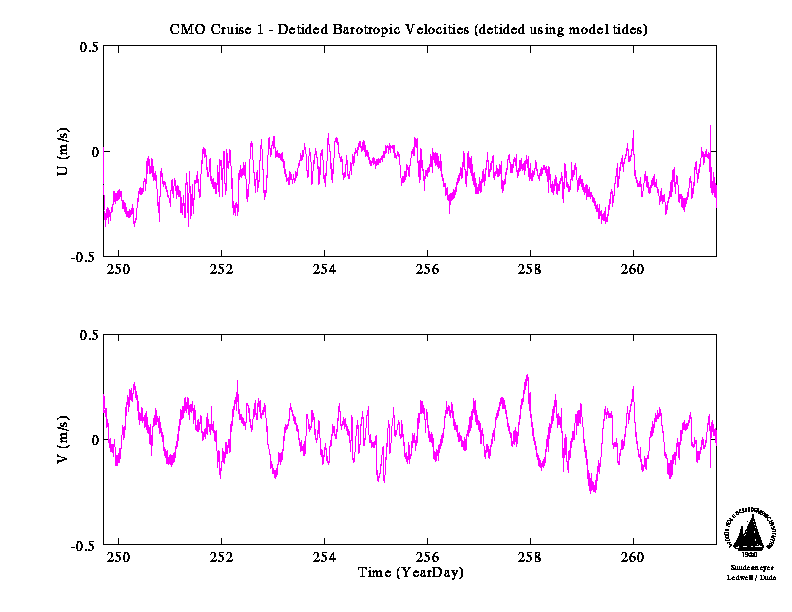
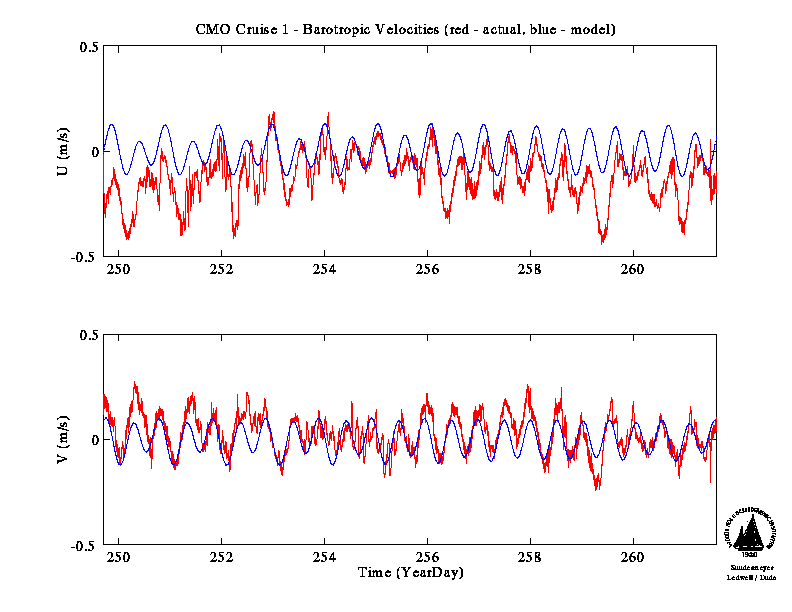
A first pass at de-tiding was done using predictions from a tidal model provided by Jim Irish. The predictions are based on harmonic analysis of moored current meter data at Station P (near Nantucket Shoals; using VACM for currents; Moody et al., 1980). Observed barotropic velocities together with the tidal model prediction are shown to the right. Also shown are the residual velocities after using the predictions to de-tide the data. This simple approach to de-tiding is especially useful for nearly real-time analysis at sea, particularly for the purpose of monitoring the mean flow which is advecting our dye plume. Unfortunately, however, the approach doesn't work that well, and we must turn to a more robust means of tidal analysis if we wish to say anything quantitative about the tidal verses non-tidal velocities in our data set.

Harmonic Analysis and Candela's Method

A useful extension of harmonic tidal analysis, which permits the amplitudes of the harmonic constituents to be functions of space, was suggested by Candela et. al (1992). In brief, the raw time series of barotropic velocity is expressed as a linear superposition of a mean flow plus some combination of time periodic flows whos frequencies are assumed known, say, the diurnal and semi-diurnal tides. The unknown amplitudes of each of these constituents is approximated using some particular horizontal structure functions (commonly polynomials or Greens functions are used; e.g., Candela et al., 1992; Harris et al., 1995; Forman and Freeland, 1991; Chen, 1992). Conventional least squares methods are then used to determine a "best fit" solution for the set of amplitude coefficients.

Based on the simple barotropic velocity spectra computed above, it appears that diurnal and semidiurnal frequencies contribute significantly to the variance in the observations. Kinetic energy spectra computed from moored current meters in the Nantucket Shoals Flux Experiment (NSFE) (Beardsley et al., 1985) support this conclusion both for summer and winter stratification conditions. Visual inspection of the time series plotted above further reveals a fortnightly signal in both the zonal and meridional components. Based on these considerations, we include the following tidal constituents in our harmonic analysis: M2, S2, O1, K1.

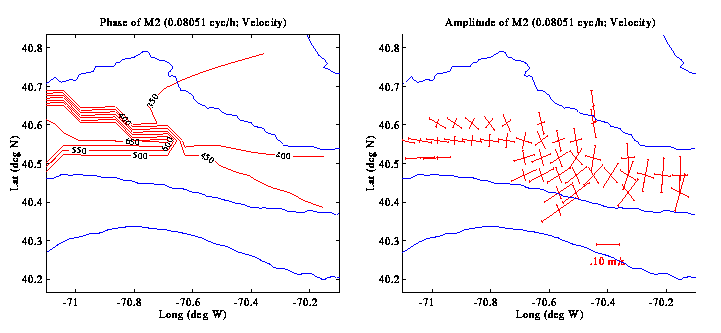
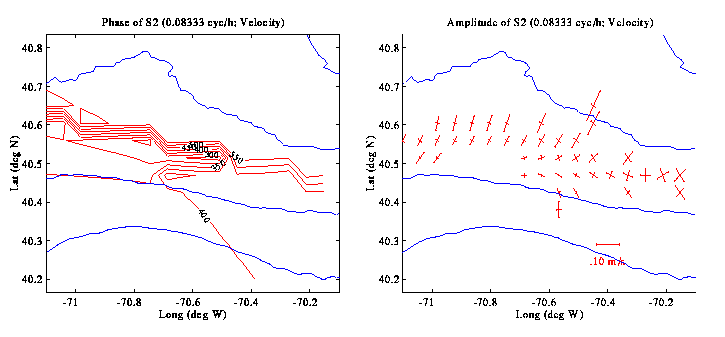
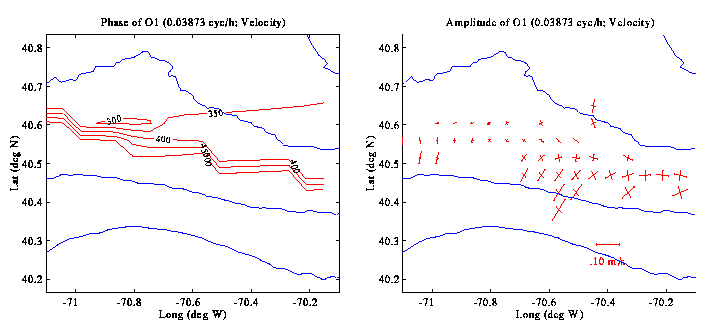
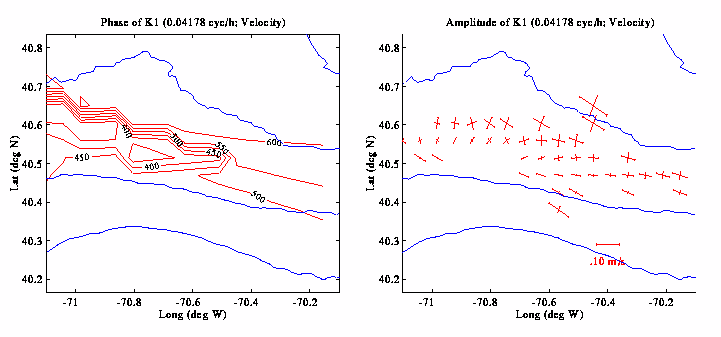
Tidal ellipses published by Moody et al. (1980) show that none of these tidal constituents are significantly polarized in our region of interest. Cotidal charts further show that the phase of the M2 tide varies by approximately 30 degrees / 100 km in the along-shelf direction, while the S2 varies perhaps a little faster, at about 50 degrees / 100 km; the O1 and K1 both vary slowly at no more than 10 degrees / 100 km. For all of these constituents, phase changes in the cross-shelf direction are either insignificant or unresolved. Given the size of our ADCP survey region, we do not expect to resolve spatial changes in phase, except possible for the M2 and S2 in the along-shelf direction. For this reason, and for the sake of simplicity, we use low-order polynomials as our spatial structure functions for the harmonics as well as the mean flow. Below we discuss results for 0th order polynomial fits (which is just Candela's method degenerated back to traditional harmonic analysis) and 1st order polynomial fits.
Zero Order Polynomial Fit

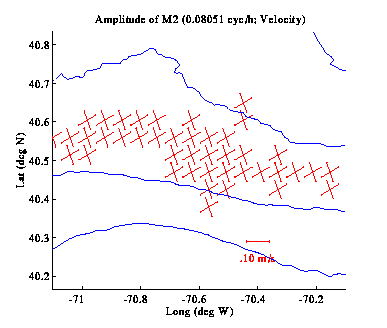
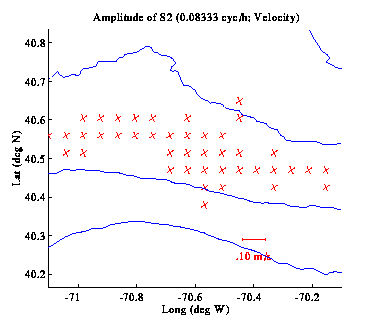
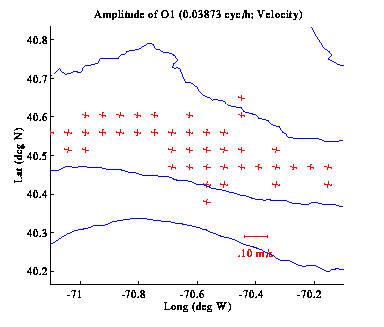
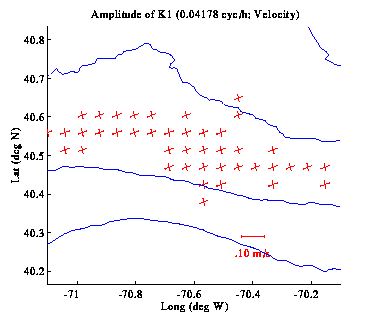
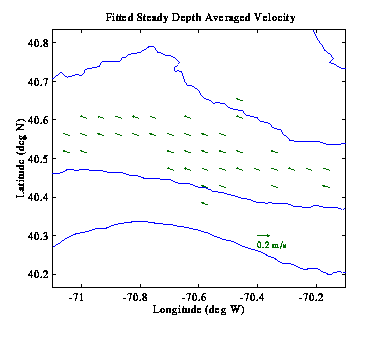
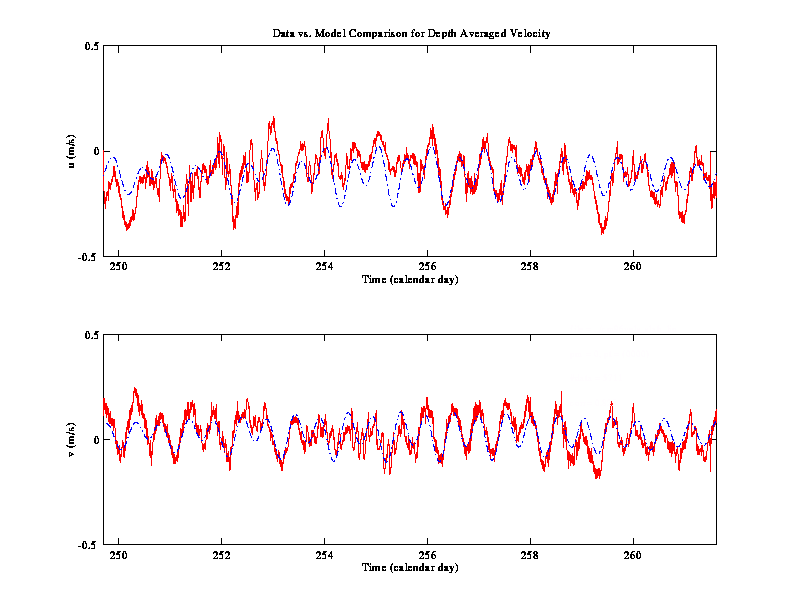
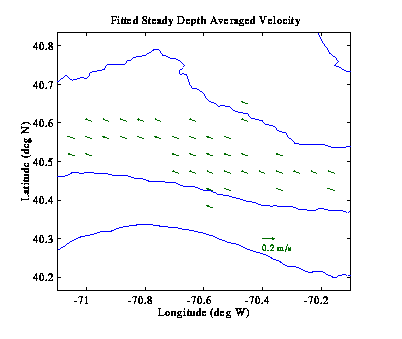
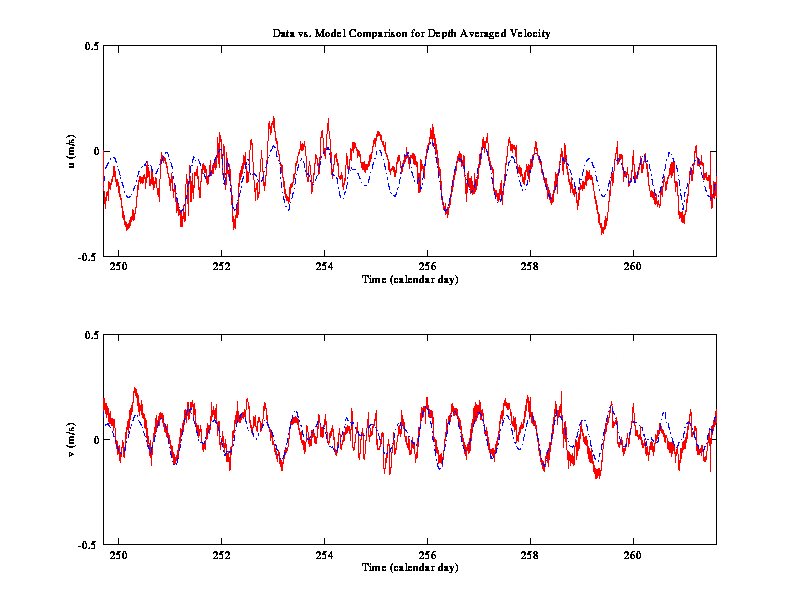
Tides & Mean: As a first pass using Candela et. al 's (1992) method of analysis, we use 0th order polynomials to fit each of the harmonic constituents and the mean flow. The principle axes for the fitted M2, S2, O1, and K1 constituents are shown to the right; in this fit the phase is constant over the region. M2 velocities are approximately 10 cm/s, while S2, O1, and K1 velocities are all around 5 cm/s. These amplitudes are roughly consistent with tidal charts by Moody et al. (1980), with the exception that we under-estimate the along-shelf amplitude of the K1 by as much as 5 cm/s.

The mean flow is also shown, as are time series of the data and the best fit solution. Together, the fitted constituents account for a total of about 47% and 53% of the variance in the zonal and meridional velocities, respectively.

Velocity Color Plot Velocity Color Plot

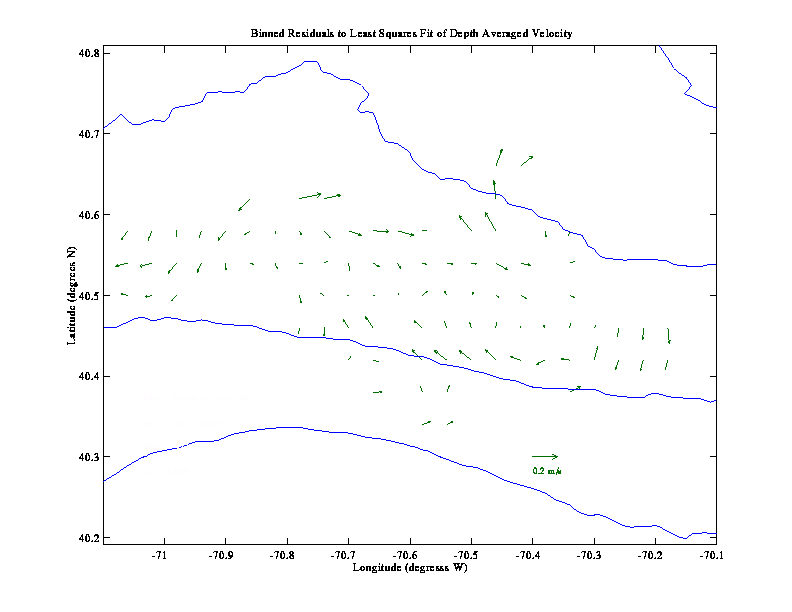
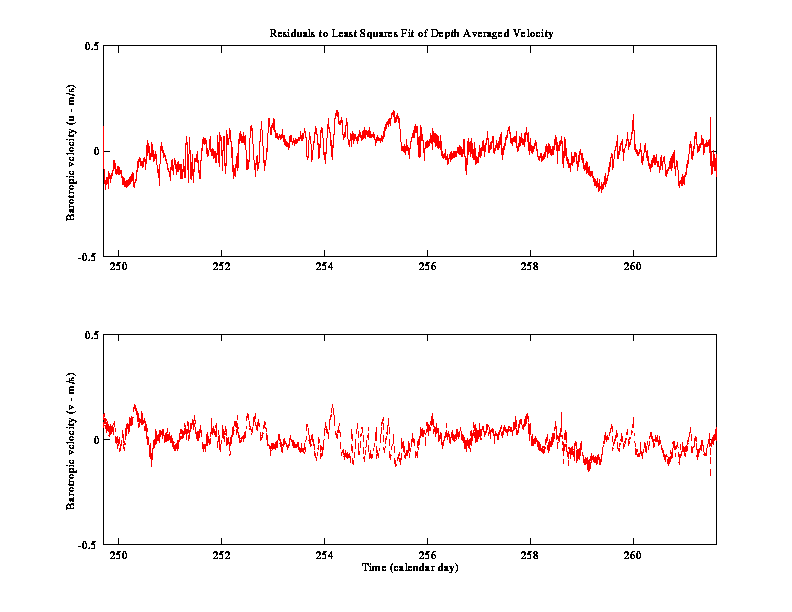
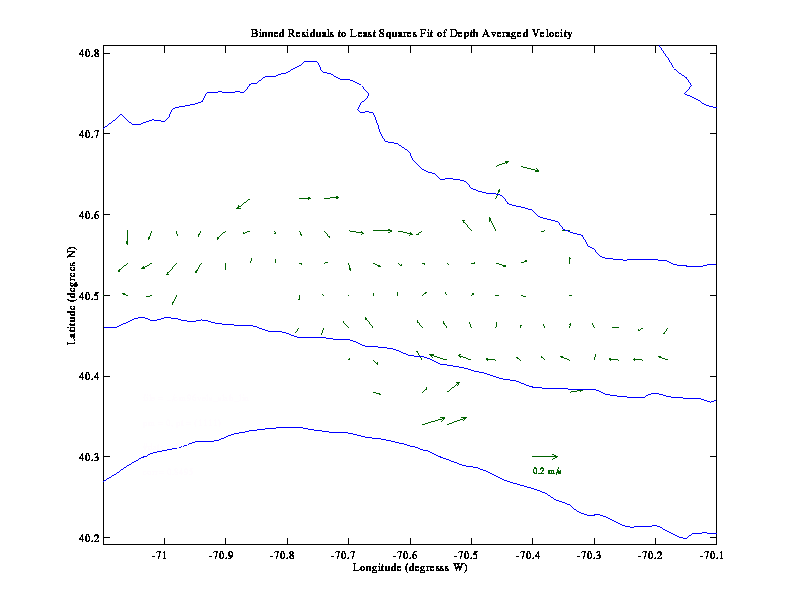
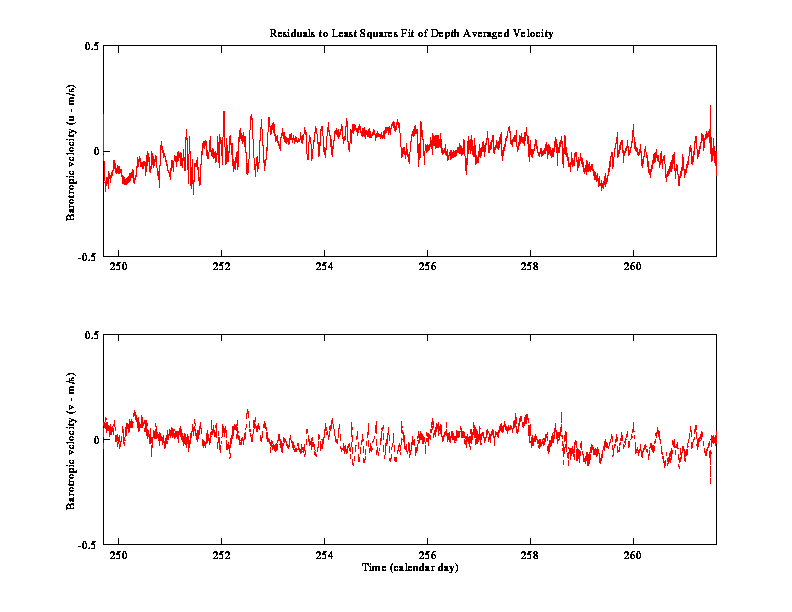
Residuals: The time series of the residuals to the 0th order polynomial fit are plotted to the right. In order to reveal any spatial structure, we also plot these residuals as current vectors. In doing so, we implicitly assume that the residuals are primarily a function of space rather than time, and hence it makes sense to bin them spatially. Under this assumption, we can think of this vector plot, if it is coherent, as revealing the spatial structure of the mean flow. Indeed we do see a fairly coherent flow, which is suggestive of a jet structure in the along-shelf direction. Amplitudes of the residual range from about 20 cm/s westward along the deeper isobaths to 20 cm/s eastward further inshore. This jet-like structure was also be seen in individual cross-shelf transects during our cruise, and hence we believe it is a real feature of the flow for this time period.

First Order Polynomial Fit

Tides & Mean: A second fit was performed using 1st order polynomials for the tidal constituents, while retaining a 0th order polynomial for the mean flow. The principle axes for the M2, S2, O1, and K1 constituents are shown below, along with their respective phase charts (note, the phase here has not been normalized or referenced to any particular standard). The principle axes show significant variability over the scale of our survey for all of these constituents with amplitudes ranging from as low as 2 cm/s to 20 cm/s in any one constituent. Phases vary rapidly in both the along- and cross-shelf direction, as do the orientations of the principle axes. The mean flow is also shown below, along with time series of the data and the best fit solution. The fitted mean flow remains about 20 cm/s along-shelf to the west. The amount of variance accounted for by this fit has increased slightly over the 0th order polynomial fit to 53% and 66% for the zonal and meridional components, respectively.

Velocity Color Plot Velocity Color Plot

Velocity Color Plot Velocity Color Plot

Residuals: Time series of the residuals are shown to the right along with the corresponding current vector representation after binning in space. Here we see that despite the higher number of degrees of freedom in this 1st order polynomial fit, a similar spatial structure is visible in the residual as was seen in the 0th order polynomial fit. This supports our belief that the jet-like structure we see in the residuals is indeed a real feature of the flow. (Note, an explicit fit using polynomials to such a narrow jet structure would require more degrees of freedom than would seem appropriate for the size of our domain, and hence is not attempted here.)

Summary

It appears that Candela et al.'s (1992) method provides a reasonable means of extracting tidal information from the mean flow in our data. However, given the scale of our ADCP survey, we cannot resolve changes in phase and amplitude of the major tidal constituents, and hence no more than a 0th order polynomial fit (i.e., traditional harmonic analysis) seems appropriate.

The amplitudes of the principle axes of the 0th order polynomial fit are generally consistent with results of Moody et al. (1980). The residuals to the 0th order fit, or equivalently, the de-tided, de-meaned velocities, show a jet-like structure with a maximum westward velocity along the offshore edge of the survey region. This jet was also seen in individual ADCP transects during our cruise, and hence it is believed to be real.

References

Candela, J., R. C. Beardsley, and R. Limeburner, 1992. Separation of Tidal and Subtidal Currents in Ship-mounted Acoustic Doppler Current Profiler Observations. J. Geophys. Res., 97(C1), 7 69-788.

Chen, C., 1992. Variability of Current in Great South Channel and Over Georges Bank: Observation and Modeling. Ph.D Thesis, MIT/WHOI Joint Program, WHOI-92-20, 288 pp.

Foreman, M. G. G., and H. J. Freeland, 1991. A Comparison of Techniques for Tide Removal from Ship-Mounted Acoustic Doppler Measurements along the Southwest Coast of Vancouver Island. J. Geophys. Res., 96(C9), 17,007-17,021.

Harris, C. L., A. J. Plueddemann, R. H. Bourke, M. D. Stone, and R. A. Pawlowicz, 1995. Collection and Processing of Shipboard ADCP Velocities from the Barents Sea Polar Front Experiment. Woods Hole Oceanographic Institution Technical Report WHOI-95-03, 75 pp.

Moody, J.A. and B. Butman, 1980. Semidiurnal bottom pressure and tidal currents on Georges Bank and in the Mid-Atlantic Bight. USGS Open-File Report 80-1137, 22 pg.

This page originally written February 5, 1997; Last updated August 5, 2002 -- msundermeyer@whoi.edu