|
Coastal Mixing & Optics (CMO) Dye Studies
|
Investigators:
|
J.R. Ledwell, T.F. Duda, H.E. Seim, M.A. Sundermeyer
|
|
Grant Title:
|
Tracer Studies of Mixing in Stratified Coastal Waters
|
|
Funding Agency:
|
Office of Naval Research
|
|
Performance Period:
|
2/01/95-1/31/00
|
|
Award:
|
$965,065
|
Project Background
A study of stirring and mixing in density-stratified
waters on the continental shelf was conducted as part of the ONR funded
Coastal Mixing and Optics Experiment. Fluorescent dye and drogues
were released, and their subsequent dispersion measured to determine
rates of diapycnal diffusion, lateral dispersion, and lateral homogenization
over 3 to 5 day periods.
Temperature and conductivity were measured simultaneously with
the dye at 2 cm resolution along with the dye measurements from a towed
body in order to characterize the spatial scale of patches of enhanced
gradients. Dissipation rates of temperature variance were inferred
from these measurements and compared with the diapycnal diffusivity
estimated from the dye dispersion in order to test the Osborn-Cox relation
proposed between the two. Shear was also measured by shipborne ADCP
throughout the experiment at 2 m resolution.
Dissipation rates of temperature variance and of turbulent
kinetic energy were measured directly by profiler deployments in work
proposed separately by Neil Oakey of Bedford Institute of Oceanography,
on alternate watches with the dye surveys to test the Osborn-Cox relation,
as well as the relation between diapycnal diffusion and kinetic energy
dissipation proposed by Osborn. Detailed hydrographic measurements and
measurements of the Reynolds stress and an approximation of the heat flux
were made continuously throughout the experiment from a tripod-based
array of instruments by Trowbridge and Williams. These experiments
were further embedded in the mooring array proposed by Lentz, et al.,
which provided a 9 month time series of the meteorological forcing and
of the current field on 30 km scale, with 5 m vertical resolution.
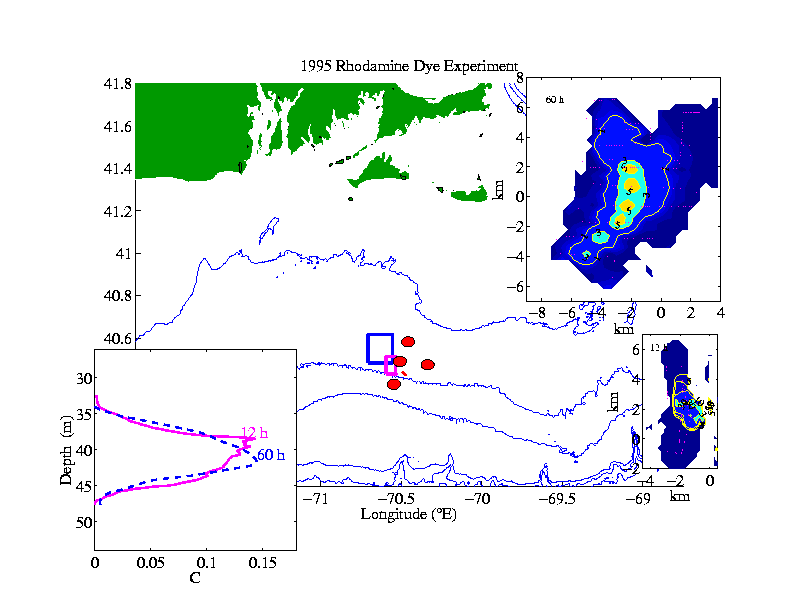
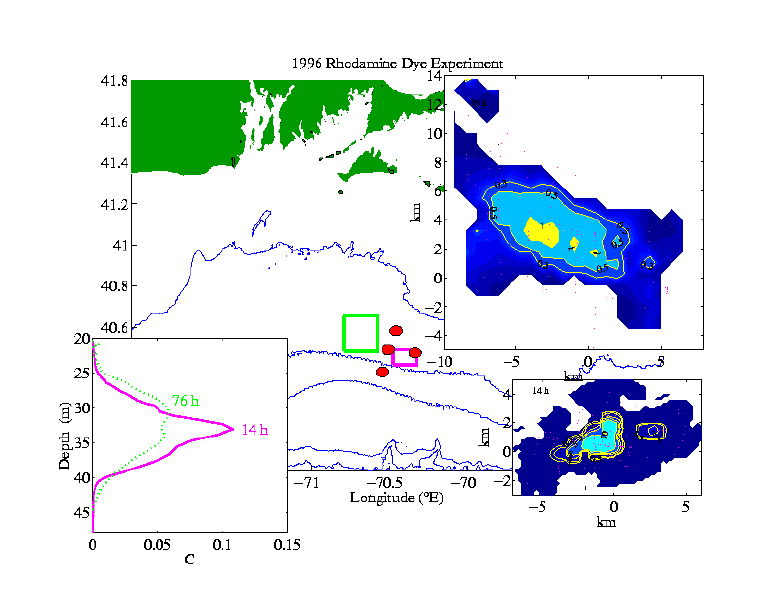
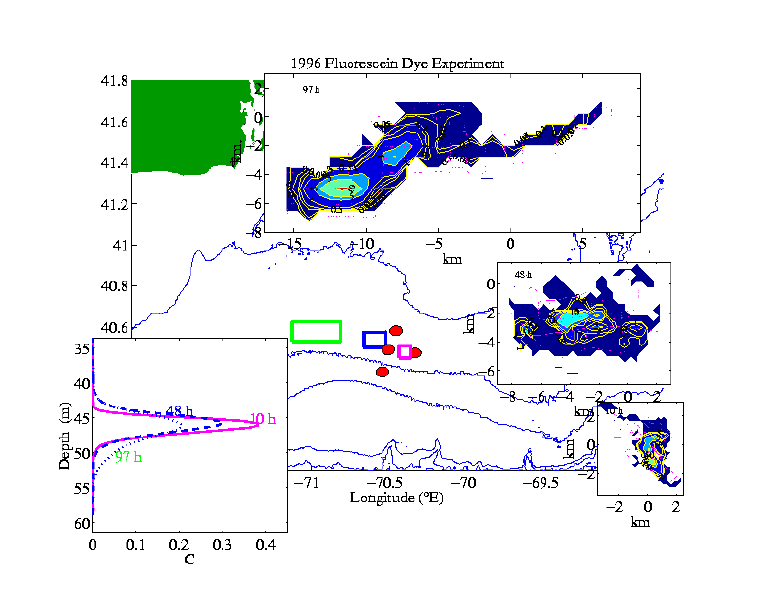
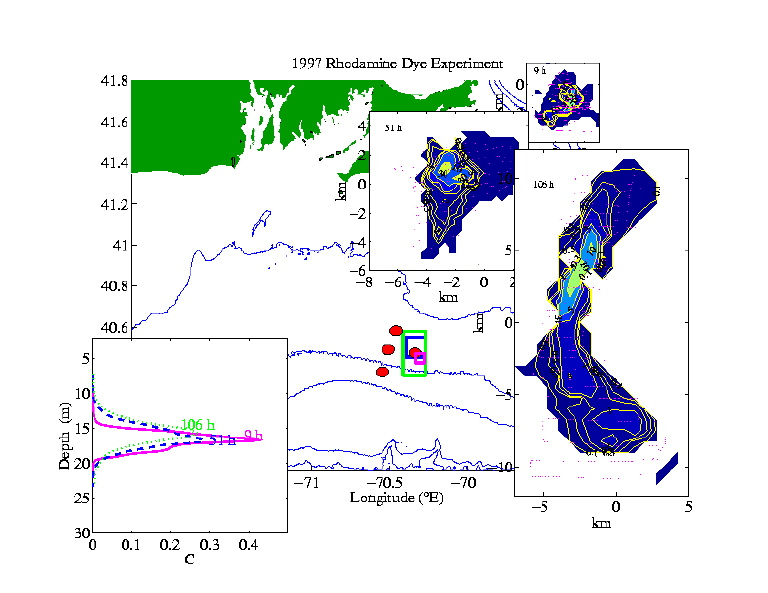
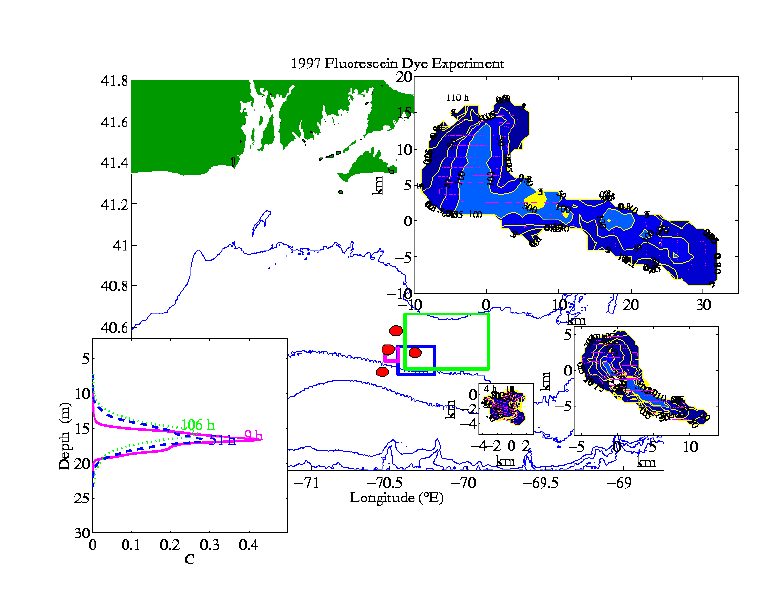
Dye-Release Experiments
Fluorescent dye and drogues were released in order to determine rates
of diapycnal diffusion, lateral dispersion, and lateral homogenization over
3 to 5 day periods. Five releases were performed in late summer when a
pycnocline was well established. Four of these were at mid-depths and
the fifth just above the bottom boundary layer (see table and figures
below).
| - |
dates |
dye |
injection lat, lon |
target density
(kg/m3) |
target depth
(m) |
sampling
surveys |
| experiment 1 |
Sept 1995 |
rhodamine |
40.44 N, 70.49 W |
25.20 |
40 |
2 |
| experiment 2 |
Sept 1996 |
rhodamine |
40.46 N, 70.32 W |
24.063 |
35 |
3 |
| experiment 3 |
Sept 1996 |
fluorescein |
40.47 N, 70.32 W |
24.30 |
46 |
3 |
| experiment 4 |
Aug 1997 |
rhodamine |
40.48 N, 70.33 W |
24.6 |
18 |
3 |
| experiment 5 |
Aug 1997 |
fluorescein |
40.48 N, 70.49 W |
26.14 |
62 |
3 |
The study site was approximately 100 km south of Martha's Vineyard, MA
in the region known as the "mud patch" (see figures).
For each experiment, a single streak of dye was released along an isopycnal
surface using a towed injection system.
Along with the dye, three to six drogues were also released at
the target depth and tracked via ARGOS transmitters.
The drogue positions were used along with near real-time shipboard
ADCP observations both to assist in locating the dye patch and as an aid to
planning sampling strategies during the dye surveys. ADCP data were also
logged for later analysis.
Subsequent to each dye release, three-dimensional surveys of the dye
patch were conducted using a sampling sled that was tow-yo'd behind the
ship at 2-4 kts. The winch operated at speeds between 30-60 m/min,
which provided a vertical profile every
100-200 m along the ship track. The sampling system included either a
rhodamine or fluorescein fluorometer (depending on the type of dye
released), a chlorophyll fluorometer, and a Seabird CTD. These instruments
sampled at rate of 6 Hz, providing an average vertical resolution of 10 cm.
Hydrographic sections extending across the shelf were
made at the beginning and sometimes the end of each cruise.
These stations provided detailed descriptions of local
conditions and were used to determine where to inject the
dye and to help plan subsequent dye sampling strategies.
Meteorological data were also logged for each of the cruises
using the shipboard Improved Meteorological (IMET) package.
In addition, data were obtained from nearby buoys of the National Oceanic
and Atmospheric Administration / National Data Buoy Center (NOAA / NDBC).
|