|
|
 |
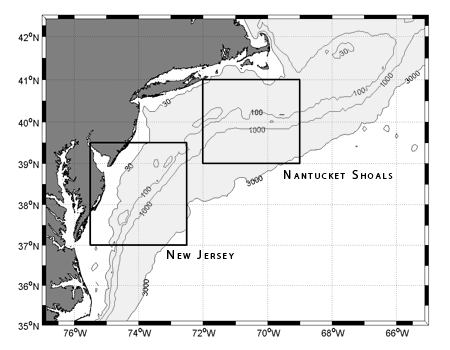 |
Middle Atlantic Bight study area bathymetry
(5 min TerrainBase). The shaded area shows extent of planview
data.
Boxes show New Jersey and Nantucket Shoals cross-shelf study
areas.
|
Science - Middle Atlantic Bight Climatology
<< back
to science index
Collaborators
Glen Gawarkiewicz (WHOI)
Background
The Middle Atlantic Bight (MAB) shelfbreak
front separates the cool, fresh water of the continental shelf
from the warm, saline water of the continental slope. A number
of previous studies have quantified the mean structure and variability
of the Middle Atlantic Bight shelfbreak front [Wright, 1976, Halliwell
and Mooers, 1979, Naimie et al., 1994, Linder
and Gawarkiewicz, 1998]. This study uses a new method to compute
two-dimensional planview climatological fields of temperature
and salinity from Georges Bank to Cape Hatteras.
Data Sources
- Hydrobase2 climatology (collection of raw profile data from
the World Ocean Database 1998 [Levitus et al. 1998], WOCE
Hydrographic Programme, NSIDC (Joint U.S. / Russian Atlas
of the Arctic Ocean), ICES, BarKode (Barents and Kara Seas
Oceanographic Database) and various other sources obtained
by personal communication with the PIs who collected the
data.)
- Shelf-Edge Exchange Processes (SEEP) hydrographic data
- NOAA National Marine Fisheries (NMFS) hydrographic data from 1990-2001 (courtesy Maureen Taylor, NOAA).
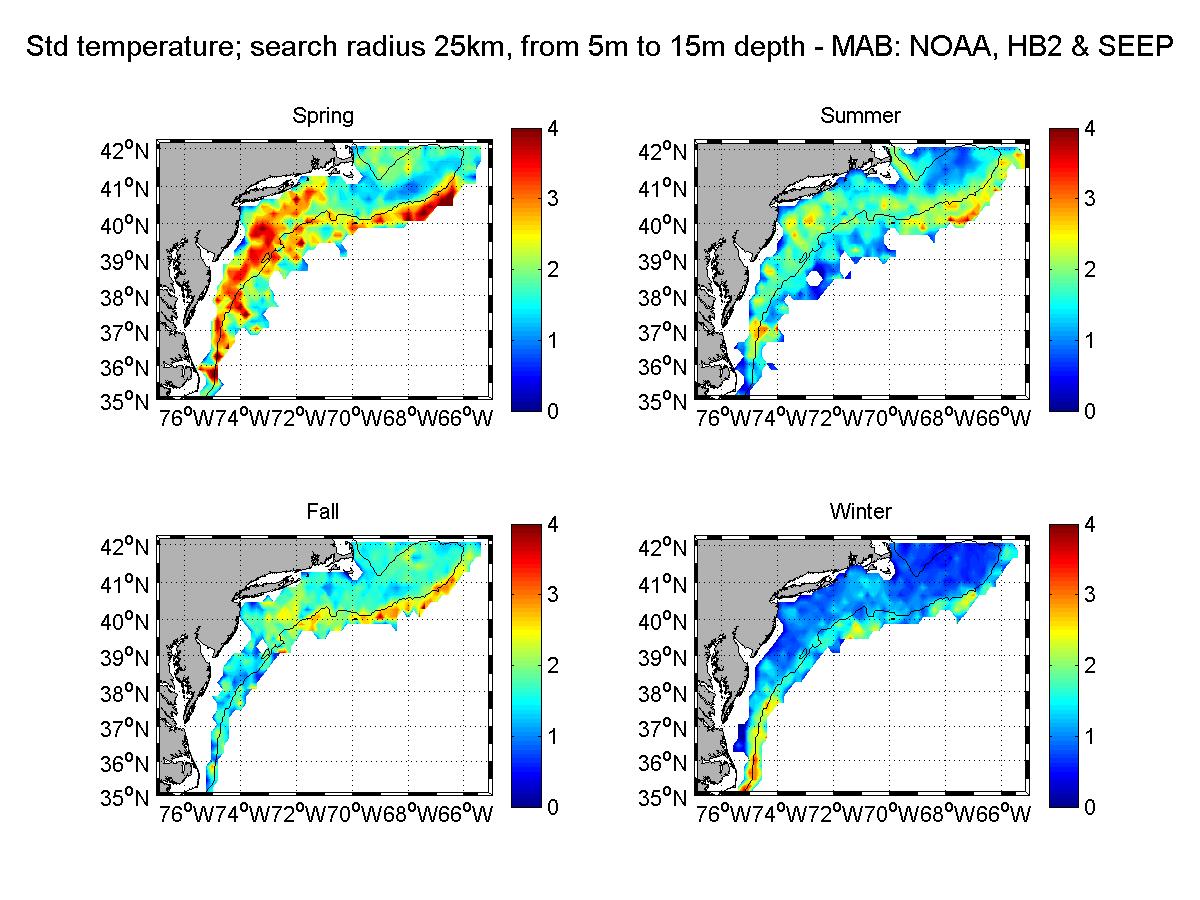
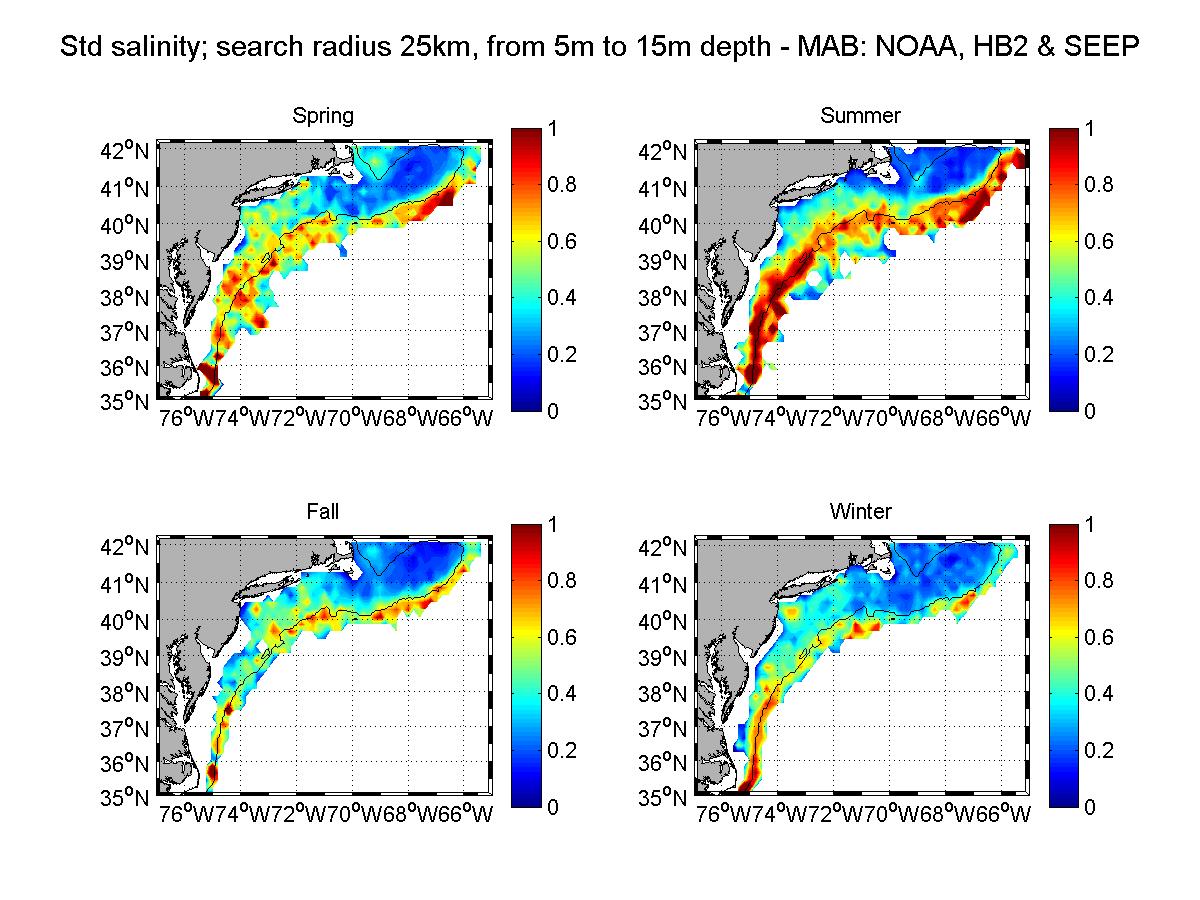
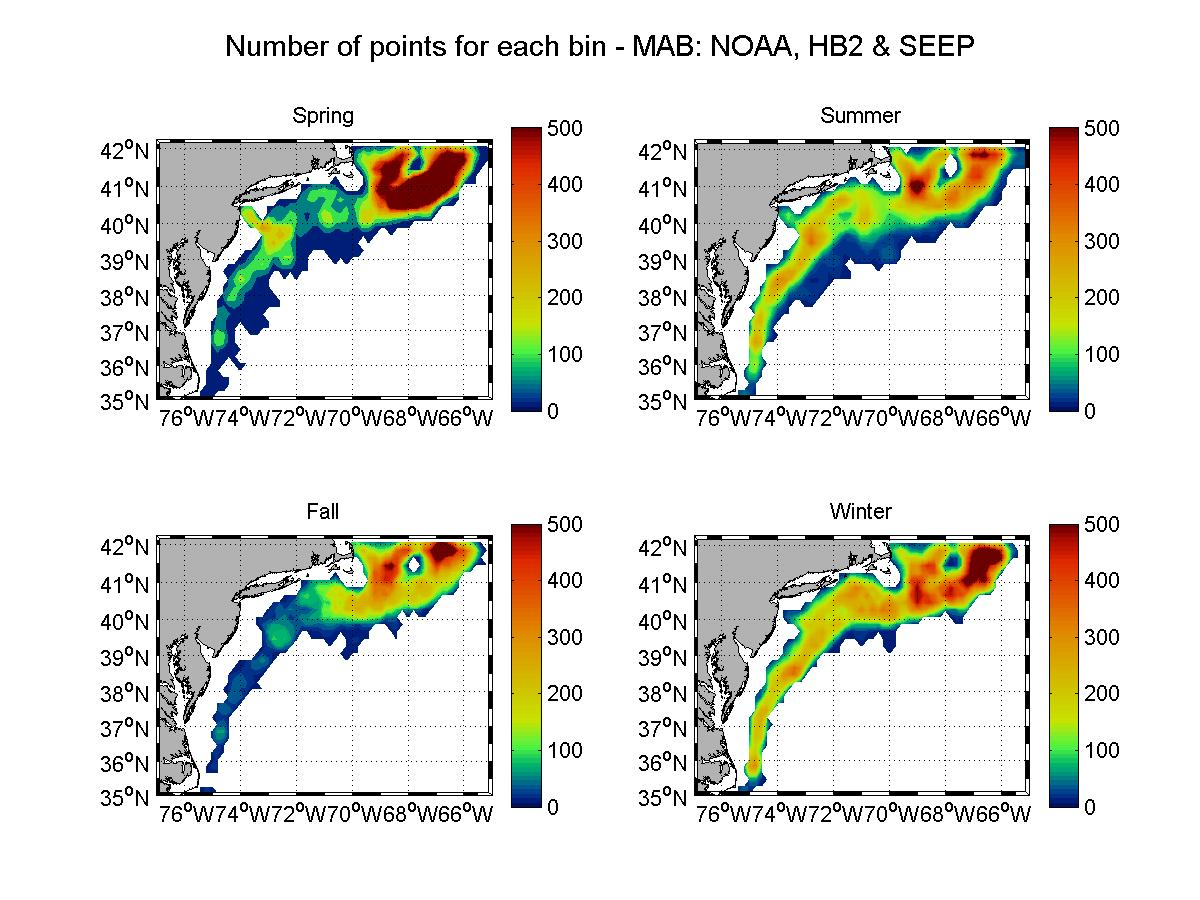
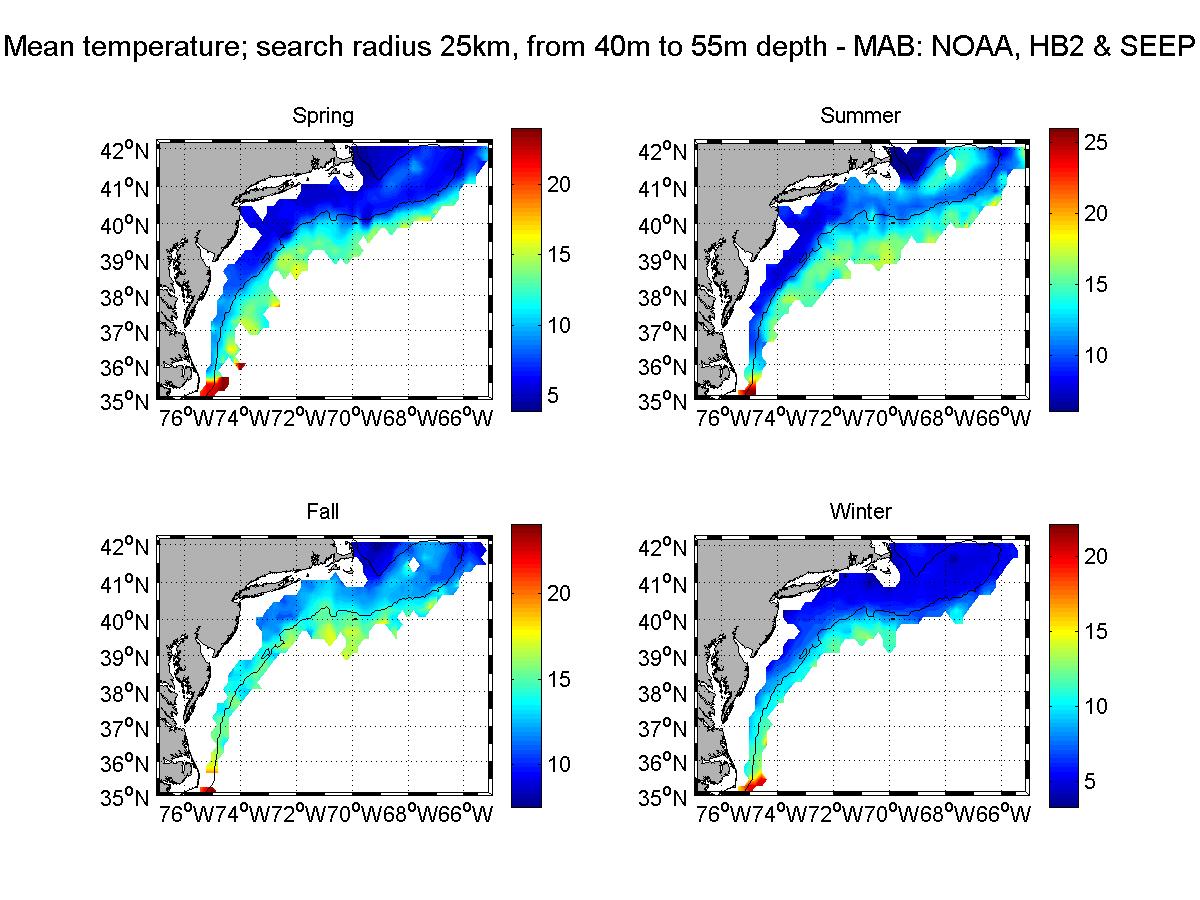
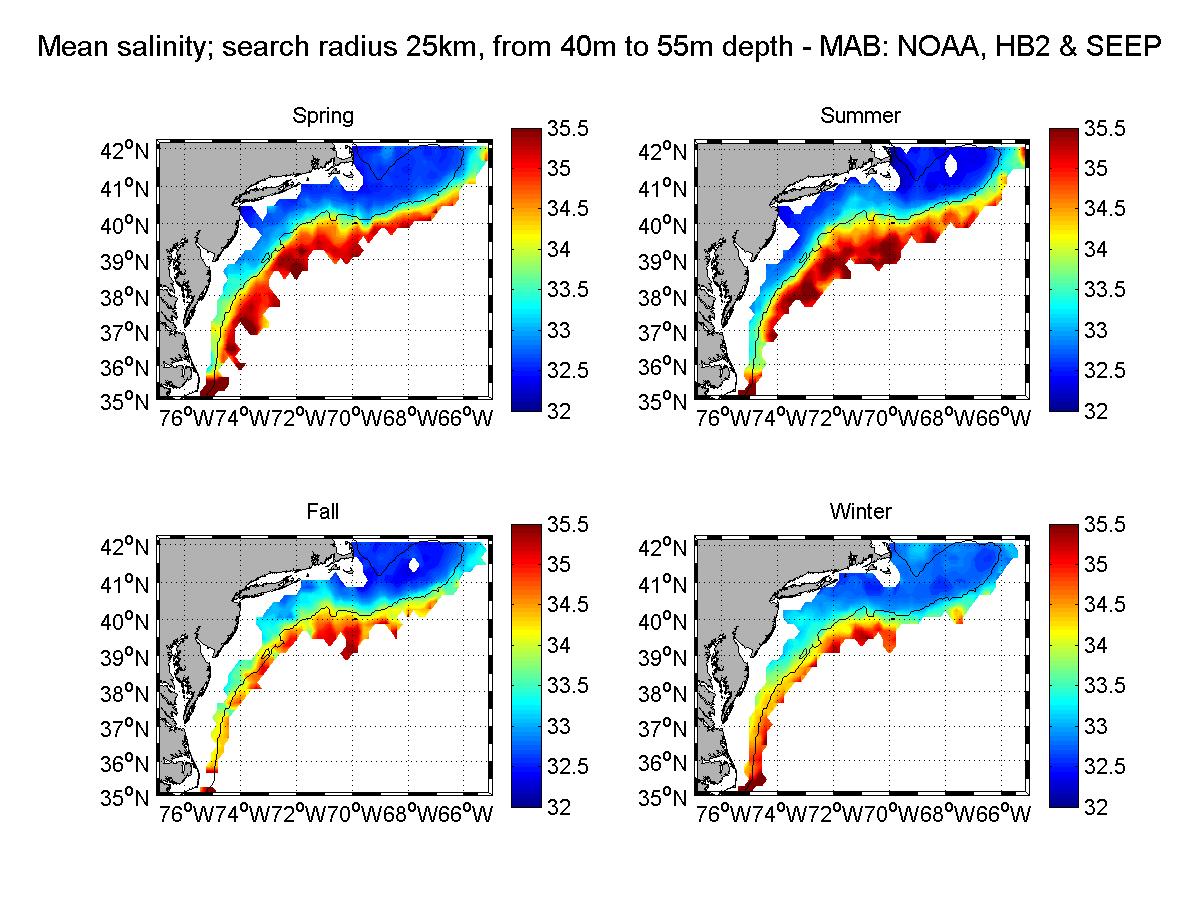
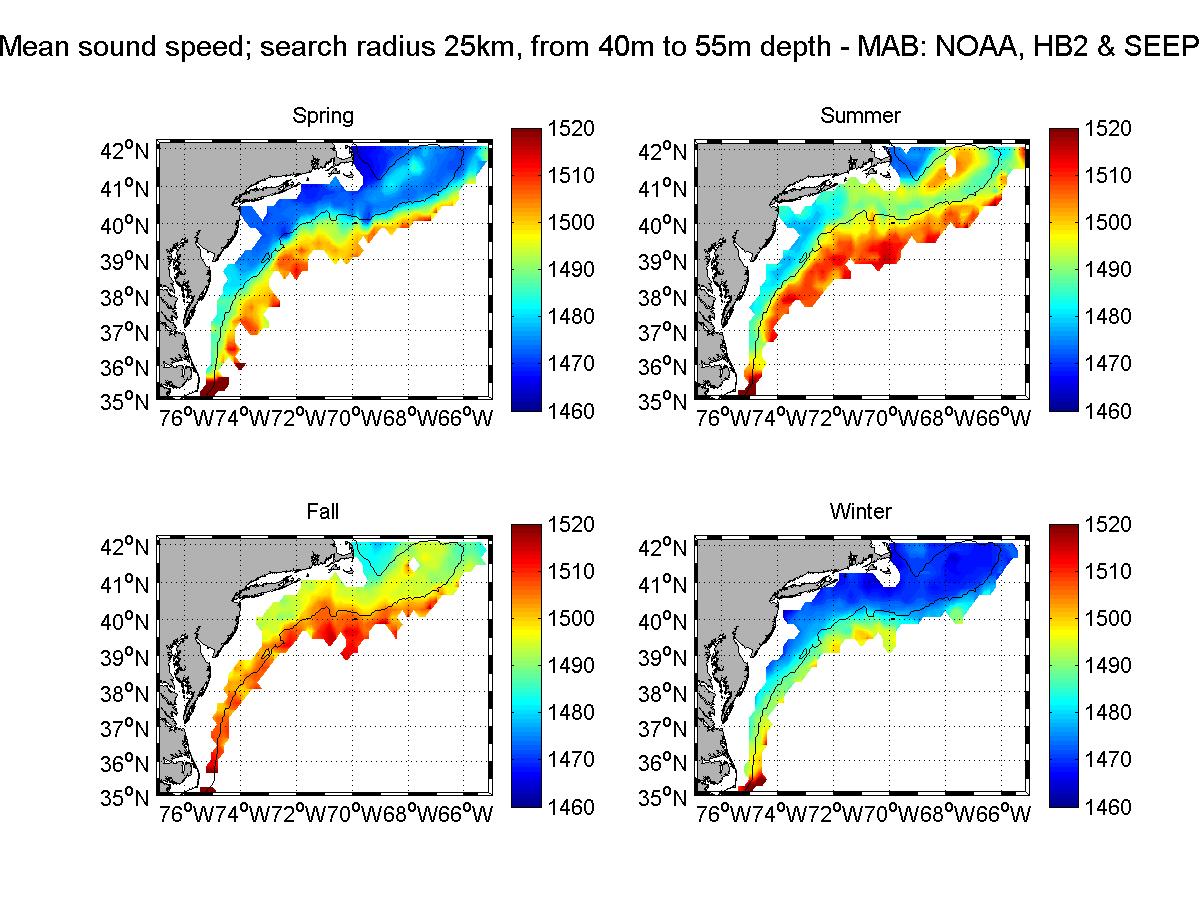
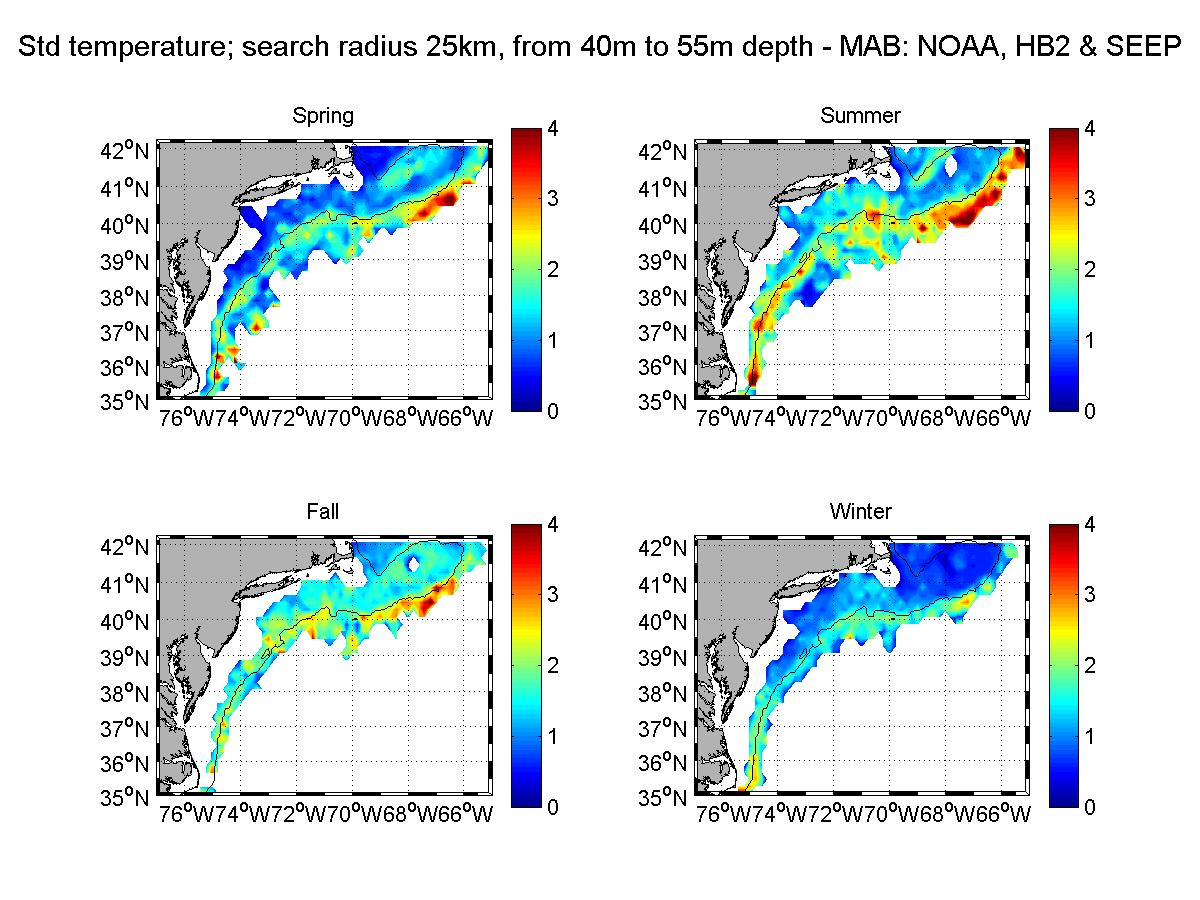
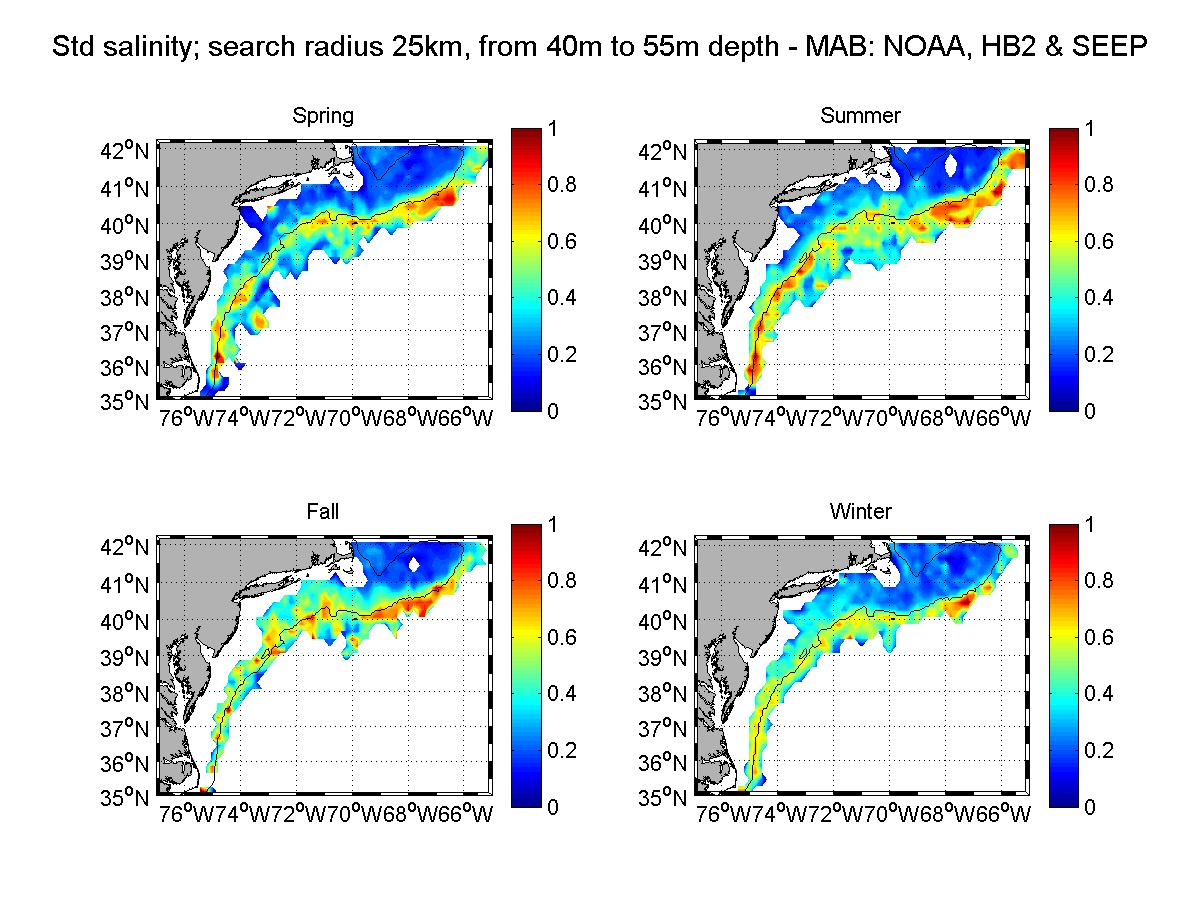
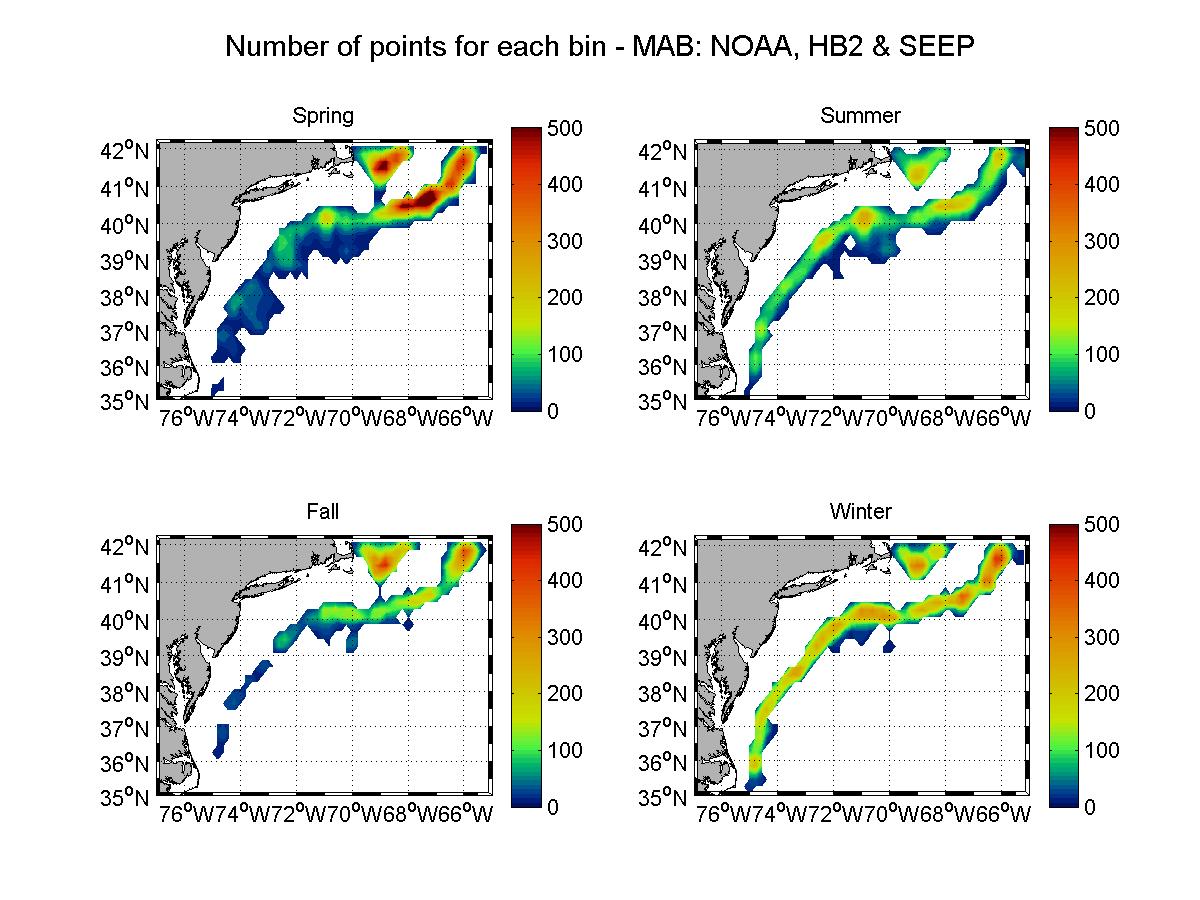
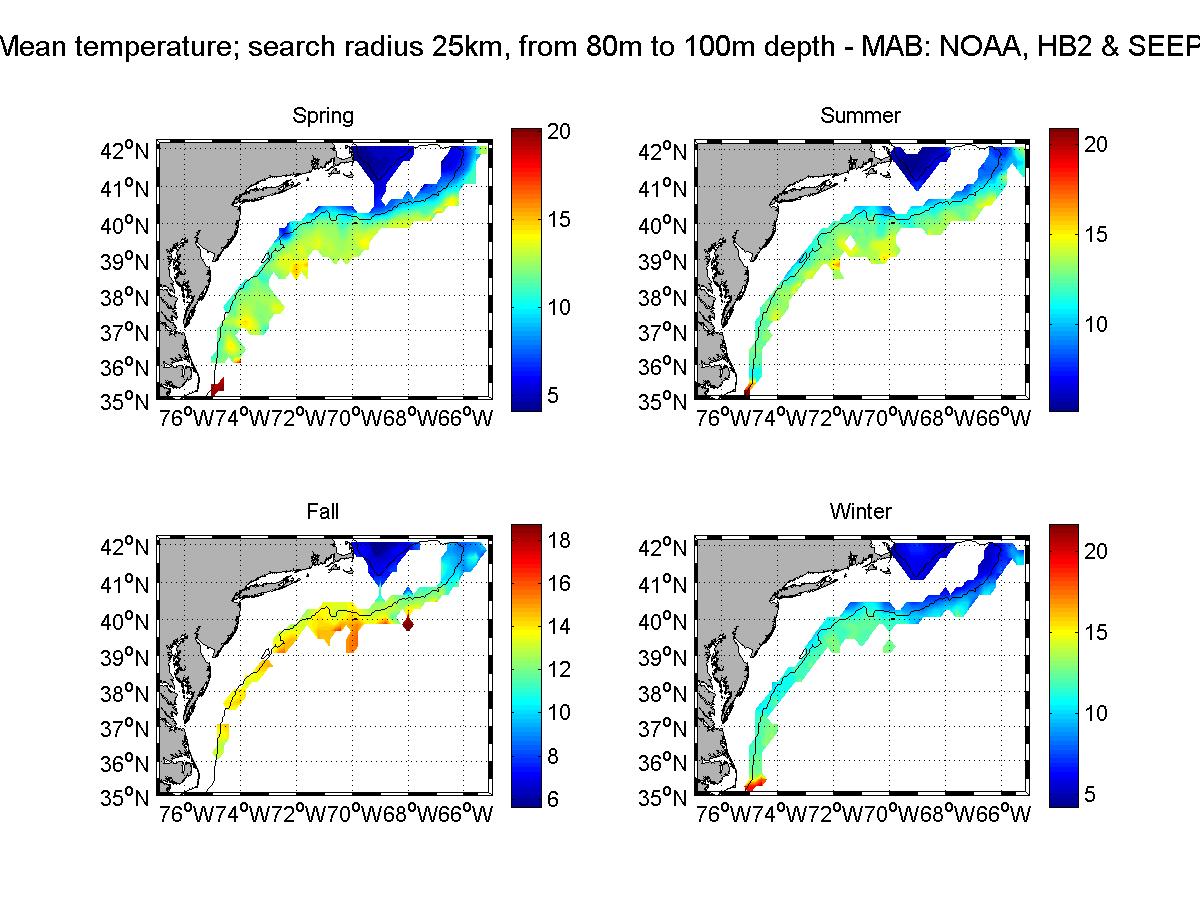
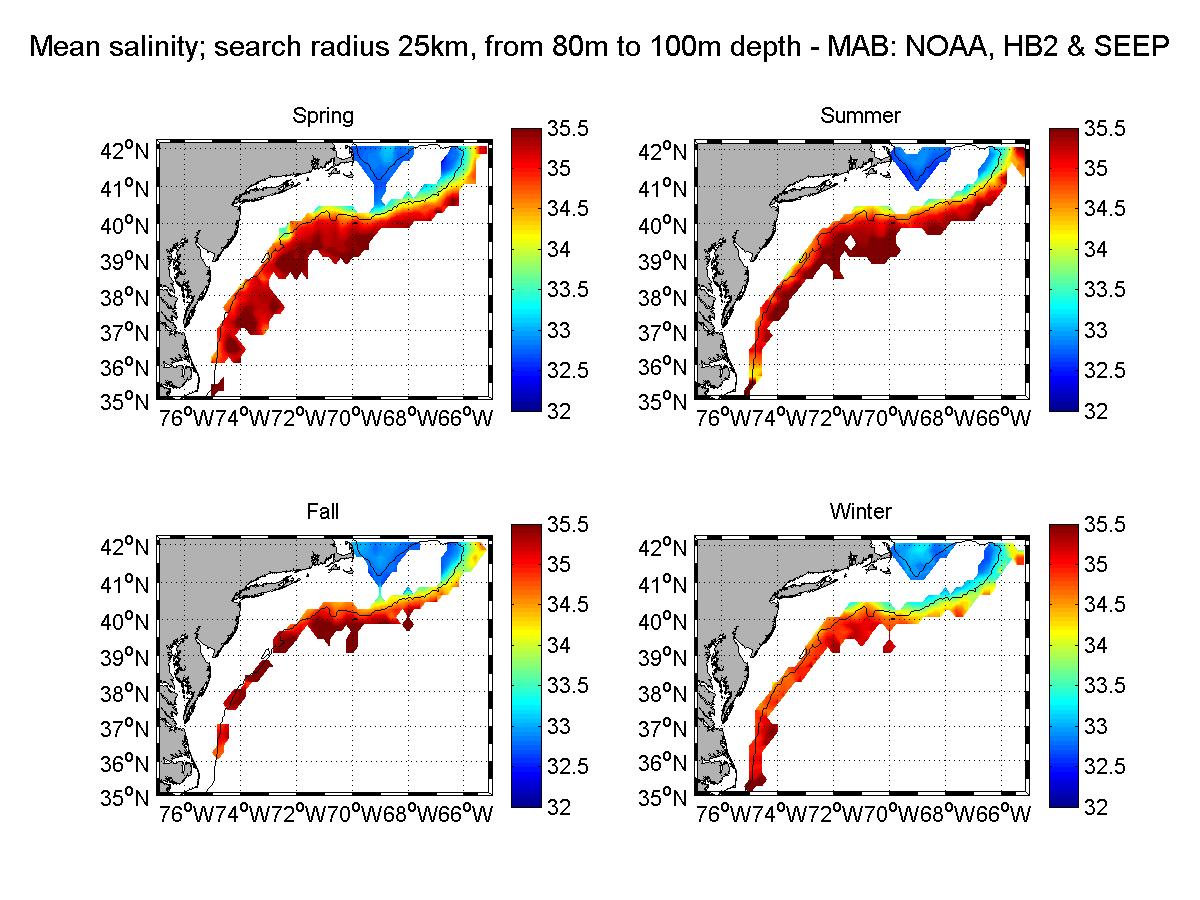
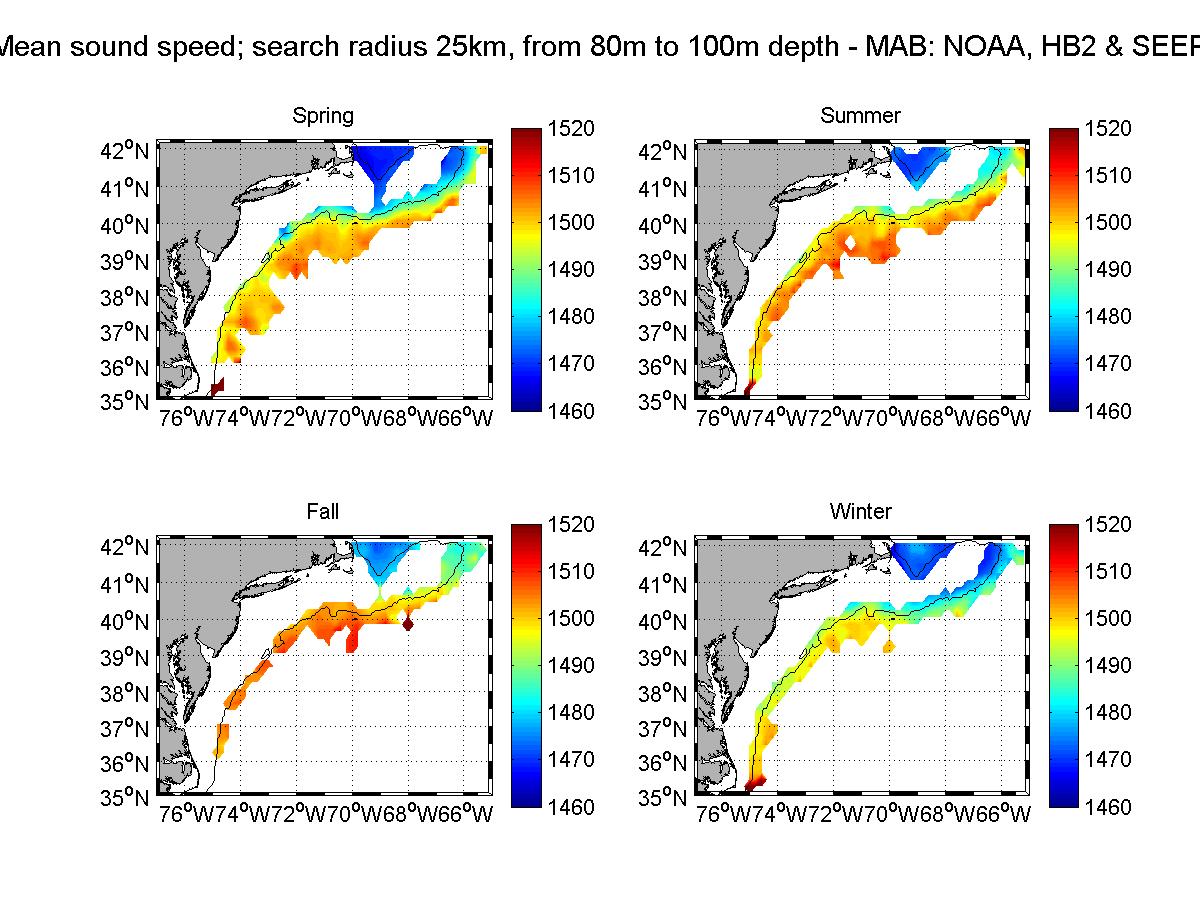
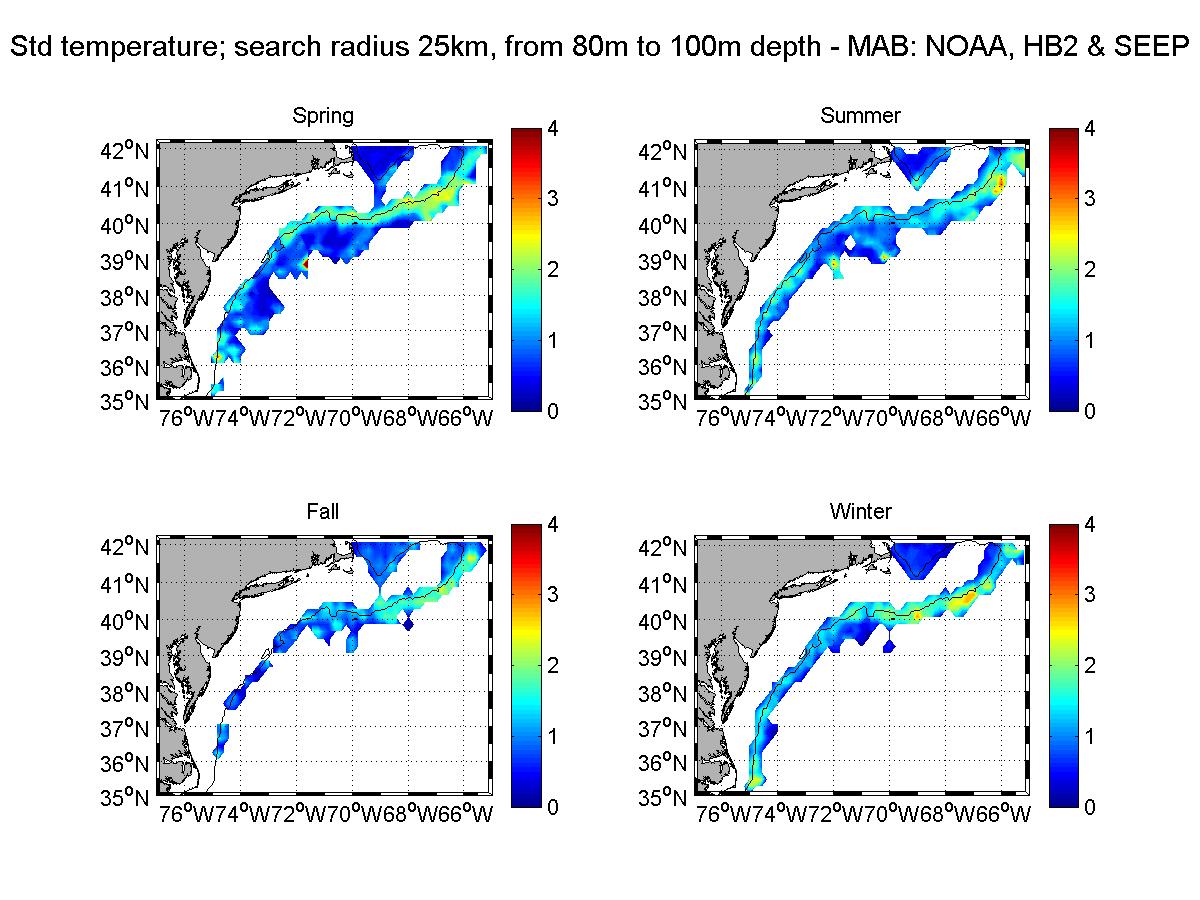
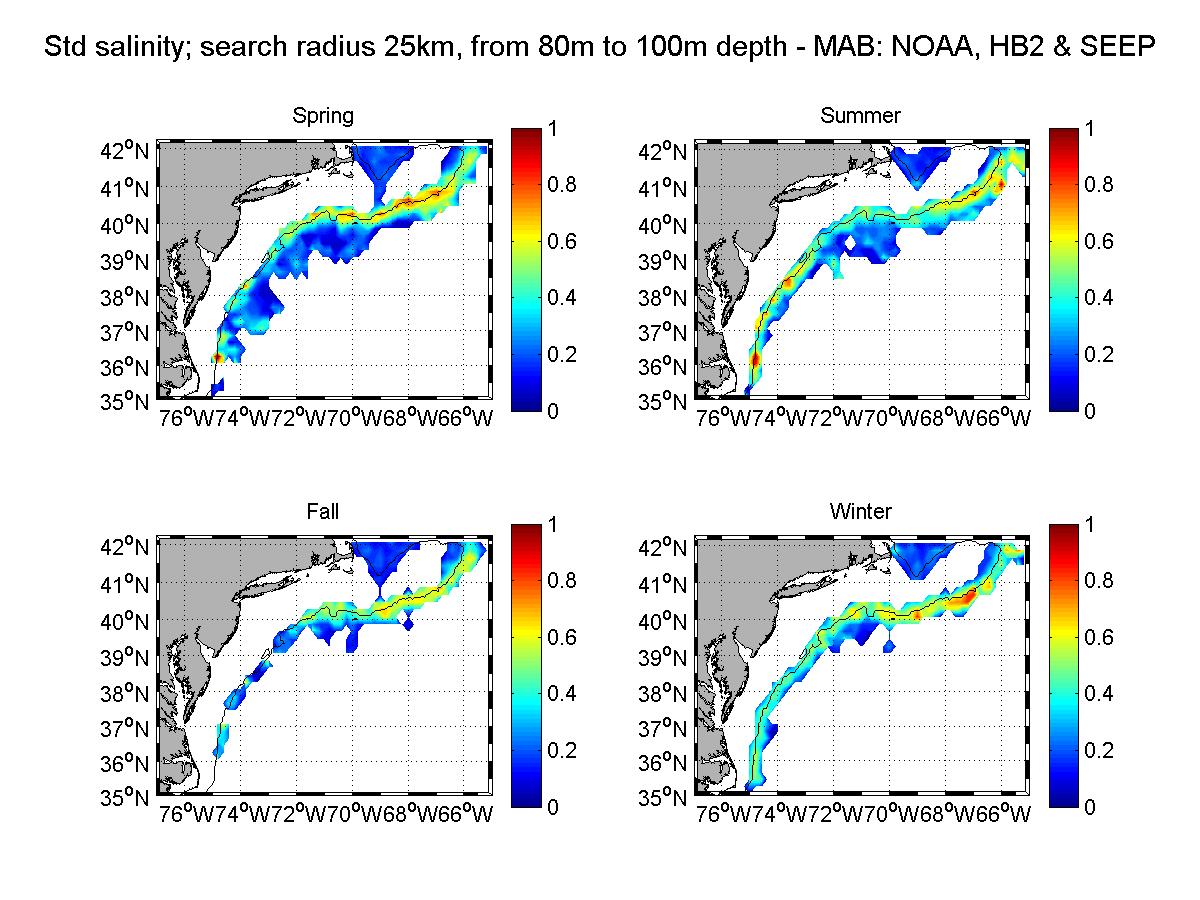
Method - Planview
A regular grid is created in Lat/Lon space with
0.2 degree resolution. The program searches in a radius of 25
km from each grid point to find available profiles. Then, data
points within each profile are selected based on a chosen depth
range. In this project we are studying three key depth ranges:
surface (5-15m), intermediate (40-55m), and shelfbreak (80-100m).
The weighted mean and standard deviation are then computed for
each grid point using a Hamming window filter, which gives more
emphasis to data near the output grid point. Areas for which there
is not sufficient data density are left blank (shown as white
space on plots).
Plots - Planview
The following plots show the data density,
mean & standard deviation of temperature, salinity, and density
for the three depth ranges.
Observations - Planview
The above plots show the mean and standard
deviation of various water properties of the MAB. The shelfbreak
front divides cool, fresh shelf water from warm, salty slope
water.
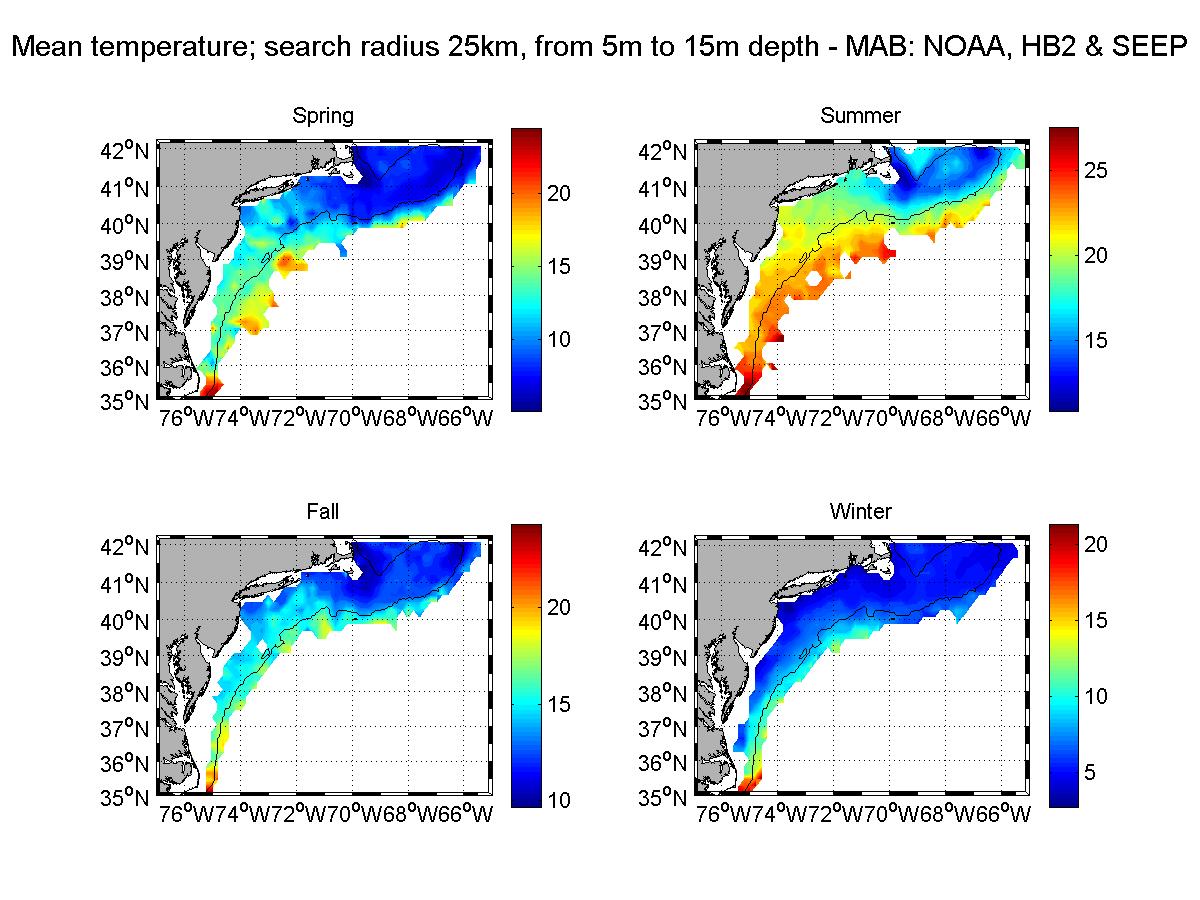
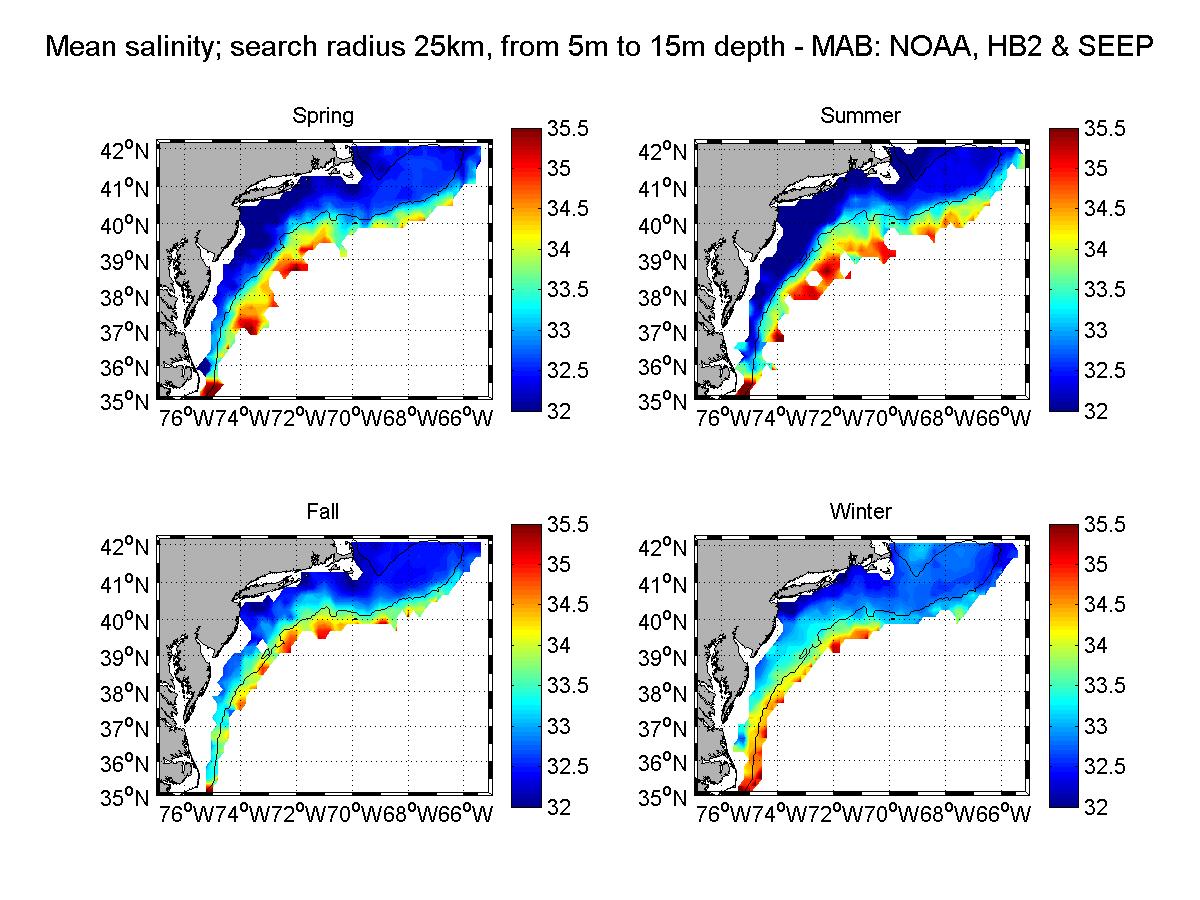
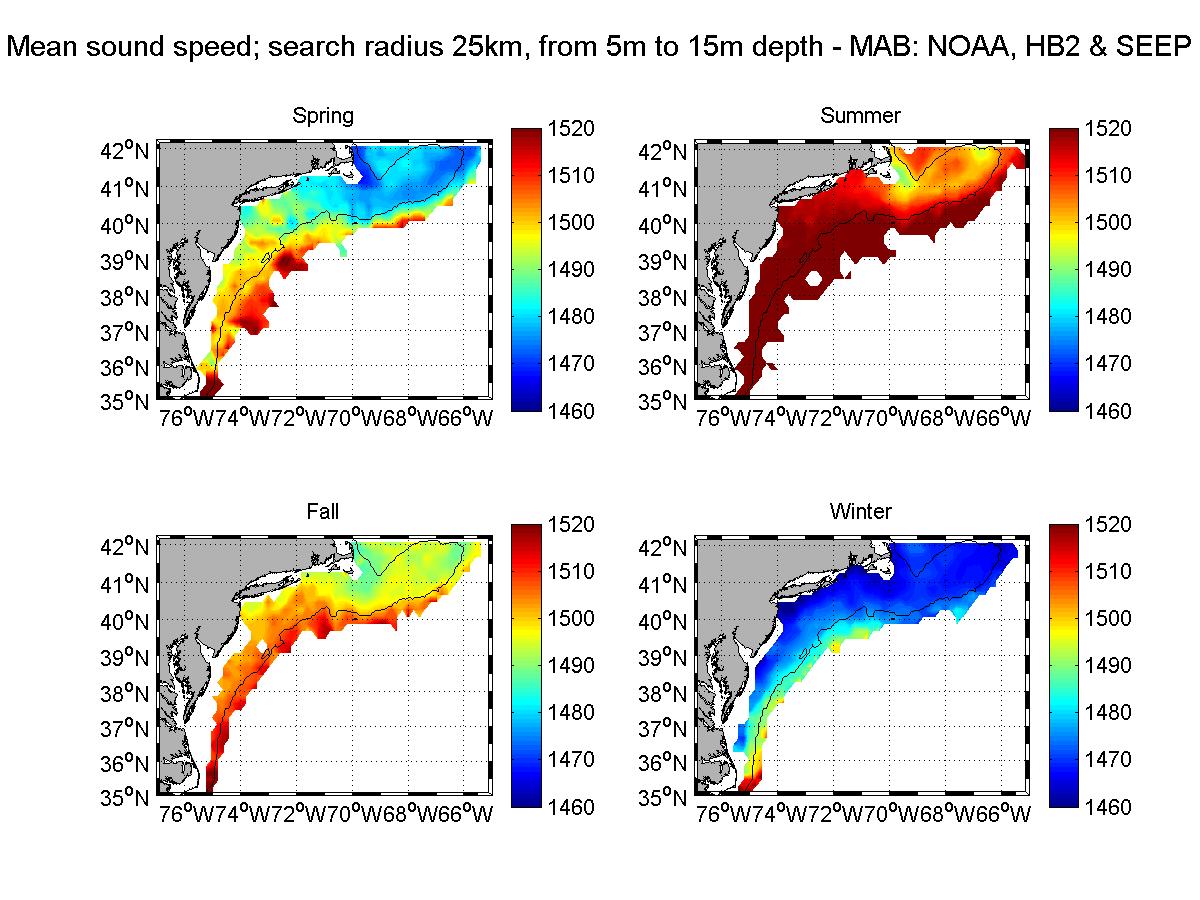
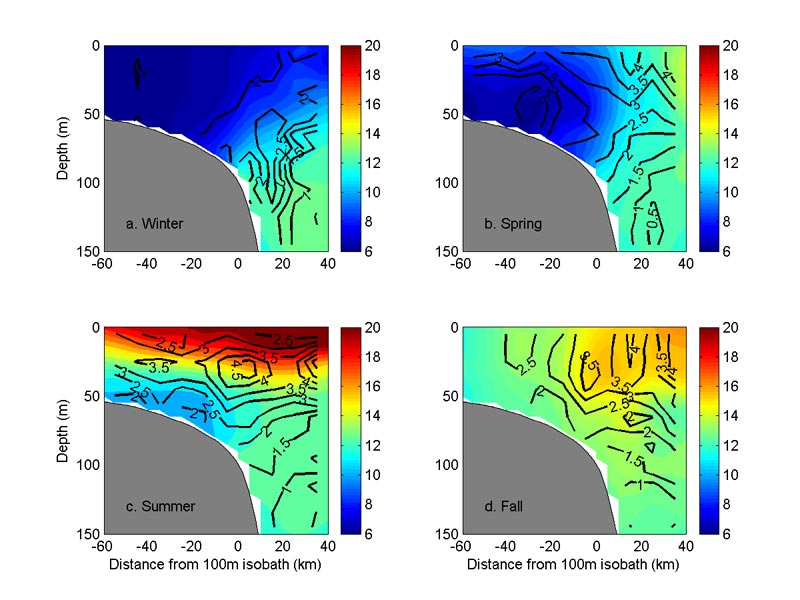
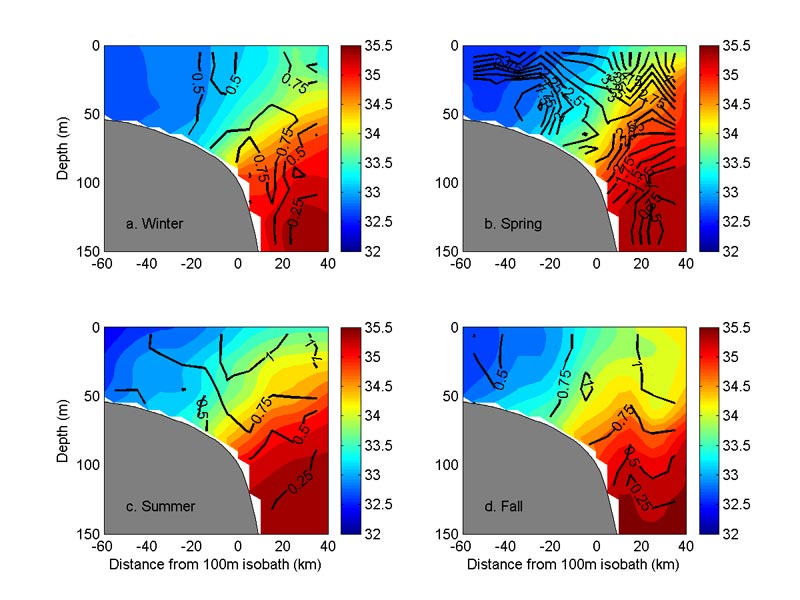
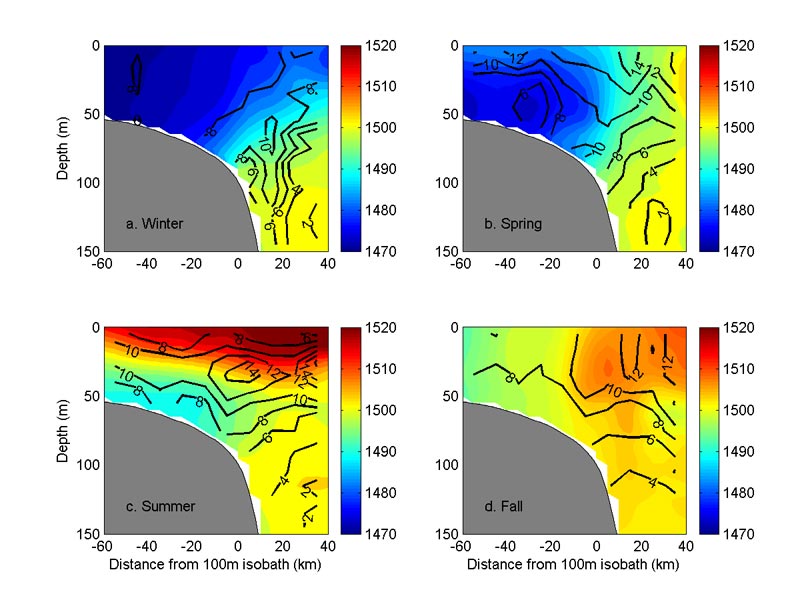
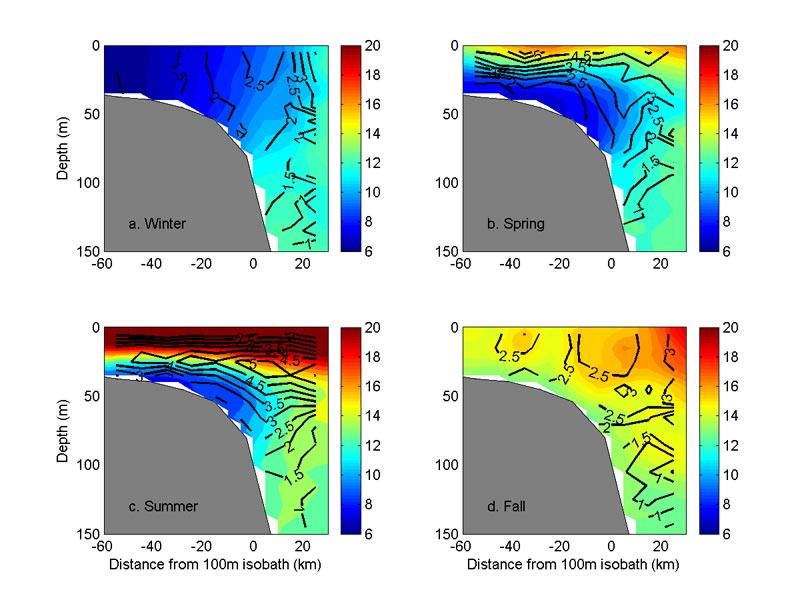
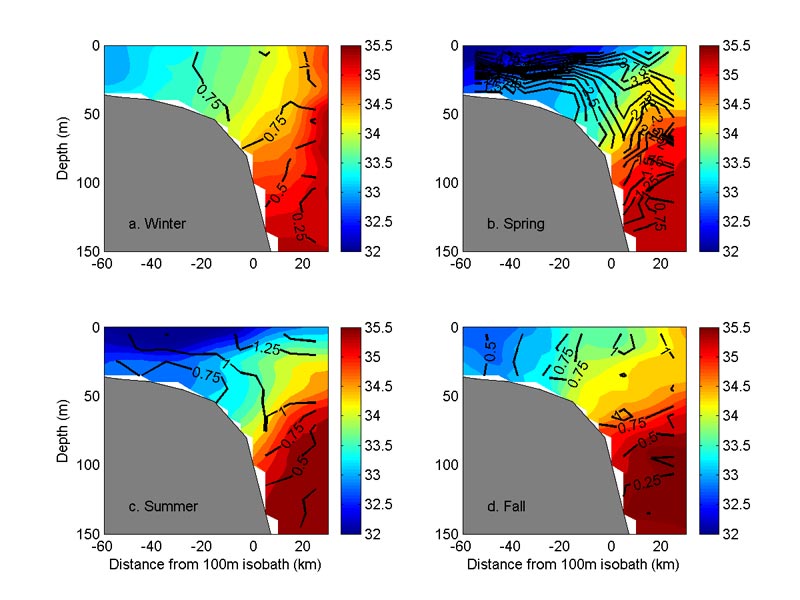
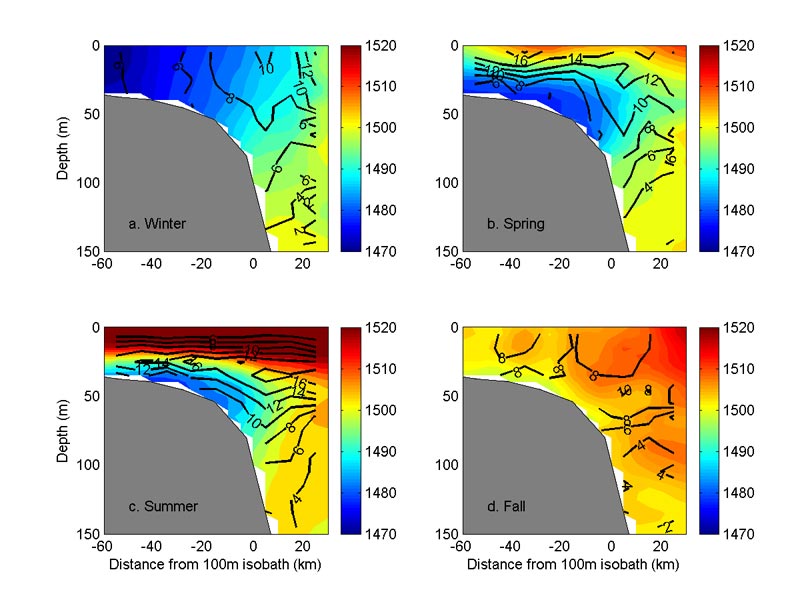
Method - Nantucket Shoals cross-shelf section
The Nantucket Shoals and New Jersey cross-shelf
sections are an entirely separate product from the above planview
climatology. They were created using a different method. In this
version, the profiles (from only the bounding boxes shown above)
are sorted based on their minimum (perpendicular) distance from
the 100m isobath. The horizontal resolution is 10km (extending
from 60km onshore to 40km offshore of the 100m isobath), and the
vertical resolution is 10m. Thus, if a profile is determined to
be 6 km shoreward of the 100m isobath, it is placed in the 0-10km
shoreward bin. All data points in this profile from the surface
to 10m are placed in the first vertical bin, then points between
10m and 20m are placed in the second vertical bin, etc. When all
of the data points have been sorted, statistics (mean and standard
deviation) are performed on the bins' temperature and salinity
values. The 2D output mean fields are then smoothed using a bicubic
spline. To further improve the robustness of our calculations,
we have broken the time periods into seasonal bins. Spring is
defined as any profiles collected in Apr/May/Jun, Summer is Jul/Aug/Sep,
Fall is Oct/Nov/Dec, and Winter is Jan/Feb/Mar. As expected, data
density is highest on the shelf and shelfbreak, and tapers off
with distance offshore.
Plots - Nantucket Shoals and New Jersey cross-shelf
sections
The following plots show the mean & standard
deviation of temperature, salinity, and density. The color contour
data is the mean, and the overlaid black line contours are the
standard deviation.
This project is funded by the Office
of Naval Research.
|
