AN INVESTIGATION OF THE TEMPORAL VARIABILITY OF
A NON-LINEAR
INTERNAL WAVE FIELD ON THE PORTUGUESE SHELF
Toby J. Sherwin and D.R. Gus Jeans*
Unit for Coastal and Estuarine Studies
UWB Marine Science Laboratories
Menai Bridge
Anglesey, LL59 5EY, UK
tjs@uces.bangor.ac.uk
*Present Address: Fugro-Geos
Gemini House
Hargreaves Rd
Swindon, Wiltshire, SN2 5AZ, UK
jeans@geos.co.uk
Summary
Observations of non-linear internal waves were made at about 41°
N on the Portuguese Shelf in the summer of 1994 as part of the EU MAST
II MORENA project into mixing and exchange at the shelf edge. The location
was in an upwelling region close to the base of an off shore filament.
Intensive ship-borne measurements were made from the University of Bergen's
R V Håkon Mossby between 9th and 14th August using a yo-yoing CTD,
the ship's ADCP, and a light weight temporary thermistor chain mooring
that was deployed for up to 10 hours as a packet of waves propagated past.
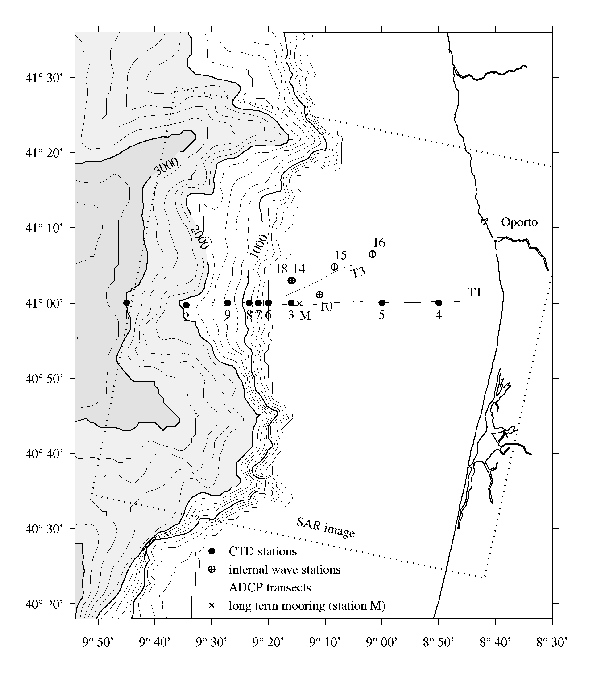
The location of the work is shown in Fig. 1 along with an outline of an
ERS1 SAR image that was taken at the start of the cruise (see also da Silva
et al., 1997). On one occasion the same wavepacket was measured three times
as it propagated towards the coast, about 50 km from the shelf break (Stas
14 to 16 in Fig. 1). In addition a thermistor chain was deployed at the
shelf break between 27th July and 28th August (Sta. M in Fig. 1). The work
is described in detailed in Jeans (1998).
The leading wave was characterised by a sudden non-linear isotherm depression
of up to 45 m and lasting between 10 and 35 minutes (Fig. 2), accompanied
by current surges of up to 0.45 m s-1 and shears of up to 0.7 m s-1 over
60 m depth. The waves propagated on shore with a phase speed of about 0.57
m s -1 in water that was typically 100 to 160 m deep. They were noted to
be significantly wider than would be suggested by classical second order
KdV theory, probably due to their large amplitude.
At Sta. M, a wavepacket appeared each semi-diurnal tidal cycle within
the trough of the thermocline oscillations of the "linear" internal tide.
However, contrary to linear expectations, there was very poor correlation
between the amplitude of the non-linear waves and tidal range, although
a slightly better correlation was found between wave amplitude and upper
layer thickness, which varied in response to upwelling winds (see Figs
3 and 4). The arrival time of the waves varied between 4.9 h and 10.8 h
after HW Oporto. An investigation of the likely explanation of this variability
showed a strong correlation between the lag and the northerly component
of the wind, although good correlation was also found between the arrival
time, ta, and upper layer thickness. However, the size of the variations
was greater than could be reasonably expected using a simple Ekman drift
velocity that is uniform along the coast, and a better comparison was found
when an estimate of the current in the offshore filament, vEf
was taken into account (Fig. 5). This correlation suggested that the waves
originated from a point about 8.2 km west of Sta M at a time of about 2.5
h after HW Oporto.
However, both the extent of the variability in the arrival
time of the waves and the size of the waves relative to the amplitude of
the local barotropic currents, throw doubt on their precise source. Linear
and KdV like modelling exercises (see Jeans, 1998) suggest that, given
their size, the waves could not originate from the shelf break and further
investigations of this problem are being conducted elsewhere. One candidate
source region is the Oporto Seamount, which lies approximately 50 km WSW
of the observation region, although this location seems to conflict with
the analysis given above

Figure 1. Location of the field measurements on the Portuguese
Shelf. (Fig. 1 postscript)

Figure 2. Thermistor chain observation of a non-linear
internal wave train passing Sta. 16.
The letters a to e indicate different troughs in the
train. (Fig. 2 postscript)

Figure 3. Winds in the region predicted from the UK Met
Office European model. (Fig. 3 postscript)

Figure 4. Low pass filtered temperature time series from
Sta. M. (Fig. 4 postscript)

Figure 5. Time series of 1/(c1T
- vEf) and ta
for each tidal cycle, with their cross correlation and scatter plot observed
at Sta. M. In the upper plots the ringed circles correspond to times when
the ship also observed the waves. The curve shows a low pass filter of
the data points. The linear internal tide phase speed is c1T.
Error lines on the scatter plot have a confidence level of 0.99. The typical
wave is estimated to have been at a position delta x west of Sta. M at
time t0. (Fig.
5 postscript)
References
da Silva J.C., D.R.G. Jeans, I.S. Robinson and T.J. Sherwin (1998).
The application of near real-time ERS-1 SAR data to the prediction of the
location of internal waves at sea. Int. J. Remote Sensing, 18, 3507-3517.
D.R.G. Jeans (1998). A Non-Linear Internal Tide on the Portuguese Shelf.
PhD Thesis, University of Wales, Bangor, School of Ocean Sciences. pp 136.
[submitted].
Acknowledgement
This work constitutes part of the EU MAST II supported MORENA project,
contract MAST2-CT93-0065. We are grateful for the support of the officers
and crew on the R V Håkon Mossby during the MORENA 3B cruise.


