Project Results
Overview
There are several products of this project.
First, this is our data assimilation method applied and tested for the Arctic Ocean and some of its marginal seas (the Kara and Chukchi Seas) allowing us to reconstruct circulation and hydrography, combining PIOMAS and SIOM models (see project description).
Second, this is our observational data archive with hydrographic and currents data providing gridded data sets and their statistical characteristics for the periods under investigation: 1972-1978, 1989-1996, and 1997-2006.
The periods for these circulation regimes were determined by Proshutinsky and Johnson [1997, updated, hereafter P&J]. Basic information about definition of the Arctic Ocean circulation regime and their variability characterized by the Arctic Ocean Oscillation (AOO) index is shown in Figure 1. Our hypothetical definitions and explanations of the Arctic’ decadal variability are provided below at the end of this section.
The first period which we have reconstructed in this project is 1972-1978 (7 years) (see Figure 2) was characterized by anticyclonic wind-driven forcing and circulation when the Arctic was relatively cold and there was a large quantity of hydrographic data available; the second is 1989-1996 (8 years, cyclonic circulation regime) when large changes begin in the Arctic Ocean circulation, in its hydrographic structure (freshwater release from the Arctic Ocean) and in sea ice conditions (thinning and reduction in concentration); and the third is 1997-2006 (10 years of anticyclonic circulation regime) when substantial amounts of open water begin to appear in the late summer due to global warming and substantial changes in the Arctic climate have been detected in practically all environmental parameters and disciplines.
Figure 1. Upper panels. Typical wind-driven surface circulation of the Arctic Ocean during anticyclonic (left panel, ACCR) and cyclonic (right panel, CCR) circulation regimes. Bottom panel shows the Arctic Ocean Oscillation (AOO) time series. Positive index (blue bars) indicates years of Anticyclonic Circulation Regime (ACCR) and negative index (red bars) indicates years with Cyclonic Circulation Regime (CCR). More details about circulation regimes and AOO can be found in Proshutinsky and Johnson [1997]. 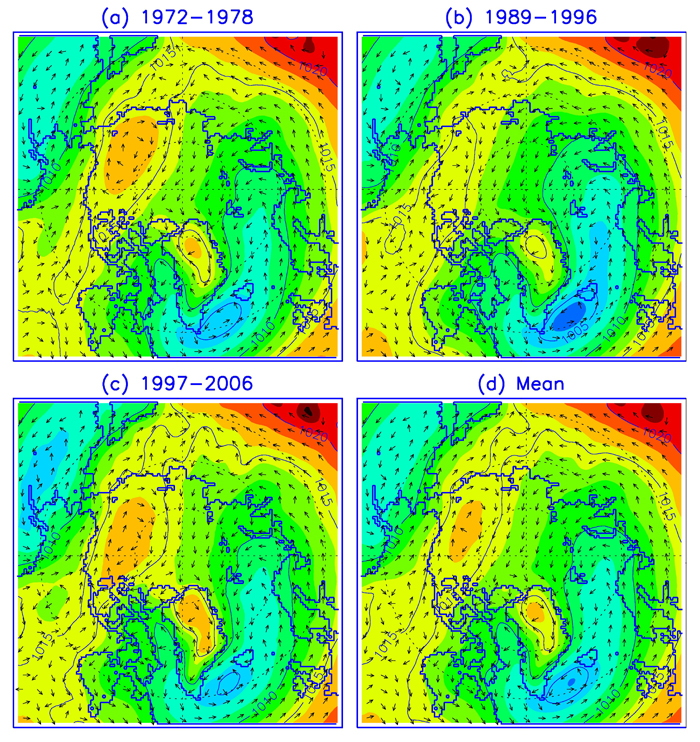
Figure 2. Distribution of sea level atmospheric pressure (hPa) and geostiophic wind direction for 1972-1978, 1989-1996, 1997-2006 and mean.
Third, these are results of our reconstruction of the Arctic Ocean hydrographic conditions and circulation for the three basic periods described above presented in both digital and graphical forms and also results of our analysis of these data (errors and uncertainties of the reconstructed fields and variability).
The Kara and Chukchi Sea hydrography and circulation
reconstructions
In order to test our methods of reconstruction based on modeling with data assimilation we have tested them applying them for the conditions of the Kara and Chukchi Seas. The summer circulations and hydrographic fields of the Kara Sea were reconstructed for mean, positive and negative Arctic Oscillation regimes employing a variational data assimilation technique which provides the best fit of reconstructed fields to climatological data and satisfies dynamical and kinematic constraints of a quasi-stationary primitive equation ocean circulation model. The reconstructed circulations agree well with the measurements and are characterized by inflow of 0.63, 0.8, 0.51 Sv through Kara Gate and 1.18, 1.1, 1.12 Sv between Novaya Zemlya and Franz Josef Land, for mean climatologic conditions, positive and negative AO indexes, respectively. The major regions of water outflow for these regimes are the St. Anna Trough (1.17, 1.21, 1.34 Sv) and Vilkitsky/Shokalsky Straits (0.52, 0.7, 0.51 Sv). The optimized velocity pattern for the mean climatological summer reveals a strong anticyclonic circulation in the central part of the Kara Sea (Region of Fresh Water Inflow, ROFI zone) and is confirmed by ADCP surveys and laboratory modeling. This circulation is well pronounced for both high and low AO phases, but in the positive AO phase it is shifted approximately 200 km west relatively to its climatological center. During the negative AO phase the ROFI locaion is close to its climatological position. The results of the variational data assimilation approach were compared with the simulated data from the Hamburg Shelf Ocean Model (HAMSOM) and Naval Postgraduate School 18 km resolution (NPS-18) model to validate these models (see Panteleev et al., 2007 for details).
Positive results of this work allowed us to continue our project and to test a more complex case with the reconstruction of circulation of the Chukchi Sea where our new method described above was employed. In this test, the Chukchi Sea (CS) circulation reconstructed for September 1990 – October 1991 from sea ice and ocean data was presented and analyzed. The core of the observational data used in this study comprises the records from twelve moorings deployed in 1990-1991 both in US and Russian waters and two hydrographic surveys conducted in the region in the fall of 1990 and 1991. The observations are processed by a 2-step data assimilation procedure involving the Pan-Arctic Ice-Ocean Modeling and Assimilation System (employing a nudging algorithm for sea-ice data assimilation) and the Semi-Implicit Ocean Model (utilizing a conventional 4D-var assimilation technique). The reconstructed CS circulation was studied to: identify pathways and assess residence times of the Pacific water in the region; quantify the balances of volume, fresh water and heat content; and determine the leading dynamical factors configuring the CS circulation. It is found that in 1990 -1991 (high AO index and a cyclonic circulation regime) the Pacific water transiting the CS toward the Canada basin followed two major pathways, namely: via Herald Canyon (Herald branch of circulation, 0.23 Sv) and between Herald Shoal and Cape Lisburne (Central branch of circulation and Alaskan Coastal current, 0.32Sv). The annual mean flow through Long Strait was negligible (0.01 Sv). Typical residence time of the Pacific water in the region varied between 150 days for waters entering the CS in September and 270 days for waters entering in February/March. Momentum balance analysis reveals that geostrophic balance between barotropic pressure gradient and Coriolis force dominated for most of the year. Baroclinic effects were important for circulation only in the regions with large horizontal salinity gradients associated with the fresh Alaskan and Siberian coastal currents and the Cape Lisburne and Great Siberian polynyas. In the polynyas, the baroclinic effects were due to strong salinification and convection processes associated with sea ice formation (see Panteleev et al., 2010 for details).
Figure 3. Reconstructed circulation at 35m in 1990-1991. Blue arrows – model results. Red arrows – moorings and observed currents.
Figure 4.
Reconstructed temperature at 35m in 1990-1991.
Figure 5. Reconstructed salinity at 35m in 1990-1991.
Figure 6.
Reconstructed sea surface heights (SSH, cm) in 1991-1990.
The Arctic Ocean reconstructions and analysis of variability
Finally, we have reconstructed hydrographic fields and circulation of the Arctic Ocean for the three major periods described above. Figures showing mean monthly variability of water salinity and temperature at different levels are available via tables below. Each parameter distribution is plotted as shown in Figure 7 – Figure 11 allowing us to compare distributions in different regimes and different months/seasons. Data in digital form are available in our digital data archive.
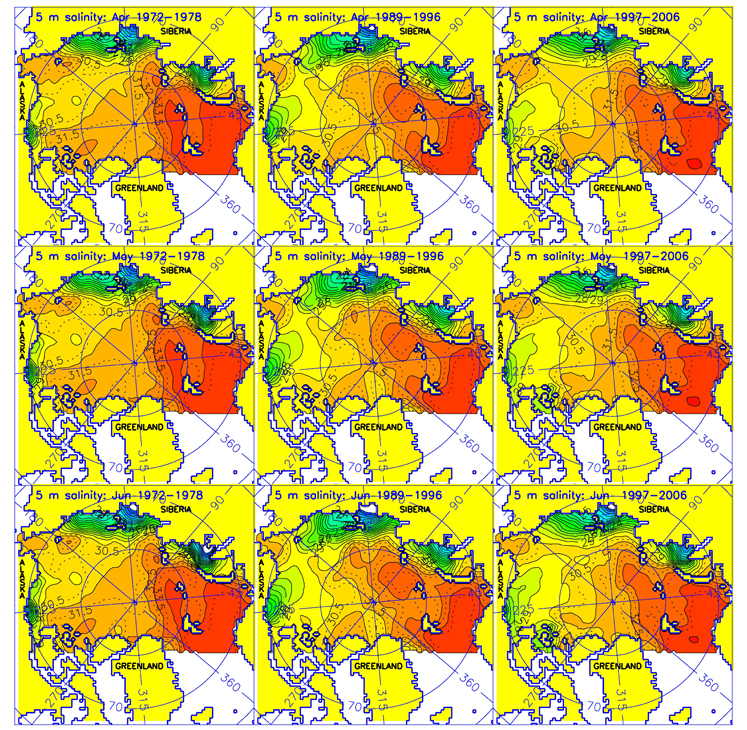
Figure 7. Reconstructed mean water salinity at 5 m level
in the Arctic Ocean in April, May and June for 1972-1978, 1989-1996 and
1997-2006 climate regimes.
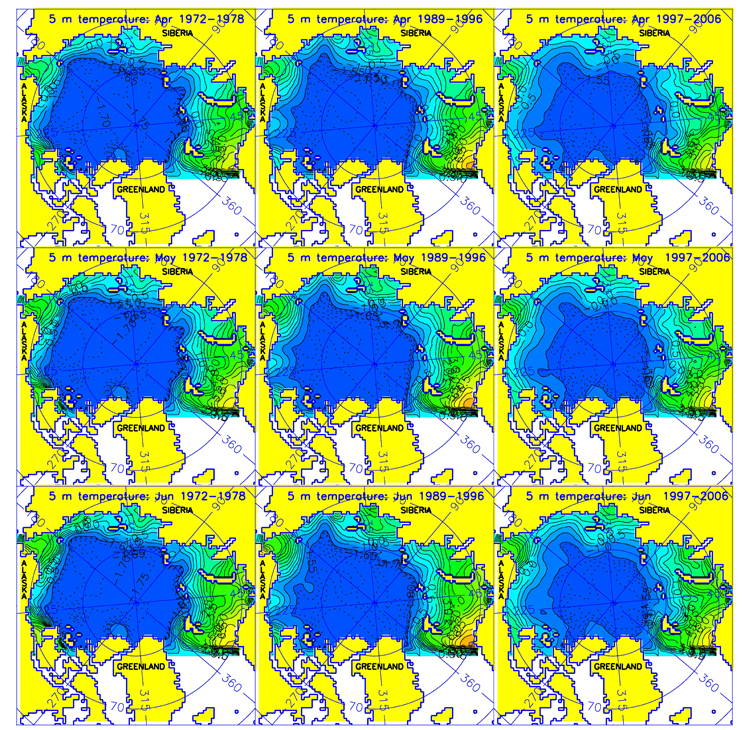
Figure 8. Reconstructed
mean water temperatures at 5 m level in the Arctic Ocean in April, May
and June for 1972-1978, 1989-1996 and 1997-2006 climate regimes.
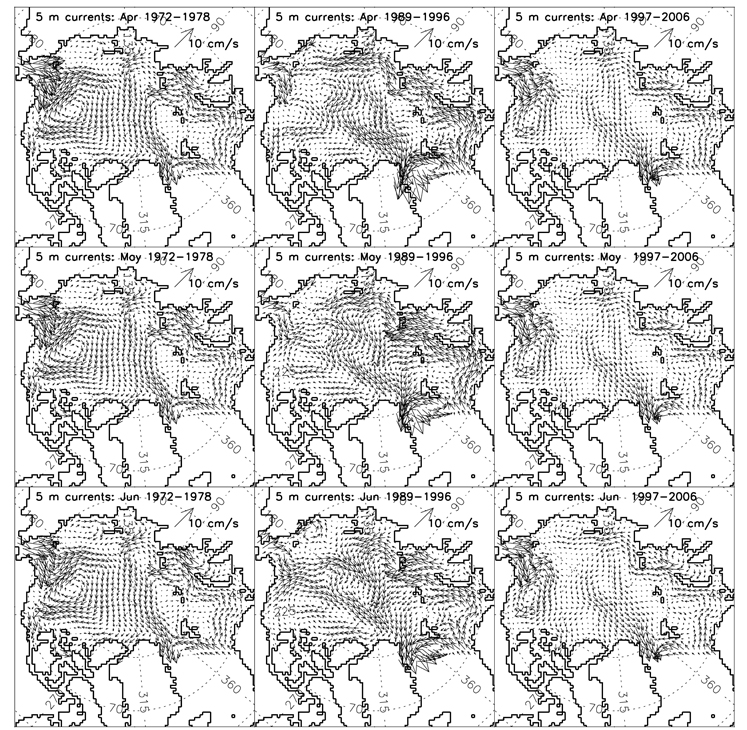
Figure 9. Reconstructed
mean water circulation at 5 m level in the Arctic Ocean in April, May and
June for 1972-1978, 1989-1996 and 1997-2006 climate regimes.
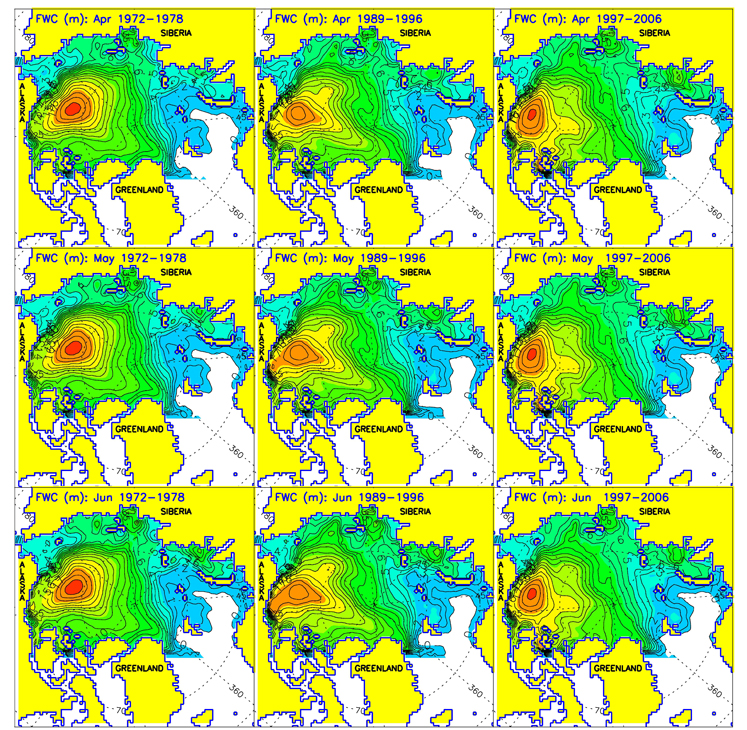
Figure 10. Reconstructed freshwater content (FWC, meters)
calculated relative to reference salinity 34.8 in the Arctic Ocean in
April, May and June for 1972-1978, 1989-1996 and 1997-2006 climate
regimes.
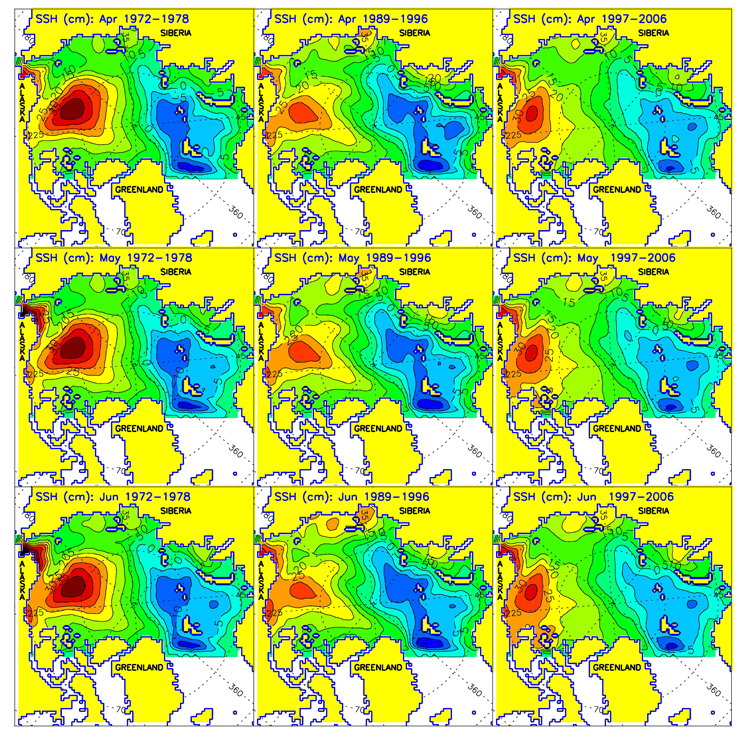
Figure 11. Reconstructed sea surface heights (SSH, cm)
calculated in the Arctic Ocean in April, May and June for 1972-1978,
1989-1996 and 1997-2006 climate regimes
Ocean seasonal and decadal variability
A hypothetical chain of relationships among atmosphere, ice and ocean in the Arctic at the decadal time scale has been proposed by Mysak and Venegas [1998], Proshutinsky et al., [1999] (hereinafter P99) and others but it is important to know what causes the variability. In order to investigate variability of the Arctic Ocean dynamics we examine the interplay between the atmosphere, ice and ocean in terms of the two circulation regimes identified by Proshutinsky and Johnson [1997] (hereinafter P&J) and P99. In these interrelations we pay a special attention to the processes of freshwater spatial and temporal changes because freshwater in the arctic plays an important role in the heat exchange processes and in the stabilization of the Arctic Ocean dynamics (Proshutinsky et al., 2002; Proshutinsky et al., 2009, see also http://www.whoi.edu/beaufortgyre/results where major results of the Beaufort Gyre Exploration Studies project are discussed).
ACCR
During the anticyclonic circulation regime (ACCR), when high atmospheric pressure prevails in the Arctic, the Arctic Ocean accumulates fresh water (FW) through the increase of FW volume in the Beaufort Gyre (due Ekman convergence and subsequent downwelling, see http://www.whoi.edu/beaufortgyre) and through the increase of ice thickness and area due to enhanced ice growth (the Arctic is colder during an ACCR than a cyclonic circulation regime (CCR). Ice is additionally accumulated in the BG during an ACCR due to convergence and ridging under anticyclonic wind forcing. River runoff is increased (trajectories of cyclones are shifted toward land) (P&J; Johnson et al., 1999) and more FW accumulates in the surface waters. When anticyclonic winds are prevalent, the flow of Arctic waters towards Fram Strait is reduced (P&J; Trembley and Mysak, 1998). Consequently, the ice and water flux from the Arctic Ocean to the Greenland Sea and the transport of Atlantic Water into the Arctic Ocean (as a compensation of outflow) are weaker than usual. Deep convection in the Greenland Sea is then enhanced because the vertical stratification is reduced (less FW in the surface waters). This decoupling of the Greenland, Iceland, and Norwegian Seas (GIN Sea) from the Arctic leads to their eventual warming.
Transition to a CCR
All of the above processes lead (with some time lag) to an increase in the gradient of dynamic height between the BG and the North Atlantic. The resultant geostrophic circulation increases as does the outflow of FW and ice from the Arctic. During warming of the GIN Sea, the Icelandic Low intensifies and moves to the north leading to an intensification of the transport of Atlantic waters into the Arctic Ocean. This increase in warm water flux to higher latitudes enhances the penetration of atmospheric cyclones into the Arctic, and ultimately decreases the atmospheric pressure in the Arctic. Warming of the Arctic establishes the CCR.
CCR
During the cyclonic circulation regime, when low atmospheric pressure prevails in the Arctic (see table characterizing different environmental features of CCR and ACCR in P99), the Arctic Ocean releases FW to the NA through the passages in the Canadian Archipelago and Fram Strait. Warming in the Arctic during the CCR increases ice melting and releases additional FW to the central basin. The accumulation and storage of FW in the BG is not favored by the CCR (even though the cyclonic regime leads to increased ice melt, the FW is not accumulated in the BG because of Ekman divergence and upwelling causing a decrease of freshwater volume in the BG), and hence more FW is available for transport to the NA. River runoff is lower during the CCR than during the ACCR but precipitation over the ocean is increased and hence more fresh water is available for immediate release to the NA from sea ice and surface waters during the CCR.
The stronger surface winds of the CCR over the Arctic Ocean directed toward Fram Strait (P99) increase the transport of thick ice, and hence FW, to GIN Sea. At the peak of these processes, when all of them coincide, we observe low salinity anomalies in the GIN Sea.
Transition to ACCR
After several years of increased release of ice and FW to the GIN Sea, the surface layer becomes cooler and fresher, and the sea-ice extent increases in the Greenland Sea. Freshening associated with melting of the increased ice volume and increased flux of fresher surface waters leads to an increase in stratification and a decrease in the interaction between the deep ocean and the atmosphere; deep-water convection is consequently suppressed. After several years the dynamic height gradient between the BG and the NA (and consequently the geostrophic circulation) decreases, the Icelandic Low moves to the south and the interactions between the GIN Sea and the Arctic Ocean become weaker, reestablishing the anticyclonic circulation regime.
It is important to note that in this sequence of processes the accumulation and release of FW and ice plays a fundamental role in the interaction between the Arctic Basin and the GIN Sea.
|