Project Description
Motivation
An Integrative Data Assimilation
for the Arctic System (IDAAS) has been recommended for development by a
special interagency research program “A Study of Environmental
Arctic Change“ (SEARCH, 2005). While existing operational
reanalyses assimilate only atmospheric measurements, an IDAAS activity
would include non-atmospheric components: sea ice, oceanic, terrestrial
geophysical and biogeochemical parameters and human dimensions data. The
IDAAS was recommended for development “because recent global
reanalyses of the atmosphere have received widespread use by the research
community and because they are regarded as one of the major success
stories of the past decade in atmospheric research” (SEARCH, 2005).
Atmospheric reanalysis products play a major role in the arctic system
studies and are used to force sea ice, ocean and terrestrial models, and
to analyze the climate system’s variability and to explain and
understand the interrelationships of the system’s components and
the causes of their change.
Motivated by this success and the major goals and recommendations
of SEARCH, we develop an integrated set of assimilation procedures for
the ice–ocean system that is able to provide gridded data sets that
are physically consistent and constrained to the observations of sea ice
and ocean parameters. Building on our past research activities in sea ice
and ocean data assimilation, we make some first steps toward the creation
of an Arctic Climate System Reanalysis that uses modern four-dimensional
variational (4D-Var, adjoint) data assimilation methods. We employ sea
ice and ocean models with new data assimilation procedures to maximize
the integration of model results with observations and thus attempt to
provide the arctic research community with complete and accurate data
sets, ultimately for at least the last three decades.
Goals
Our goals are to:
- Develop an
integrated set of assimilation procedures for the ice–ocean system
that is able to provide gridded data sets that are physically consistent
and constrained to match available observations of sea ice and ocean
parameters.
- Validate
the system performance, assess the quality of the major system products,
and provide the community with gridded sea ice and ocean parameters for
three approximately seven-year periods characterizing different arctic
climate states.
- Investigate
arctic system variability and the processes important for causing the
observed changes based on the reanalysis products.
Team/instruments/experiences
Polar Science Center team (Lindsay and Zhang) has already
accomplished an extensive reanalysis of the ice–ocean system using
data assimilation methods for ice concentration and ice velocity (Zhang et al., 2003; Lindsay and Zhang, 2005, 2006)
spanning the period 1978–2007. The coupled ice–ocean model
they have used is the Pan-Arctic Ice-Ocean Modeling and Assimilation System (PIOMAS). However, the assimilation methods were
based on optimal interpolation of model results and observations. These sequential techniques are
not entirely consistent with the physics represented in the model. A more physically consistent
method is the 4D-Var approach, which may be used to adjust initial and
boundary conditions, or model parameters in a manner that is entirely
consistent with the model physics and in a manner that optimizes the fit
of the model results with observations (Wunsch, 1996).
International Arctic Research Center and Southern Mississippi
University team (Panteleev and Nechaev, respectively) is versed in the application
of adjoint methods to the ocean. This group has developed, tested, and
used an ocean model (Semi-Implicit Ocean Model; SIOM; Nechaev et al., 2005; Panteleev et al., 2006, see results at http://people.iarc.uaf.edu/~gleb/)
that is capable of data assimilation employing the 4D-Var techniques.
Unfortunately, this model does not include sea ice dynamics and
thermodynamics. It has so far been applied in regional studies of the
Arctic marginal seas for ice free periods or in studies that neglect the
presence of sea ice (Nechaev et al.,
2004, 2005; Panteleev et al.,
2006a, 2006b, 2006c).
Proshutinsky and Krishfield from Woods Hole Oceanographic
Institution are well experienced in modeling (e.g., Proshutinsky, 1993, 2003a,b; Kowalik and Proshutinsky,
1994; Hakkinen and Proshutinsky, 2003), observational (e.g., Proshutinsky et al., 2004;
Krishfield and Perovich, 2005), and integrative studies of the Arctic
Ocean climate system (Proshutinsky et
al., 1999, 2001, 2002, 2005). Model development and simulations
represent a comprehensive level of synthesis because this activity
integrates the accomplishments of numerous disciplines (physics,
mathematics, atmospheric, oceanic, cryospheric, and related sciences)
with observational data, and allows testing of different hypotheses via
numerical experiments.
It is through the combination of expertise on the team that we
feel significant progress can be made to create a physically consistent
reanalysis of the ocean system. The coupled ice–ocean model group (Zhang and Lindsay) uses
conventional methods of sequential assimilation to make a first guess at
the state of the ice–ocean system with PIOMAS and provide the
surface and lateral boundary conditions to the second group (Nechaev and
Panteleev). This second group
determines the 4D-Var optimal solution using SIOM and a large number of
ocean observations as constraints. The third part of our team is responsible for obtaining and
processing the hydrographic observations and in interpreting the results.
Approach
The
Arctic Ocean is covered by sea-ice year round. Ideally, the data
assimilation procedure should take into account ice-ocean interactions
and the data assimilation algorithm should be designed for a sea-ice
– ocean coupled model system. Development of a 4D-var data
assimilation procedure for such coupled ice-ocean system is not
straightforward. Strong non-linearity of the sea-ice dynamics complicates
development of a stable adjoint model and results in low controllability
of the sea-ice model. Effectively, dynamical complexity of these coupled
ice-ocean system may limit applicability of 4D-var data assimilation
methods for long time period integration intervals. Thus, to avoid such
technical problems, we use a set of simplified sub-optimal data
assimilation methods described below (see Figure 1).
Pan-Arctic Ice-Ocean Modeling and Assimilation
System
The sea-ice data are
assimilated by the Pan-Arctic Ice-Ocean Modeling and Assimilation System
(PIOMAS) developed at the Polar Science Center, University of Washington
(see Zhang and Rothrock [2001,
2003, 2005]). The PIOMAS is a coupled parallel ocean and sea-ice model
with capabilities of assimilating sea ice concentration. It consists of
the thickness and enthalpy distribution (TED) sea-ice model developed by Zhang and Rothrock [2001, 2003]
and the Parallel Ocean Program (POP) developed at the Los Alamos National
Laboratory. The TED sea-ice model is a dynamic thermodynamic model that
also explicitly simulates sea-ice ridging. It has 12 categories each for
ice thickness, ice enthalpy, and snow. The model employs a teardrop
viscous-plastic ice rheology that determines the relationship between ice
internal stress and ice deformation (see Zhang and Rothrock [2005]), a mechanical redistribution function that determines ice ridging
(see Thorndike et al. [1975], Rothrock [1979], Hibler, [1980]) and an efficient
numerical method to solve the ice motion equation [Zhang and Hibler,1997]). Assimilation of sea ice
concentration data from satellites in PIOMAS is based on an assimilation
procedure [Lindsay and Zhang,
2006] that "nudges" the model estimate of ice concentration
toward the observed concentration in a manner that emphasizes the ice
extent and minimizes the effect of observational errors in the interior
of the ice pack. This is a relatively simple yet effective assimilation
scheme that is computationally affordable for long-term integrations and
experiments. In addition to improving the simulated ice edge, comparisons
to observed ice thickness measurements in the Arctic indicate that the
assimilation of ice data also improves the simulated ice motion and
thickness.
Semi-implicit ocean model
Oceanographic
observations are assimilated into Semi-Implicit Ocean Model (SIOM) data
assimilation system. SIOM is a modification of the C-grid, z-coordinate
OGCM (Ocean Global Circulation Model) developed in Laboratoire d'Oceanographie Dynamique et de Climatologie [Madec et al., 1999]. This model was designed
specifically for the implementation of 4D-var methods into regional
models controlled by fluxes at the open model boundaries and sea surface.
The model is semi-implicit both for barotropic and baroclinic modes
permitting simulations with relatively large time steps of approximately 0.1 day [Nechaev et al., 2005, Panteleev
et al., 2006a,b]. The tangent linear model was obtained by direct
differentiation of the forward model code. The adjoint code of the model
was built analytically by transposition of the operator of the tangent
linear model, linearized in the vicinity of the given solution of the
forward model [Wunsch, 1996].
The details of the SIOM numerical scheme can be found in Nechaev et al. [2005].
Model configurations and assimilating system
coupling
The
PIOMAS is configured to cover the region north of 43°N with mean
horizontal resolution of approximately 22 km (Figure 2). The model is one-way nested
to a Global Ice-Ocean Modeling and Assimilation System which consists of
similar sea ice and ocean models [Zhang,
2005]. The SIOM was configured for the domain shown in Figure 3. The SIOM’s grid has a horizontal resolution of 75 km. The original version of SIOM does not have sea-ice model, but is
able to assimilate the momentum, heat and salt fluxes between ice and
ocean. We use this possibility in implementation of a two-step data
assimilation algorithm to avoid problems associated with the strong non-linearity
of sea-ice dynamics discussed above.
At the first
step of the algorithm, we run PIOMAS for the entire Arctic Ocean domain
and PIOMAS assimilates sea ice concentration data and simulates sea ice
and water dynamics. At the 2nd step, the SIOM assimilates
external forcing provided by PIOMAS output over the SIOM domain (surface heat, salt and
momentum fluxes) and all available hydrographic data (water temperature,
salinity, velocity) employing a conventional 4D-var data assimilation
procedure that ensures dynamical consistency of the ocean model solution
([Nechaev et al., 2005, Panteleev et al., 2006a,b). To
reduce the number of “unknowns” in the 4-Dvar data
assimilation procedure, the time variability of the SIOM forcing fields
and the functions specifying the open boundary conditions is approximated
by piece-wise linear continuous functions of time on 3-day intervals. The
final product of the data assimilation system includes reconstructed
patterns of circulation and water T&S fields stored at the end of
every 10th day of the SIOM integration.
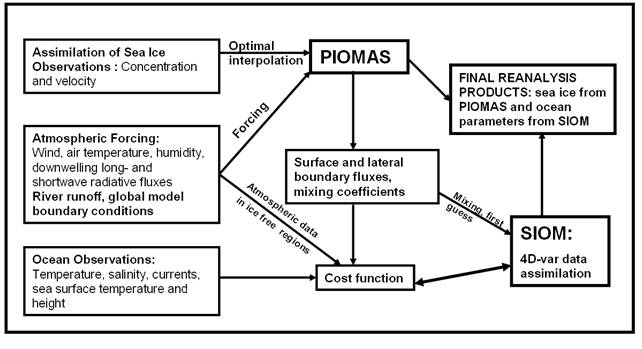
Figure
1.
Data flow chart for the data assimilation procedure.
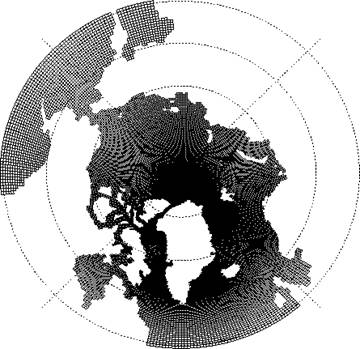
Figure
2.
PIOMAS model domain
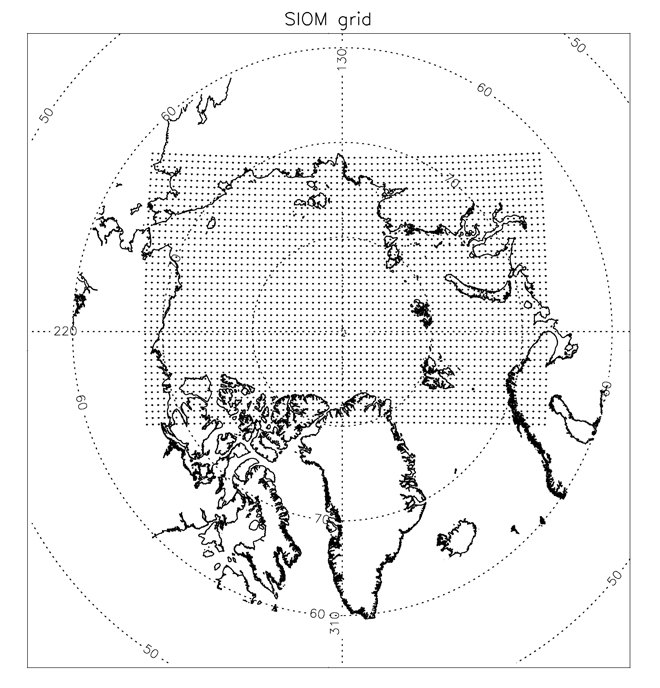
Figure
3.
SIOM model domain
Data sources
PIOMAS is driven by atmospheric forcing applied
to the ocean and ice surface and assimilates sea ice concentration and
drift.
SIOM uses all available ocean hydrography and current data for
assimilation and is forced by data from PIOMAS at the ocean-ice surface.
The major sources of data needed for model forcing and assimilation are
outlined below.
Atmospheric forcing data
Atmospheric forcing data is needed for both
PIOMAS and SIOM. These data are taken from the ERA-40 Reanalysis through
2001 and the ECMWF operational analysis after that. The fields we need are daily
averages of the 10-m wind vector, the 2-m air temperature and humidity,
the sea level pressure, and the downwelling long- and shortwave radiative
fluxes. The reason we select
the ERA-40/ECMWF products over the NCEP reanalysis is that the
downwelling radiative fluxes in the NCEP products are known to have large
errors (Serreze et al.,
1998). Previous simulations
often have used climatological cloud fractions and parameterized
downwelling fluxes, but by using the ERA-40 fluxes we are able to include
realistic interannual variability in the radiative fluxes. The ERA-40 downwelling fluxes
compare very well to those measured during SHEBA (Liu et al., 2005). Our analysis of the
wind and temperatures of these products show there is no significant jump
in their bias after 2001 when compared to NCEP products. Some inhomogeniety in the products
may exist because of atmospheric model changes after 2001, but the
changing mix of available observations during the entire reanalysis
period also adds unavoidable inhomogeneities in the results.
Surface data
PIOMAS
assimilates ice concentration (IC), ice velocity (IV), and wet-ocean
sea-surface temperature (SST). The IC and SST data are obtained from the ERA-40/ECMWF data sets
to insure that the air temperature, IC, and SST fields are mutually
consistent. The source data
from these fields are: 1) the monthly mean HadISST data set from the UKMO
Hadley Centre for 1956-1981; and 2) the weekly NCEP 2D-VAR data for
1982-present (Reynolds et al.,
2002). Both data sets are based on satellite and conventional SST/IC
observations. The principal reason for the higher quality of these source
data sets is the use of a common consensus IC and a common IC-SST
relationship in the sea ice margins. The most recent ECMWF SST fields are from new daily analyses made
at NCEP. The IV are taken
from the optimally interpolated ice velocity fields produced by Chuck Fowler
and archived as a Polar Pathfinder dataset at NSIDC. They are derived from buoy, AVHRR,
and passive microwave estimates of the ice velocity.
Ocean data
The
adjoint data assimilation procedures of SIOM use a variety of ocean data
including salinity, temperature, velocity, and sea surface height. The
Arctic Ocean hydrographic data is sparse in temporal and spatial
coverage. Recently, the
climatology has expanded in two ways. First, historical hydrographic data
have been declassified and released by both Russian and western sources
in the form of smoothed, three-dimensionally gridded fields for summer
and winter [Environmental Working Group Atlas, EWG, 1997, 1998]. This represents a significant
advance but unfortunately, the data for these atlases were averaged for
the decades of the 1950s, 1960s, 1970s and 1980s, irregardless of
climatic regimes. Second, the arctic hydrography database has expanded
recently due to an increase in the number of high-latitude cruises and
the establishment of several long-term observational sites in key regions
of the Arctic Ocean including major ocean boundaries (Bering Strait, Fram
Strait, straits of the Canadian Archipelago, and in the central basin
such as observations conducted in the vicinity of the North Pole (North
Pole Environmental Observatory, NPEO, http://psc.apl.washington.edu/northpole)
and in the Western Arctic (Beaufort Gyre Observing System, BGOS, http://www.whoi.edu/beaufortgyre).
In addition, there has been at least one major expedition by either
icebreaker or submarine into the deep Arctic Ocean nearly every year
between 1992 and 2005 (information about existing arctic hydrographic
data is posted at the BGOS web site). Figure 4 shows distribution
of hydrographic stations in space and time. These monthly gridded data
with some spatial and temporal averaging are available at Digital hydrography
data archive
Other data
include current velocity measured at moorings in the major Arctic Ocean
straits and key regions of the deep basins. There are more than 900
months of these observations available just from the Institute of Ocean
Sciences, Canada (Greg Holloway, personal communication, see Figure 5) Digital hydrography
data archive
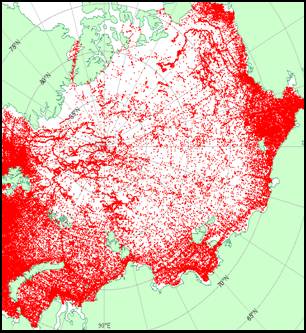  
Figure
4
Left: T-S station data coverage for 1849-2006. There
are 538516 stations in the model domain. Middle: Number of stations by
year. Right: Number of stations by month.
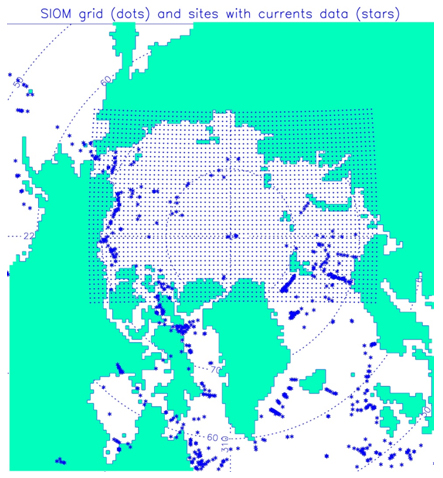
Figure
5.
Locations of mooring
locations with currents data (arrows)
Other sources include the Alfred
Wegener Institute, the Polar Science Center, University of Washington,
and Ohio State University). Significant amounts of data have already been
incorporated into our data archives at WHOI. These data include
climatologic information from the EWG atlas and specially selected and
gridded T&S data provided by the scientists of the Arctic and
Antarctic Research Institute, Russia, for different circulation regimes (http://www.whoi.edu/science/PO/arcticgroup/projects/andrey_project)
and for particular years. Completely new data are available from the NPEO
and BGOS observing systems. The mooring data from these observatories
also includes an upward-looking ADCP at the top mooring float to measure
ocean currents in the upper 50-m layer. For 2003/2004 we also collected
T&S data in the upper 50-m ocean layer from four ocean buoys. Since
2004 the BGOS archive includes data from a new instrument, the
Ice-Tethered Profiler (ITP), which repeatedly samples the properties in
the upper 800 m of the ocean at high vertical resolution over long time
periods. The instrument, its performance in the field, and examples of
the data returned from the system are presented at http://www.whoi.edu/itp.
There also are numerous other sources of data containing water
temperature and salinity fields; sea ice thickness, concentration, and
drift; sea level; and ocean currents. These data are located in national
data archives (NSIDC, ARCSS, NODC) and in local archives of different
institutions of the project PIs. Most of the data archives are available
publicly via the Internet. As part of this
project we have collect and reprocessed all possible data from a variety
of sources for the period 1950-2006 and prepareed these data in a form
suitable for assimilation procedures. The pre-processing procedures included:
quality control and preliminary data analysis; data unification for data
assimilation purposes including low-pass filtering and interpolation to
model grids; estimation of typical spatial and temporal scales of
variability; and obtaining physically meaningful estimates of the data
error variance.
|