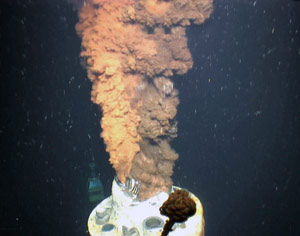
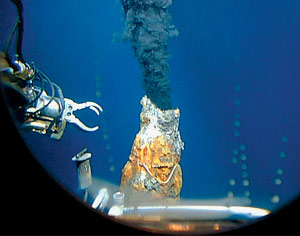
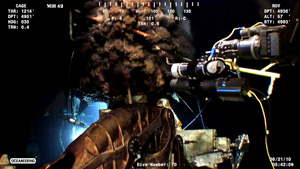
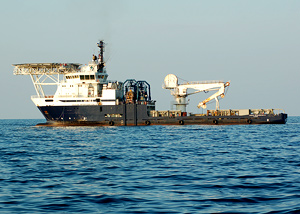
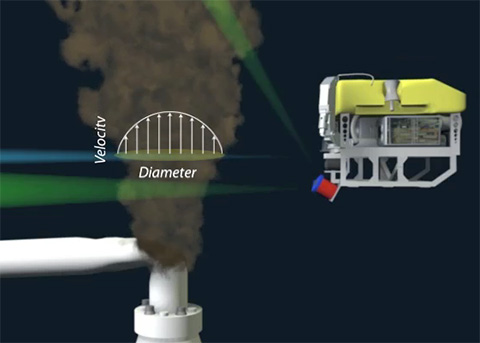
Eleven days after the explosion at the Deepwater Horizon oil rig on April 20, 2010, representatives from BP called Andy Bowen at Woods Hole Oceanographic Institution (WHOI). “It had become obvious just how dire the circumstances were,” Bowen said. The mammoth blowout preventer (BOP), at the undersea Macondo well had failed to seal the gushing leak. Engineers sought ways to “see” inside the BOP’s steel structure, examine internal valves and actuators, and find out what wasn’t working and what could be done to fix it. “They were looking for anybody who had novel technology that might increase their knowledge of the BOP condition, and they felt that Woods Hole, given our experience in working in the deep ocean, might have some valuable technology to help them achieve those objectives,” said Bowen, who is director of the National Deep Submergence Facility at WHOI. The Macondo well was nearly a mile below the ocean surface, an unfamiliar territory at the edge of the oil industry’s experience. In contrast, WHOI scientists and engineers have routinely operated vehicles and technology four times deeper, often to explore a natural phenomenon that WHOI scientists helped discover in 1977: the volcanic geysers of hot, mineral-rich fluids spewing from hydrothermal vents on the seafloor. Indeed, the dark brown jet of hot oil and gas billowing from the broken pipe had a familiar look to Bowen. “Just intuitively, or by looking at a hydrothermal vent and looking at the blowout preventer on the seafloor, you could see some very easy-to-draw similarities,” he said. Coast Guard gets interestedThree days later, Bowen and WHOI scientist Rich Camilli suggested a technique that had never been tried before to measure the oil flow rate directly at the source. They submitted a proposal to BP to use two different types of sonar technology to simultaneously measure the speed and the cross-sectional area of the fluids leaking from the BOP. The measurements would help determine whether the flow in the BOP was constricted, indicating that at least one of its shear rams, designed to seal the well, had partially actuated, Camilli said. BP officials expressed interest, but the next day, they informed the scientists that the company had decided to pursue a containment structure to stop the leak. “Our team was politely thanked by BP representatives for our efforts,” Camilli testified on May 19, 2010, before a U.S. House Subcommittee on Energy and Environment. Two days later, as Camilli was en route to the airport to attend a conference, his phone rang. “It was the executive director of the U.S. Coast Guard Research and Development Center in New London, Connecticut, calling to see if it was still possible to make these measurements. And I told him, ‘Yes, but I’m on my way to Australia.’ … And then he said, ‘Well, I’d like to ask you to stay in the country.’ ” Camilli stayed. “There really wasn’t any question about whether I’d do it or not,” he said. “Eleven people lost their lives there, and I think as scientists, this is one of those instances where there’s a certain ethical responsibility that we have to stand up and be counted on to help. “It’s my understanding that the Coast Guard chose us because they wanted an independent measurement,” Camilli said. “Don Cundy, the director, called me back 45 minutes later and asked me when I could mobilize, and at that point we went into high gear. Within 24 hours, we had all the paperwork in place, and within 48 hours we were in New Orleans with our team and equipment fully mobilized for helicopter transport to the Ocean Intervention III.” The 297-foot ship was a platform for a variety of operations near the Deepwater Horizon blowout. At first, BP did not allow the WHOI scientists to board the vessel and take their measurements. But Coast Guard officials and Marcia McNutt, director of the U.S. Geological Survey, intervened to facilitate the mission. McNutt was also chair of the newly convened Flow Rate Technical Group (FRTG), a collection of several scientific groups assembled by federal agencies coordinating the disaster response. Its goal was to use several different independent techniques to generate the best estimate of how much oil was being released into the Gulf. Gathering outside expertiseUnlike other oil spills in the ocean, which occurred at or near the surface, this one was happening nearly a mile deep. “No proven techniques existed for estimating the flow under such conditions,” said an FRTG report dated March 11, 2011. Oil and gas released by a tanker or a shallow-water oil rig rises to the surface and spreads into a slick, whose extent can be measured by airplanes. No one really knew how petroleum released under the intense pressure and cold temperatures in the depths would behave chemically or physically, but most experts suspected that not all of it would make it to the top. In addition, Deepwater Horizon was not like a one-time spill from a tanker whose tonnage is already known. “Most oil spills are like Pearl Harbor—it’s this one-shot smack,” said Chris Reddy, an environmental chemist at WHOI. “Instead, this spill was more like the Battle of Stalingrad, in which you had this everyday siege,” as petroleum continued to gush out of the broken pipe, ultimately for 87 days. BP’s initial estimate of the flow from the well was about 1,000 BPD or barrels per day (a standard barrel of crude oil contains 42 gallons or about 159 liters). The first official government flow rate, issued on April 28, was 5,000 BPD. Both of these were based solely on aerial views of oil slicks. Many scientists and officials thought the rate was far higher after they viewed underwater videos, released May 12, showing the jet of petroleum hydrocarbons escaping from the damaged pipe. Sounding out the jetAn accurate flow rate was essential for several reasons. It gave engineers a better idea of what was really going on down below and a better chance of figuring out ways to stem the flow. Officials needed an accurate figure to consider how much dispersant should be applied in the depths to prevent oil from reaching the surface and also to plan their strategies to regain control of the well, collect the oil, and limit the environmental damage. “Ultimately, the impact of the oil on the environment depends primarily on the total volume of oil released,” the FRTG report said. On May 30, after multiple attempts by BP to seal the well had failed, Camilli and Bowen flew by helicopter aboard the Ocean Intervention III on a “not-to-interfere” basis, meaning other operations had priority. On May 31, the WHOI team installed two kinds of acoustic instruments on a remotely operated vehicle named Maxx3. The first was an acoustic Doppler current profiler or ADCP, which works on the principle of the Doppler shift in sound. That’s the phenomenon that explains why the sound of a car has a higher pitch as it approaches and then a lower pitch as it moves away. “We aimed (the ADCP) at the jet of oil and gas that was coming out, and based on the frequency change in the echoes that came back from the jet, we could tell just how fast it was moving,” Camilli said. In a matter of minutes, they obtained more than 85,000 Doppler measurements. At the same time, they used an imaging multibeam sonar. “It basically operates in the same way that medical ultrasound works,” Camilli said. “It gives you the equivalent of black-and-white images of the cross section of the flow of oil and gas.” The images allowed the scientists to distinguish jets of oil and gas from the surrounding seawater. Unlike optical imagery, which can look only at the visible outside surface of the jet, the imaging sonar “is capable of looking through the oil plume and seeing in one side and out the other,” Bowen said. The team took more than 2,500 separate sonar images of the jets, which gave them a detailed view of the jets’ cross sectional areas. Multiply these average areas by their average velocities and you get a good estimate of the rate of oil and gas released. The distinct and significant advantage of the method, the FRTG report stated, is that it captured the full flow, by directly measuring the flow right at the leak source before the fluids could disperse. It also produced measurements quickly, Camilli said. Quantifying the flow rate and compositionAs the wealth of acoustic data began rolling in, Camilli set up a satellite link with a team of researchers throughout the country to assist in the measurement process and data analysis. The team included Daniela DiIorio of the University of Georgia; Bowen, Chris Reddy, Dana Yoerger, Jeff Seewald, Sean Sylva, and Judy Fenwick at WHOI; Alexandra Techet of the Massachusetts Institute of Technology; and Louis Whitcomb of Johns Hopkins University. They used computer models of turbulent jet flow, which among other factors, took into account how cool seawater was swept into the jet of hot fluids spewing out of the pipe, and they came up with an estimate of how fast the fluids were flowing out of the pipe. Within hours of examining the data the preliminary answer was clear, the jet flow was being released at a rate approaching a quarter of a cubic meter per second. This estimate did not, however, distinguish between the oil and gas leaking from the well.To determine that, the scientists needed a pristine fluid sample from within the well. To collect this sample, WHOI scientists had proposed using an isobaric gas-tight sampler, or IGT, a deep-sea device developed at WHOI to sample hydrothermal vent fluids (see A Slow Sip from a Big Gusher). Camilli had brought an IGT with him to Louisiana, but BP blocked the scientists from using it. As the team helicoptered off the ship on May 31, Camilli set a plan in motion to take care of this unfinished business. In less than two weeks, Camilli was scheduled to return to the Deepwater Horizon site, funded by a National Science Foundation (NSF) RAPID Program grant, to hunt for subsurface hydrocarbon plumes aboard the research vessel Endeavor (see A Plume of Chemicals from Deepwater Horizon). Once again, Coast Guard officials and McNutt intervened to ensure that the crucial fluid sample was obtained. On June 20, Camilli and colleagues were transported from Endeavor to the Ocean Intervention III for twelve hours and got the crucial sample (see Four Men. Twelve Hours. One Crucial Sample). Analysis of the sample showed that, by mass, the Macondo well fluid contained 77 percent oil, 22 percent natural gas, and less than one percent other gases. With data on how much of what was escaping, the scientists could make a preliminary calculation of how much oil was flowing out of the well. Their initial estimates came up higher than those of other groups using other methods. For scientists, “that’s not a comfortable place to be in,” Camilli said. “There were a lot of sleepless nights, because we had made these measurements, using a technique that had never been tried before, and it was telling us something different from everyone else. We kept going back to it to see if we’d made a simple mistake, or if there was a fundamental flaw in our measurements, but we kept on coming to the same conclusion. So we presented those findings to the government.” On Sept. 27, 2010, Camilli testified in Washington, D.C., before the National Commission on the BP Deepwater Horizon Oil Spill and Offshore Drilling. Subtracting the natural gas component of the escaping fluid, Camilli told the commission that he calculated that on the day they measured it, oil was flowing out of the well at a rate of approximately 59,000 barrels per day. He noted that this estimate was undergoing further analysis. Since then, the research team continued to scrutinize the data, explore possible effects from many factors in fine detail, refine the estimates, and rigorously examine the uncertainties of this innovative method. In a paper published online Sept. 5, 2011, in the Proceedings of the National Academy of Sciences, the team estimated that on May 31, 2010, oil flowed out of the blown-out Macondo well at a rate of 7.4 ±1.3 gigagrams per day, equivalent to 57,000± 9,800 barrels of oil per day and was accompanied by an additional 2.1 ±0.37 gigagrams per day (roughly 100 million standard cubic feet per day) of natural gas. Extrapolating the May 31, 2010, flow rate over the timespan of the leak, the scientists estimated that 4,800,000 ±800,000 barrels of oil were released from the Macondo well between April 20 and July 15, 2010, when the leak was finally capped. A portion of that total was recaptured directly from the well by containment measures and never reached the ocean, according to the FRTG report. Another portion of the oil was evaporated, skimmed or burned at the surface. A significant percentage of the spilled oil remained unaccounted for in the ocean. A silver liningA lesson of the Deepwater Horizon disaster, Camilli said, is that neither the oil industry nor government responders were fully prepared for it. “One of the big issues that I see as a scientist is that the accepted methods for responding to an oil spill really have become dated,” he said. “They were developed during the time of the Exxon Valdez, in the early ‘90s. They haven’t kept up with the times. In 1990, there were no ultra-deepwater platforms. “Now that we’ve built this relationship with the Coast Guard, we look forward to working with them to fast-track cutting-edge, deep-ocean research in this theater of operations, to be a conduit for the oceanographic community to give back to society,” he said. “Woods Hole has been operating in what the offshore oil industry would consider ultra-deep water for more than 40 years, so we’re used to operating in the deep end of the pool. We can help out there.” Originally published: September 5, 2011 Last updated: August 15, 2013 | |||||||||||||||||||||||||||||||||||||||
Copyright ©2007 Woods Hole Oceanographic Institution, All Rights Reserved, Privacy Policy. | |||||||||||||||||||||||||||||||||||||||