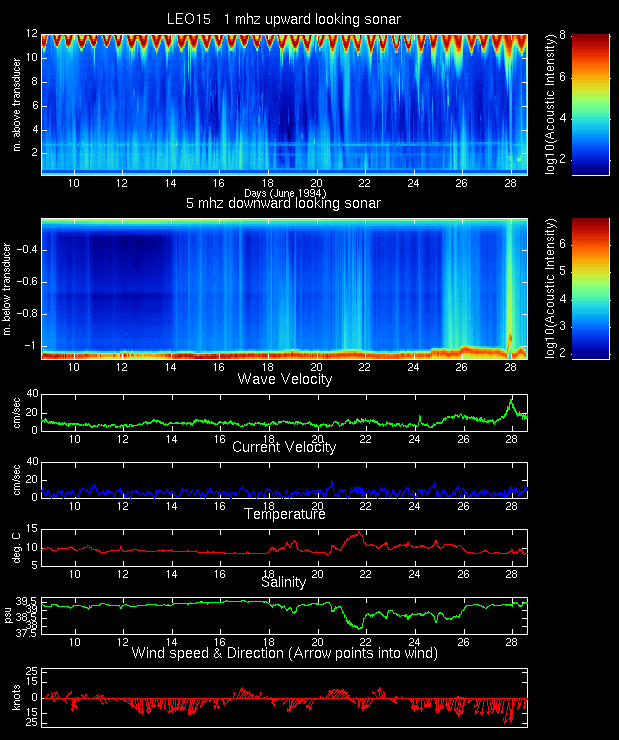

This figure summarises data from the instrument package shown above for the entire June deployment. While the instruments operate with a 2Hz burst sampling rate these plots display two weeks of one hour averages.
Some of the notable features in this data set are:
1) The bright red lines in the 1 and 5 mHz plots are the sea surface and sea floor reflections respectively. The tidal signal is clearly visible in the sea surface elevation. High returns below the sea surface are most likely due to bubbles injected by breaking waves, but the apparent correlation with low tide (for instance June 12-14th) is unexplained as yet.
2) The two sediment resuspension events as visible in the 5 mHz downward looking ABSS data on the 26th and 28th are related to high wave stresses caused by strong winds from the south.
3) While the 5 mHz returns on the 14th through 15th, 18th, and 21st do not appear to correlate with with wave stresses when looking at the VACM RMS wave velocities (shown here) the EMCM reveals there are slight increases in wave activity during these periods. On the 18th and 21st there is a reversal of the predominate summer southerly winds to northerlies. This causes changes in the bottom water temperature and salinity since the south wind are favorable to coastal upwelling (cold bottom water/high salinity) and the northerlies can cause downwelling (warm bottom water/low salinty)
4) In the 1 mHz upward looking ABSS record there are strong returns on the 26th and 28th associated with the storms. The returns on the 10th through 18th, and again on the 20th are not correlated to wave induced bottom stess, but appear during periods of upwelling. Since this is not not active sediment resuspension and the 1 mHz ABSS is most sensitive to scatters with diameter > 500 microns we suspect that these returns are due to biological scatterers. In situ sampling is needed to verify this hypothesis.