Daily maps characterizing ocean thermal structure (OTS) are provided:
1. Sea surface temperature (SST)
2. Sea surface height anomaly (SSHA)
3. Mixed layer depth (MLD)
4. Depths of isotherms (29°C to 4°C, i.e., D29 to D4)
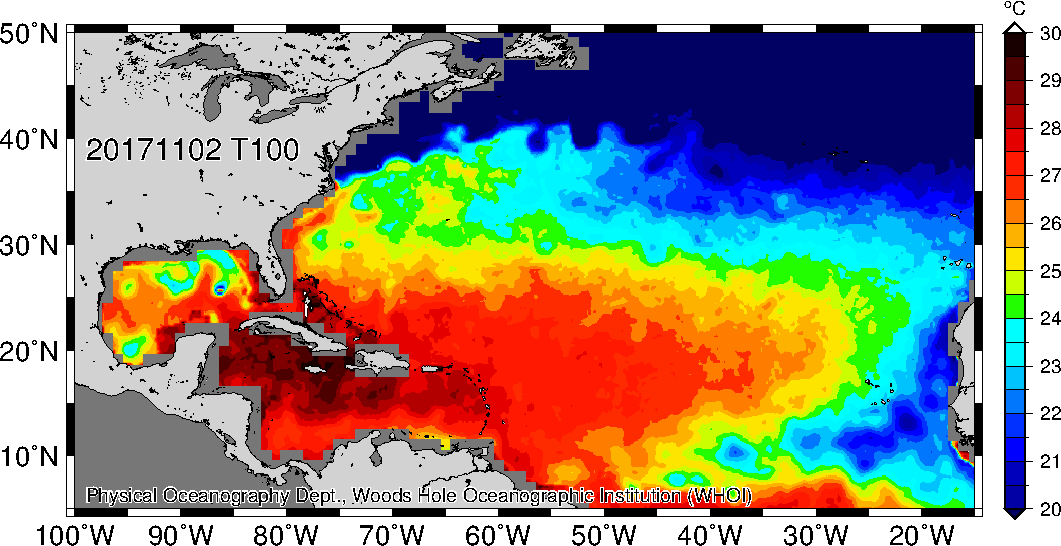
5. Averaged temperature of the top 100 m (T100)
6. Upper ocean thermal structure (UOHC) or tropical cyclone heat potential
(TCHP)
Collaborators: Iam-Fei (Faye) Pun (NTU), Jim Price (WHOI), Steven Jayne (WHOI), I-I Lin (NTU), and Dong S. Ko (NRL)
*** This
is an experimental data set ***
Any comments or questions, please
contact Iam-Fei (Faye) Pun, faye@as.ntu.edu.tw
Click the basin to view the maps.
N. Atlantic
Western N. Pacific
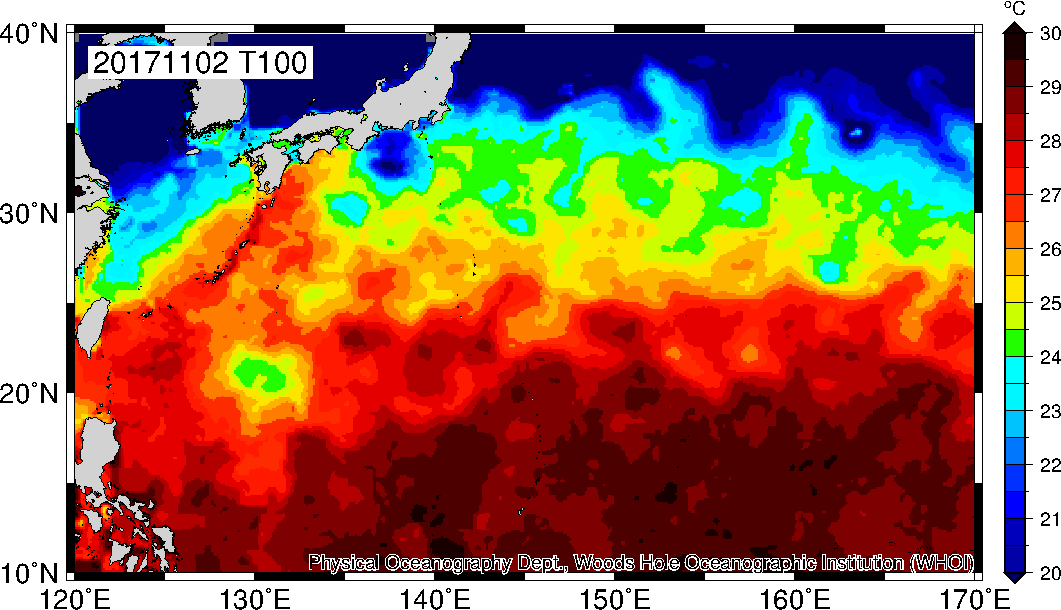
Above maps are the current T100.