
This instrument had its maiden deployment between May and Oct. 2004 at the Bermuda Testbed Mooring (BTM) in the Sargasso Sea and successfully captured the deposition of African dust onto the Sargasso Sea. This instrument produced the first-ever time series record for the concentration of aerosols from a buoy. We will focus specifically on the time-series concentration record of Fe and sea salt. Iron serves as an excellent proxy for mineral dust. This web page will also compare the BTM-2004 times-series of iron and sea salt with a concurrently collected record at the Tudor Hill [AEROCE] atmospheric tower on the island of Bermuda.
This updated section of the web page will have,
- Brief introduction to the scientific questions being addressed.
- Description of our buoy-mounted aerosol sampler with photographs and diagrams
- Sampling protocols
- BTM-2004 buoy results for Fe and sea salt concentrations
- Comparison of the BTM-2004 results with a concurrent time-series on the Tudor Hill atmospheric tower on Bermuda.
- Preliminary BTM-2004 results for other important elements - Al, Mn, P and Ca.
The web page also contains information on the prototype aerosol sampler which was developed by our group (Sholkovitz et al., 1998a, b). Included are figures, photographs, schematics diagrams, text and references to our published works.
Research into iron as a limiting nutrient currently represents a major intellectual and financial component of oceanography. John Martin's "Iron Hypothesis" of the late 1980s and early 1990's has brought the element iron (Fe) and atmospheric mineral dust into the main stream of chemical and biological oceanography. It has also fundamentally altered research into marine biogeochemical cycles and marine microbial biology.
The Iron Hypothesis, in its simplest form, can be sketched as follows.
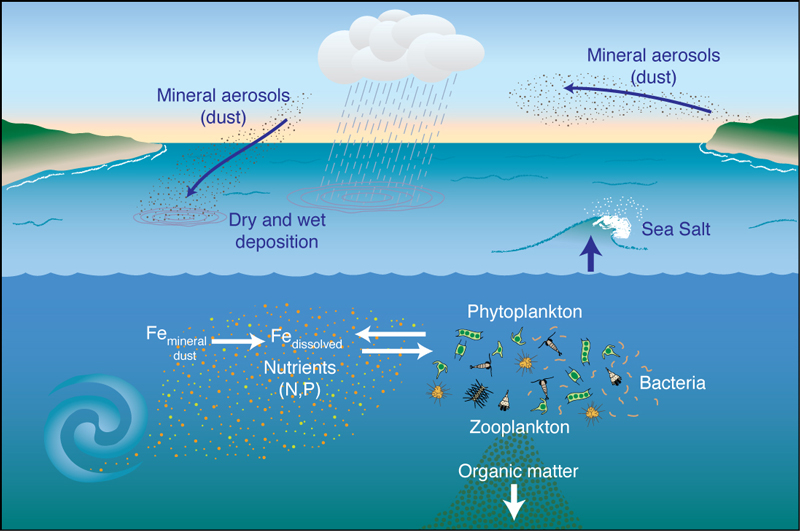
The overall objective is to use moored buoys as oceanic observatories to better quantify the temporal (weekly, monthly and seasonally) variability in the concentration and deposition of mineral dust, iron and other important trace elements over the surface of the oceans. We believe that buoy-mounted instruments can be contribute to a more complete understanding of the upper ocean cycling and the biogeochemistry of Fe by adding an atmospheric component to an oceanographic study.
III. Description of WHOI's Buoy-Mounted Aerosol Sampler
Figure 1 is a photograph of the aerosol sampler on the BTM tower in May 2004. As noted in photograph itself, one can see the aerosol inlet on the top of the tower. Also noted are the housing that holds the filter holders and the housing that holds the air pump and flow meters.
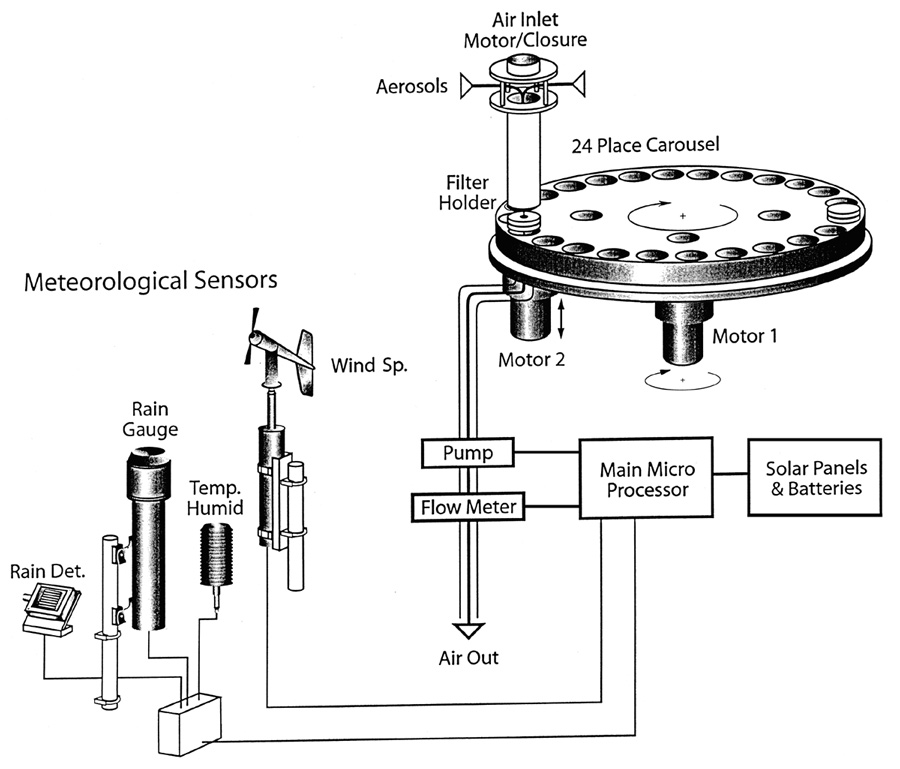
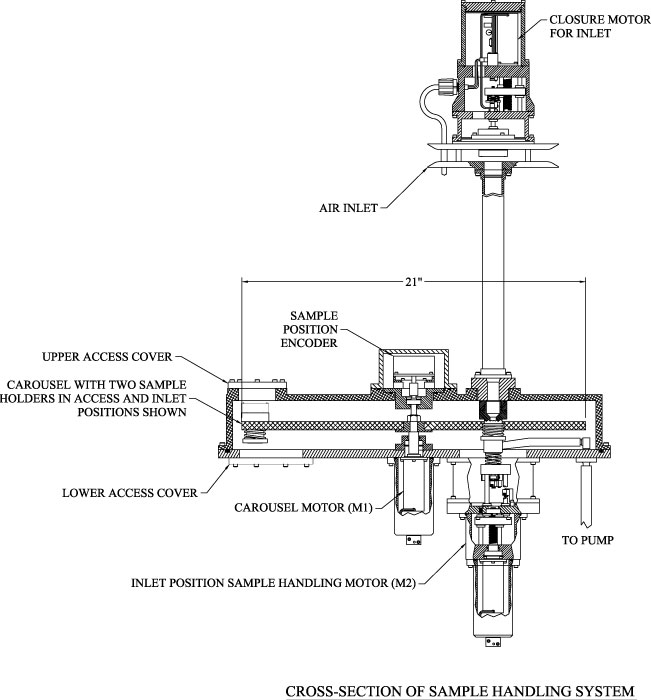
Figures 2 and 3 are schematic diagrams of the aerosol sampler and its associated meteorological (IMET) instruments. As shown in Figure 2, the heart of the instrument is a 24 place filter holder in the form of a carousel which rotates each filter holder under the inlet. There are two motors. One rotates the carousel into place for sequential sampling. The other motor vertically moves a filter holder so that it forms a seal with the inlet's tubing. Figure 3 provides a cross section of the housing for the filter holders and its associated motors.
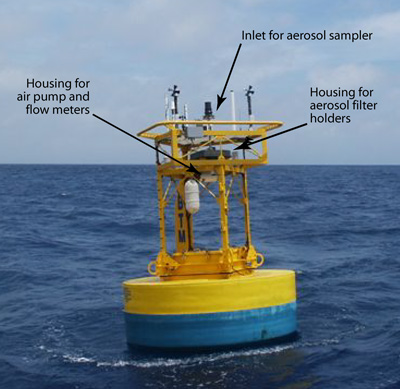
Figure 1. Photograph of the Bermuda Testbed Mooring (BTM) buoy in May 2004. Location is ~ 80 km south of Bermuda. Noted on the photograph are the air inlet (Fig. 8), the housing for the 24 aerosol filter holders (Figs. 4 and 5) and the housing for the flow meters and pump (fig. 7).
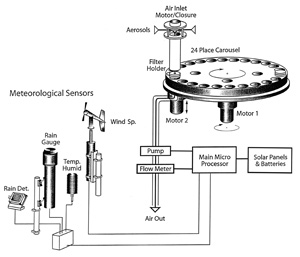
Figure 2. Schematic diagram of the aerosol sampler and its associated meteorological (IMET) instruments. The heart of the instrument is a 24 place filter holder in the form of a carousel which rotates each filter holder under the inlet. There are two motors. One rotates the carousel into place for sequential sampling. The other motor vertically moves a filter holder so that it forms a seal with the inlet's tubing. Click here for larger image.
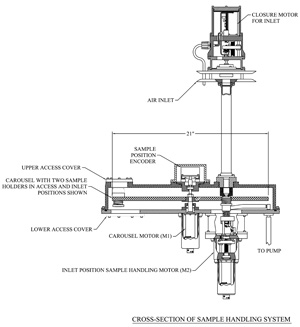
Figure 3. A cross section of the housing for the filter holders and its associated motors and the inlet system. Click here for larger image.
The main features of the instrument are,
- Time-series sequential collection of 24 aerosol samples on 25 mm diameter filters
- Samples and blanks stored and returned to the laboratory for analyses
- Flexible software to run the instrument, set the filtering windows and record volume of air through each filter
- Autonomous and remote operations by batteries
- Rugged and watertight construction
- Simultaneous measurement of key meteorological conditions
- Motorized valve on the inlet to protect the samples and instrument from rain and sea spray.
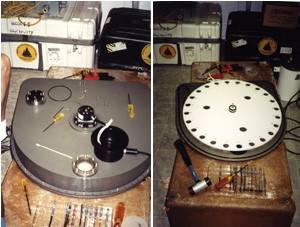
Figure 4 (Above). LEFT - The top of the filter-holder housing and the encoder which sets the radial position of each filter holder under the air inlet. RIGHT - The carousel without filter holders in place.
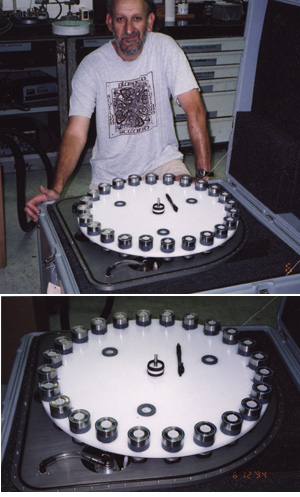
Figure 5. All 24 filter holders loaded into the carousel and three "field filter blanks" that are placed toward the center on the carousel. These filters stay on board the instrument during the whole ocean deployment and as act as filter blanks.
Figure
6. Photograph of the filter holder
itself taken
at different angles. These
holders accept 25 mm diameter filters.
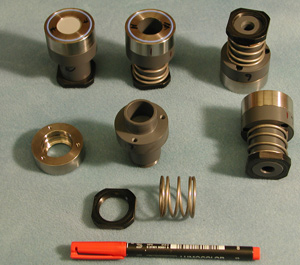
Figure 6 is a photograph of the filter holder and its parts taken at different angles. These holders accept 25 mm diameter filters. The upper part of the holder, in contact with the inlet, is made of titanium. The lower parts are made of PVC. The metal spring keeps tension on each of the filters holder during storage on board the instrument. This spring keeps the filter holders from shaking inside the carousel. It also keeps tension on the filter holder when the latter is pushed against the inlet's pipe during aerosol sampling.
Figure 7 is a photograph of the air pump and the two flow meters and their water-tight housing. As shown in figure 2, air is pumped through the two meters in series. This provides reductant measurements of the volume of air passed through each filter.
Figure
7. Photograph of the air pump
and the two flow meters and
their water-tight
housing.
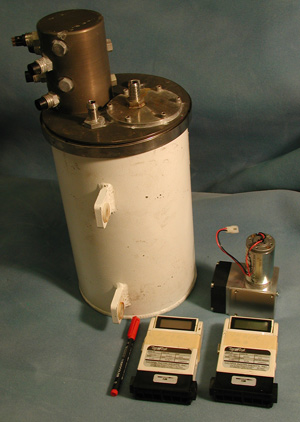
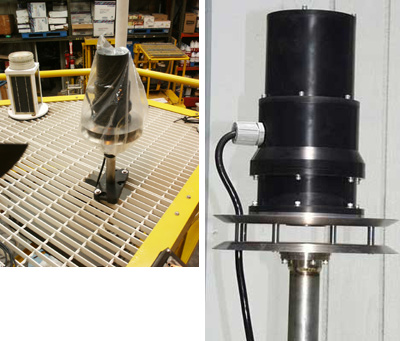
Figure 8 is a photograph of the inlet. All its components, in contact, with the air flow are made of titanium. The tubing from the inlet to the filter holder is also titanium. The inlet is built of two flat horizontal plates (Fig. 3). The ambient air is pulled between the plates, makes a right hand turn and is pulled through the filter. We have added a motorized valve to the top of the inlet. As will be noted in the sampling protocol section, the valve allows us to close inlet and the instrument to the outside. We pause sampling when it is raining or the wind speed is high enough to make sea spray a problem.
Figure
8. Photograph of the inlet on the
BTM tower [The plastic bag is protecting
the inlet
from contamination while installing the aerosol
instrument in
the high bay at BBSR).
Figures 9 and 10 show the aerosol sampler being installed on the tower of the BTM buoy in the high bay at BBSR. Figure 11 is a picture of the buoy's well when it is full of batteries to run our instrument. The batteries - 36 packs of 70 D-cells each- fill the bottom half of the well. Figure 12 shows the wiring for the battery packs in the well. The wires to lead to a junction box on the side of the well. The top half of the well is filled with electronics for our instrument and for instruments of other users - Dickey's UCSB group in case of the BTM. Figure 13 is a photograph of the anemometer and rain sensor unit which gets mounted on the top of the tower.
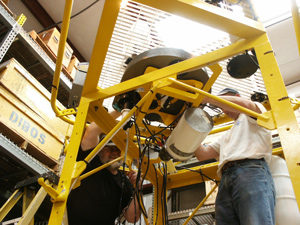
Figure 9. The instrument being installed on the BTM tower in the high bay at the BBSR. Upward looking view showing the two motors (in white) on bottom side of the housing for the filter holders and the white cylindrical housing which holds the pump and flow meters. Geoff Allsup [in black] and Mike Purcell from WHOI.
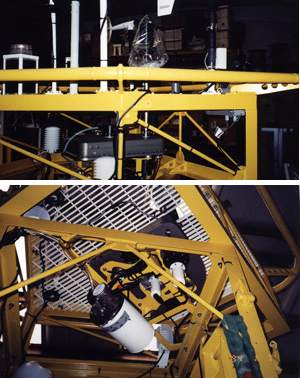
Figure 10. The instrument being installed on the BTM tower in the high bay at the BBSR. TOP - side view showing Ti tubing connecting inlet to housing for the filter holder carousel. BOTTOM - Upward looking view as per figure 9.
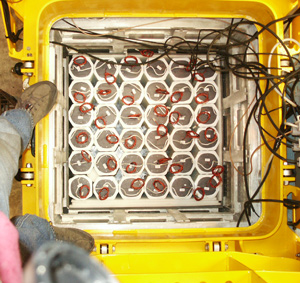
Figure 11. The BTM well when it is full of batteries to run the instrument. The batteries - 36 packs of 70 D-cells each- fill the bottom half of the well.
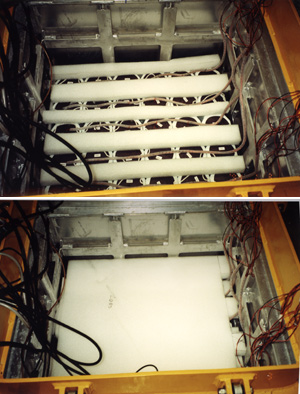
Figure 12. The BTM well and the wiring for the battery packs. The wires to lead to a junction box on the side of the well. Electronic-containing boxes are mounted in the top half of the well over the foam.
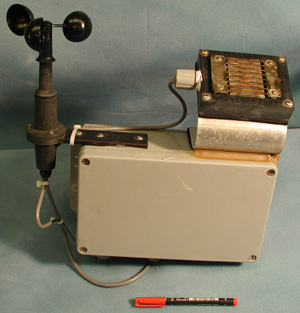
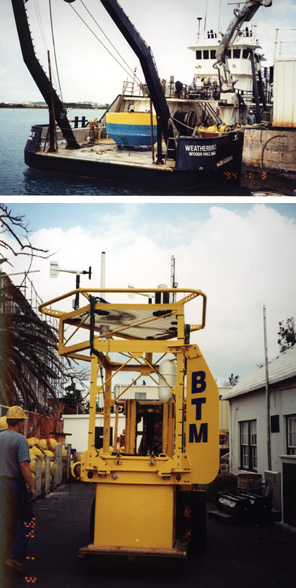
Figure 14 shows that the buoy floatation and tower/well separated. The tower/well can be moved to indoor space for servicing and for mounting instruments such as our aerosol sampler. Only three days of works by three people was needed to add our whole system to the buoy's tower and well. Our instrument was ready to go to sea in three days! All the components of our instrument can be removed in one day by two people.
Figure
14. (TOP) The floatation on the R/V Weatherbird II
and (BELOW) the tower/well
of the BTM
buoy on the dock. The tower/well can be rapidly and
easily
separated from the floatation. The BTM
tower is shown before WHOI's aerosol
sampler was installed.
IV. Sampling Protocol for the BTM-2004 Deployment
The instrument allows for a range of sampling protocols. Users can decide what type of filter is appropriate for their research. The sampling frequency can be set by the user.
The
BTM system is classified as low flow (10-20 lpm). The flow rate of air will depend
on the type of filtering material and its pore size. While rugged and durable,
the pump is small and can be strained if the filters get clogged or if one uses
small [< 0.4 µm]
pore sized filters. While the use of 25 mm filters doesn't provide a large active
area for aerosol collection, it does make the instrument compact. In the end,
the user can adjust the sampling protocol to his/her situation with respect to
ambient aerosol concentrations and analytical detection limits.
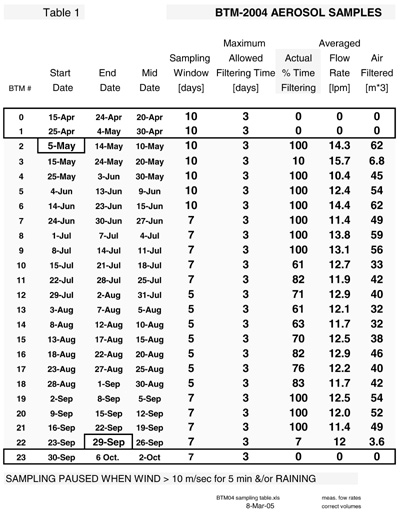
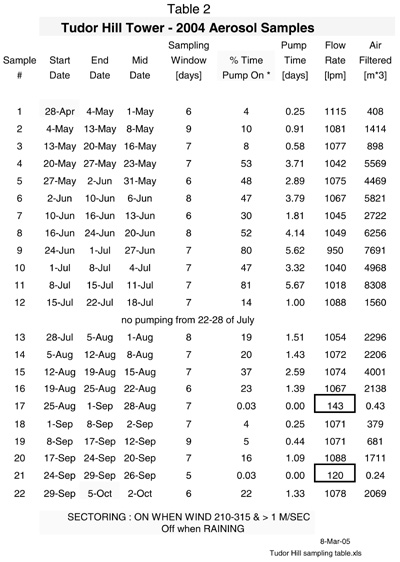
Tables 1 and 2 provide the basic information associated with aerosol sampling history at the BTM buoy and the Tudor Hill tower.
A. Sampling Protocol for the BTM-2004 Deployment.
Isopore polycarbonate membrane filters, 25 mm in diameter and manufactured by Millipore Corp., were used. Our choice of 1.2 µm pore size filters combined a reasonable flow rate (12-14 lpm) with the ability to retain the majority of dust and sea salt aerosols over Bermuda where these particles fall in 1-10 µm range (Arimoto et al., 1997; Maring et al., 2003). While sampling was not sectored by wind direction, filtering was paused when it was raining and/or when the wind speed exceeded 10 m/sec for more than 5 minutes. The latter step was designed to limit the amount of sea spray entering the filtering system.
In practice, bad weather in April 2004 delayed the deployment of the BTM. As shown in Table 1, we had programmed the instrument to start the first sample [filter #0] on 15 April. The buoy sat in Bermuda and wasn't deployed until May 4 at which date sampling commenced when the instrument's electrical cable was plugged into the battery cable. As the software wasn't reprogrammed to start the first sample on May 4, our time-series began with the third sample [filter #2]. The buoy was recovered a week earlier than planned; this lead to the time-series ending before the last sample [filter #23] was used. Hence, our time-series contained 21 out of the 24 maximum samples. The next generation instrument will have a two-way communications system so the sampling sequence can be easily changed on the fly.
Each
of the 24 samples was programmed to filter a maximum of 3 days within its allotted
window of time in which aerosols could be collected. If sampling was not paused
by rain or high winds, then the aerosol sampling would be completed in the first
three days of the allotted window of time. As shown in Table 1, this window of
time ranged from 10 days for samples (#0-6) collected between the middle of April
and late-May, 7 days from late May to late July samples (#7-11) and 5 days from
late July to late August samples (#12-18). This window returned to 7 days for
the month of September samples (#19-23). The reasoning behind this variable time
window was to set shorter sampling windows to coincide with the anticipated summer
dust events from Africa (Prospero, 1996a, b). (The ultimate reason behind the
3-day limit was available battery power to run the air pump.) For example, BTM
filter #7 - the one that captured the biggest dust event at the end of June (Fig.
16A) - collected aerosols for 3 days out of its 7-day window. Over the five months
of deployment, most samples had an actual percentage of filtering time, relative
to the 3-day maximum, that ranged from 61 to 100%. Ten of twenty-one samples completed
(100%) of their 3 days of filtering. Two samples (#3 and 22) did have very low
percentages (10 and 7% respectively) of filtering time due to "rain".
Over the whole deployment, the instrument was paused only 2% of the time due to
high wind (> 10m/s) speed. Pausing due to high winds was only significant for
sample #13 (3-7 August) in which the instrument was stopped for 12% of its five
day window. This percentage of rain-paused time over the deployment was 53%. This
high number reflected a technical problem in that the rain detector sensed "rain"
even when it wasn't actively raining. Hence, the instrument was shut down more
than necessary. This problem will be corrected in future deployments by using
a heated plate to accelerate the evaporation of rain water from the sensing plates.
Irrespective of this clinch, we still collected a complete set of aerosol samples
when the buoy was at sea.
The
flow rates for each filter averaged from 10.4 to 15.7 lpm over the three days
of filtering; most of the samples had a narrower range (11-14 lpm, Table 1). Flow
rates did not decrease for those filters with larger loads of mineral dust and/or
sea salt. Hence, sea salt didn't clog buoy-filters and didn't hamper the ability
of the buoy sampler to capture dust events. As noted above, the winds during this
deployment were not high. They were higher than 10 m/sec (24 miles per hour) for
only 2% of the total deployment time. Winds rarely exceeded 15 m/sec. Hence, one
can not use this deployment to ascertain how effective the 10 m/sec cut-off speed
was in reducing the sea salt content of the aerosol samples.
As noted in Table 1, the volume of air through most of the filters ranged from a 62 m3 to 32 m3. The two exceptions are filters #3 and 22 when rain caused usually long periods of non-sampling time.
B. Sampling Protocol for the Tudor Hill Atmospheric Tower on Bermuda
The Tudor Hill atmospheric tower uses a traditional Hi-Vol system where ~ 1000 lpm of air is passed through large (~ 400 cm2) Whatman 41 paper filters. Filtering occurs ~ 50 m above sea level. Table 2 shows the sampling history for the twenty-two Tudor Hills samples collected between 28 April and 5 October 2004 by Dr. Peter Sedwick (BBSR). The timing and sampling intervals are not too different than those of the BTM buoy (Tables 1 and 2). Each filter had a window of sampling time that ranged from 5-9 days. As with most island systems, sampling was sectored (210 -315 degrees in this case) so that filtering only occurred when the winds were from the south -southwest over the ocean. Aerosol sampling was also paused when the winds speed was less than 1 m/sec, the humidity > 95% and it was raining. As shown in Table 2, the percentage of time that the pumps were on ranged from 4 to 81% of the allotted window of time. Two exceptions were filters # 17 and 21 where sampling only occurred for a few hundred minutes. The flow rate (~ 1000 lpm) and filtering area of the Tudor Hill system are ~ 100 times larger than those of the BTM buoy system. Excluding filters # 17 and 21, 400 to 8300 m3 of air were pumped through the Tudor Hill filters. The maximum volume of air pumped through a BTM filter (# 6) was 62.2 m3.
As noted above and discussed later, the type filter materials and their porosities are very different for the BTM and Tudor Hill tower aerosol samplers.
Arimoto R., Ray, B.J., Lewis, N.F., Tomza, U. (1997). Mass-particle size distributions of atmospheric dust and the dry deposition of dust to the remote ocean. J. Geophys. Res. 102, 15,867-15,874.
Maring H., Savoie D. L., Izaguirre M. A., Custals L. and Reid J. S. (2003) Mineral dust aeroso size distribution change during atmospheric transport. J. Geophys. Res., 108(D19), 8592, doi: 10.0129/2002JD002536.
V. Analytical Methods with the Aerosol Filters
We applied a 3-step dissolution method to the BTM and Tudor Hill [T-H] aerosol samples. A small piece - ~ 1/100 of the active filter area - of the Whatman 41 T-H filters were used in the dissolution steps. Given the fact that the aerosol samples were collected 2-8 months prior to their dissolution, the leaching protocol was NOT designed to address the question of Fe redox states or Fe solubilization in the oceans.
The filters were soaked in Milli-Q water (pH ~ 5.5) for 1 day with the objective of dissolving the sea salt component. Na concentrations were measured by AAS and used as a proxy for sea salt. The filters were next soaked in 1 N HCl at RT for 1 day. The idea behind using 1 N HCL was that this acid would dissolve the less refractory types of iron oxides. Lastly, a 3:1 mixture of concentrated HNO3 and HF was added to each filter; the tightly sealed vials were placed in an oven at 50 F for 36 hrs. This last dissolution step will dissolve most of the lithogenic minerals. No attempt was made to dissolve the refractory minerals at high temperature and pressures. The Fe data shown in Figures 13 and 14 were measured using the colorimetric ferrozine method of Stookey (1970). A reductant was added to reduce ferric to ferrous Fe. Hence, total Fe is reported for each type of leaching solution. The PI is funded to carry out an extensive elemental analysis of the BTM-2004 aerosols using ICP-MS (see Table 1).
VI. The Atmospheric Concentrations of Iron and Sea Salt at BTM Buoy and Tudor Hill Tower during the 2004 Deployment
A photograph of the aerosol samples collected on the BTM-2004 deployment was taken prior to digesting and destroying the samples (Fig. 15A). Filters were removed from their filter holders (Fig. 5) and placed in petri dishes in the order of their collection date. The top row of three filters shows the 'field filter blanks". The photograph in Figure 15B is a blow-up of Fig. 15A showing samples #6 through #11. Both photographs provide clear evidence of African dust events being captured by the sampler. The most visibly outstanding sample is #7 with its vivid brown [African dust] color. As discussed below, this sample contained the highest concentration of Fe and mineral dust.
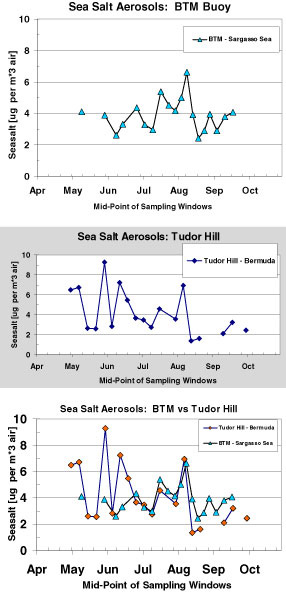
The time-series record of Fe and sea salt concentrations at BTM and Tudor Hill are shown in figures 16 and 17. Total Fe is the sum of the 1 N HCl and HF/HNO3 dissolutions. The following points summarize the results of this deployment.
- The buoy-mounted aerosol sampler worked as designed. There were no mechanical problems over the five month deployment. Aerosol samples were collected and returned to WHOI for analysis.
- The BTM deployment produced the first-ever time-series set of aerosol samples at the air/sea interface using a buoy.
- BTM sampler captured two dust/Fe events from Africa: late June and July 2004. The color (red-brown) of the aerosols point to an African source.
- Both the timing and magnitude of the dust/Fe concentrations at BTM are similar to samples collected concurrently at the Tudor Hill Tower on Bermuda
- The peak BTM concentration of Fe in late June is equivalent to ~ 20 ug mineral dust per cubic meter of air, a value consistent with the long-term measurements of African dust on Bermuda during the summer months (Prospero, 1996 a,b).
- Sea salt content of buoy filters and the Tudor Hill filters is similar. The higher BTM concentrations in middle of time series reflect high wind speeds at sea.
- Sea salt doesn't clog buoy-filters and doesn't hamper the ability of the buoy sampler to capture dust events. The flow rates for each filter ranged from 12-14 lpm over the three days of filtering. Flow rates did not decrease for those filters with a larger load of mineral dust.
- The sea salt concentration at BTM is similar to long-term measurements on Bermuda and in the Sargasso Sea.
- Buoy-mounted instrument is ready to enhance science
Prospero, J.M. (1996a). The Atmospheric Transport of Particles to the Oceans. In: Ittekkot, V., Schafer, P., Honjo, S., Depetris, P.J. (Eds), Particle Flux in the Oceans, Wiley, New York, pp. 19-52.
Prospero, J.M. (1996b). Saharan dust transport over the North Atlantic Ocean and Mediterranean Sea: as overview. In: The Impact of Desert Dust Across the Mediteranean (ed. S. Guerzoni and R. Chester), Kluwer.
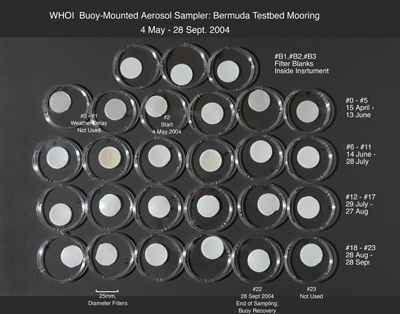
Figure 15 A. Photograph of the aerosol samples collected on the BTM-2004 deployment. Filters were removed from their filter holders (Fig. 5) and place in Petri dishes in order of collection date. The top row of three filters shows the 'Field filter blanks". The most visibly outstanding sample is # 7 with its vivid brown [African dust] color.
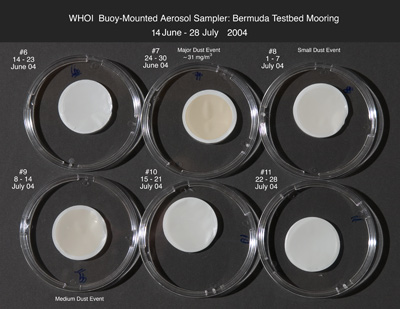
Figure 15 B. Photograph of the aerosol samples collected on the BTM-2004 deployment. Blow-up of Fig. 15A showing samples #6 through #11.
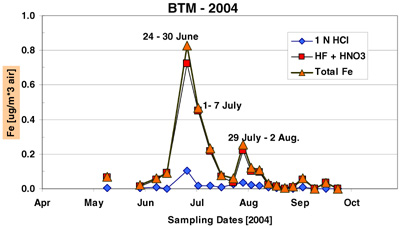
Figure 16A. The air concentration of aerosol Fe collected from the BTM-2004 deployment. Fe was measured using the ferrozine method on two different digestions of the samples. 1 N HCL was used to dissolve the less refractory types of iron oxides. A 3:1 mixture of concentrated HNO3 and HF was used to dissolve most of the lithogenic minerals.
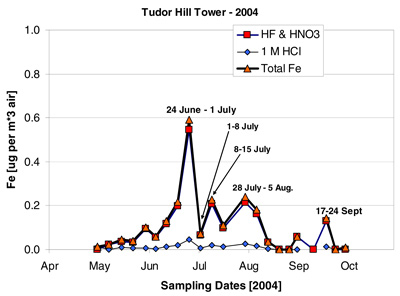
Figure 16B. The air concentration of aerosol Fe collected from the Tudor Hill atmospheric tower on the island of Bermuda between April and October 2004.
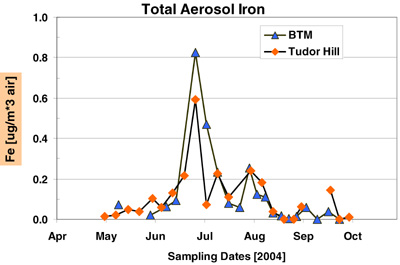
Fig 16C. Comparison of the total iron concentration of aerosols collected at the BTM buoy and Tudor Hill Tower on Bermuda in 2004. Total Fe refers to the sum of the 1 N HCl leach and the HF/HNO3 leach.
Figure
17. Time-series records of the sea salt aerosol
concentration
for the BTM buoy (A) and
Tudor Hill Tower (B). A comparison of the two
records
in shown in part C. The sea salt
concentrations were derived by measuring
the Na concentrations of the Milli-Q leach
of the aerosol samples. A Na
content of 30.6%
for open-ocean sea water was used to calculate
the sea
salt concentrations of the aerosol samples.
Exploring the Fe data in more detail reveals important points about the aerosol sampler and the deposition of mineral dust. The major fraction of the Fe is contained within the lithogenic minerals (HF/HNO3). No more than 15% of the Fe is released to the 1 N HCL leach. MQ-Fe was below detection with the ferrozine method. As shown in table 3, ICP-MS analysis reveals that MQ-Fe is only ~3-4% of the total Fe in the dusty aerosol sample.
The Tudor Hill data "appear" to show 3 peaks of Fe between late June and early August. The BTM data have two peaks over this same time-period. The PI believes that the Tudor Hill sampler missed high Fe concentrations aerosol during its 1-7 July sampling period as the tower was out-of-sector for 50% of the time during that period of time. Both samplers "see" higher dust at the end of deployment in mid-Sept; this feature is larger in island samples.
The PI used the two Fe time-series in Figure 1 to estimate the integrated amount of "total Fe" under all the peaks from mid-June to early August. The inventory of BTM-Fe was 22% higher than the Tudor Hill Fe over the two dust events. This agreement is remarkably good by most geochemical budget standards!
The PI is not too (but pleasantly) surprised that the ocean (BTM) and island (Tudor Hill) sites have mineral dust concentrations that are coincident in time - two major Afrcan dust events. It is surprising that the magnitude of the dust/Fe concentrations and inventories are so close given their hugely different sampling protocols. The similarities in concentrations and inventories may be fortuitous. With sampling flow rates ranging from 12-15 lpm, the buoy system is classified as a Low-Flow devise. The tower uses a Hi-Vol system at ~1000 lpm. A large literature exists on comparisons of aerosol filtering systems. Francois et al. (1985) directly compared the concentrations of Fe and sea salt in the marine boundary layer using a Hi-Vol Whatman #41 system and a Low-Vol Nuclepore (0.4 µm) filter unit. The Hi-Vol system captured 80-100% more Fe and 2.5-4.5 more sea salt. The woven mesh and thickness of these Whatman paper filters make them "over achievers" in that they retain particles much smaller than their nominal 20-25 um pore sizes. In turn, Low-Flow pumping can under collect the larger size particles. The point of this section is note that the BTM-2004 and Tudor Hill-2004 agreement in Fe may be fortuitous. We are proposing a more controlled comparison of island vs. ocean aerosol concentrations.
Francois F., Maenhaut W., Colin J-L., Losno R. Schulz M. et al. (1995) Intercomparison of elemental concentrations in total and size-fractionated aerosol samples collected during the Mace Head Experiment, April 1992. Atmos. Environment 29, 837-849.
One fundamental question is, "How far out to sea can island aerosol data be used to estimate the concentration of mineral dust and Fe over the ocean?" The results in Figure 16 show that both the timing and the magnitude of the dust/Fe concentrations at BTM are similar to samples collected concurrently at the Tudor Hill Tower on Bermuda. Taken at face value, the good news is that time-series at the Tudor Tower is similar to that of the BTM buoy, 80 km off shore. Does this mean that buoy-mounted samplers are redundant? Certainty not. Looked at from the PI's perspective, the results for Fe and sea salt are confirmation that buoy-mounted aerosol collectors can greatly enhance ocean science. Island towers are not common, islands can't be moved and atmospheric sampling stations are expensive to operate and maintain. More fundamentally, Mahowald et al. (2003) published a critical analysis of model simulations and observational data of mineral aerosols. They concluded that one might expect to observe a good correlation between mineral aerosol concentrations over the ocean stations up to a maximum distance of ~ 100 km.
Mahowald N., Luo C., Corral J del. and Zender C. S. (2003) Interannual variability in atmospheric mineral aerosols from a 22-year model simulation and observational data. J. Geophy. Res. 108 (D12) doi 10.1029/2002JD002821.
The PI has carried our some preliminary ICP-MS measurements of the BTM-2004 aerosols. Table 3 presents the % of Fe, Al, Mn, P and Ca in the three solutions used to dissolve aerosol sample #7. This sample was collected in late June and contains the highest amount of African dust (Fig. 16A). Table 3 shows striking differences. The major fraction of Fe and Al are carried in the lithogenic minerals with only 3-4% released to pure water. In contrast, ~50% of the aerosol's Mn, P, and Ca content are released to pure water. Lithogenic particles carry ~¼ of the Mn but almost no P and Ca. These data imply that a large fraction of Mn, P and Ca in the mineral dust will be rapidly released to the upper oceans.
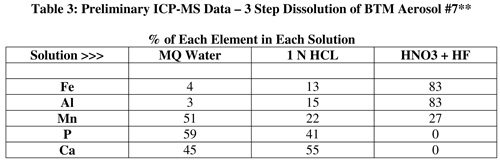
While Fe tends to receive the limelight, other aerosol-bound elements may play large roles in marine biogeochemistry. Considering that P is the limiting nutrient in the Sargasso Sea and in the North Pacific, the buoy-collected aerosols provide another means of determining the aeolian flux of this critical micronutrient to the oceans. Half the P associated with African dust event of late June 2004 dissolves in pure water over 1 day (Table 3). Baker et al. (2003), in contrast, report marine aerosol P to be only sparingly soluble in seawater. The soluble nature aerosol Mn, relative to Fe and Al, has been noted in Jickells et al. (1994).
Baker A. R., Kelly S. D., Biswas K. F., Witt M. and Jickells T. D. (2003)
Atmospheric deposition of nutrients to the Atlantic Ocean. Geophy. Res. Lett.
30(24), 2296, doi10.1029/2003GL018518.
Jickell
T., Church T., Veron A. and Arimoto R. (1994) Atmospheric inputs of manganese
and aluminum to the Sargasso Sea and their relation to surface water concentrations.
Mar. Chem. 46, 283-292.
X. Summary
- The Buoy-Mounted Aerosol Sampler Worked as Designed
- Produced the First Time-Series Set of Aerosol Samples at the Air/Sea Interface using a Buoy.
- Captured Two Dust/Fe Events from Africa: late June and July 2004
- Both the Timing and ~Magnitude of the Dust/Fe Events agree with Concurrent Measurements at the Tudor [AEROCE] Hill Tower on Bermuda
- Similar Magnitude of Dust/Fe Concs. is Fortuitous Given the Extremely Different Sampling Protocols
- Seasalt Content of Buoy Filters are Similar to those of the Tower:
- Seasalt doesn't clog buoy-filters
-
Instrument is Ready to Enhance Science
"Have
You Hugged Your Sensor Developer Today?"
by
Marcia McNutt, Monterey Bay Aquarium Research Institute
Editorial in SEA TECHNOLOGY,
FEB. 2003
PI's Thanks to:
Geoff
Allsup, WHOI, Software and Instrument Development
David
Hosom, WHOI, Instrument Systems, Overall Mr. Fantastic
Mike
Purcell, WHOI, Mechanical Systems
Richard Arthur, WHOI, now Arthur Inc.
Jeffrey
Lord, WHOI, Buoy Hardware and Deployment
John
Kemp, WHOI, Buoy Deployment Expert Extraordinary
Peter
Sedwick, BBSR, Tudor Hill filter samples
Tommy
Dickey and his BTM Group, UCSB
Lary Clark, NSF
Funding
from Ocean Sciences Division of the National Science Foundation
- Sholkovitz E. G. Allsup, R. Arthur and D. Hosom (1998), Aerosol Sampling from Ocean Buoys Shows Promise, EOS (Transactions of the American Geophysical Union), Vol. 79, p. 29.
- Sholkovitz G. Allsup, R. Arthur, D. Hosom and McKenney K. (1998) Development of an Autonomous Aerosol Sampler for Ocean Buoys and Land Sites. WHOI Technical Report, WHOI, 92 pg.
- Sholkovitz,
E., Allsup G., Hosom D, Purcell M. (2001) An autonomous aerosol sampler and elemental
analyzer for ocean buoys and remote land sites, Atmospheric Environment
35, 2969-2975. PDF of article.