Maps and Data Collected During
Voyage AT11-7
East Pacific Rise 9° 25'-55'N
The most recent map additions are at the bottom of the page
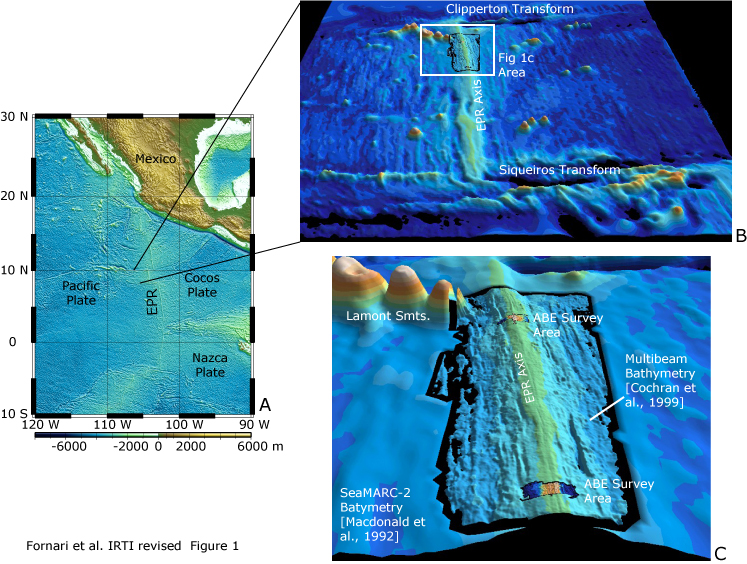
A series of maps showing the location of where we are on the East Pacific Rise near 9° 25'-50'N. Left map shows the East Pacific Rise plate boundary. Top right map shows the location of the ridge axis between the Clipperton and Siqueiros transform faults. Bottom right map shows the 'nested' bathymetric data for this area. The broader contours out to the edges are 300 m gridded data from SeaMarc2 surveys in the late 1980s and early 1990s. The central data on either side of the ridge axis is from multibeam sonar surveying in the 1990s. The small colored boxes show the ABE microbathymetry we collected in 2001 on the AT7-4 cruise (see http://www.whoi.edu/atlantis74 web site).
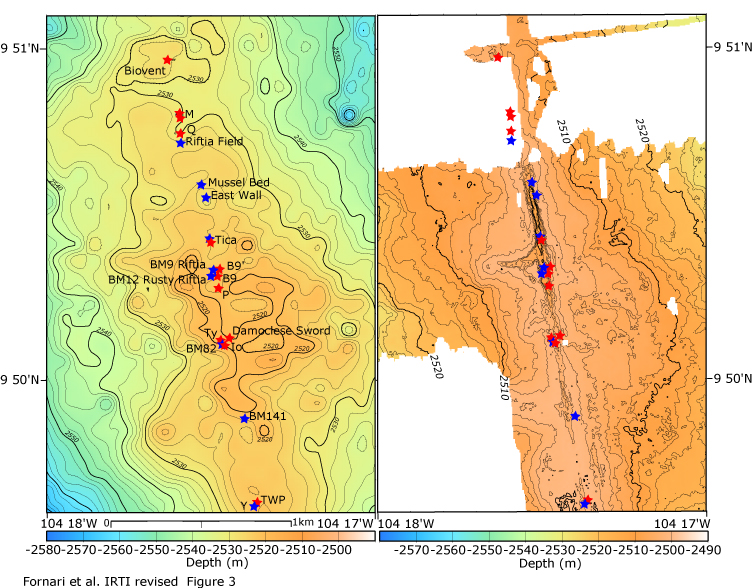
Map showing the multibeam bathymetry (left) and ABE microbathymetry (right) for the same area near 9° 50'N where many of the hydrothermal vents are located along this portion of the ridge axis. The U. Minnesota group is working mainly between the P vent and Tica vent area within the axial trough. High temperature vents shown as red stars and blue stars are low temperature biological communities. Note how much more detailed the contours are in the ABE microbathymetry map. These data have allowed us to better understand the small scale volcanic and tectonic features of the East Pacific Rise crest in our study areas and related specific features to volcanic constructional processes that have built the ocean crust.
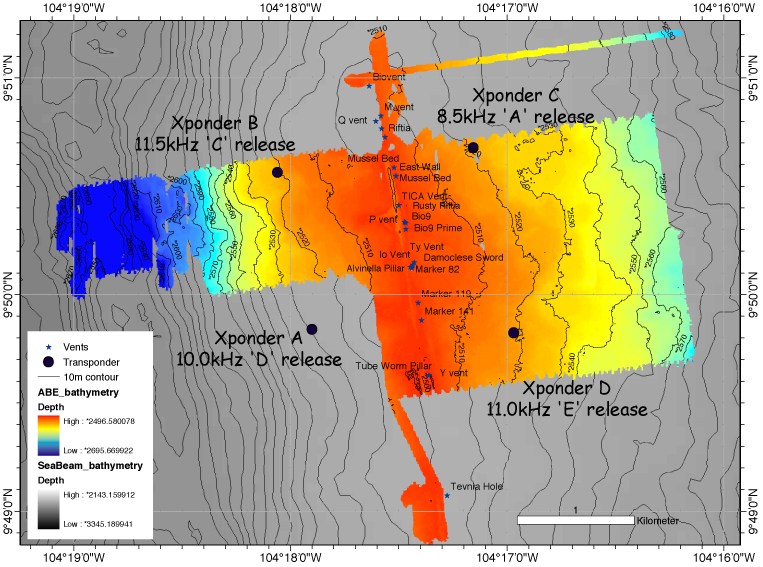
A map showing the surveyed-in locations of the permanent transponders here at the EPR 9° 50'N area, a focused site of seafloor experiments and study by the Ridge2000 Program of the National Science Foundation. We carried out detailed acoustic surveys of each transponder using the PCode GPS positioning system on R/V Atlantis in order to fix the position of each transponder on the bottom to within ~ 1 meter.
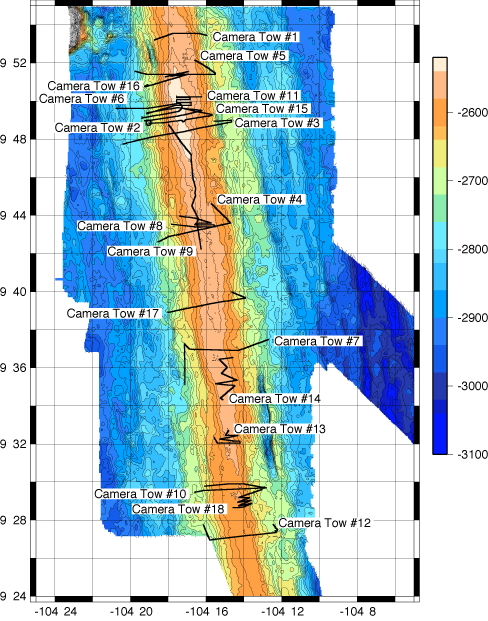
Multibeam bathymetry map of the East Pacific Rise showing updated locations of all Camera Tows carried during the cruise.
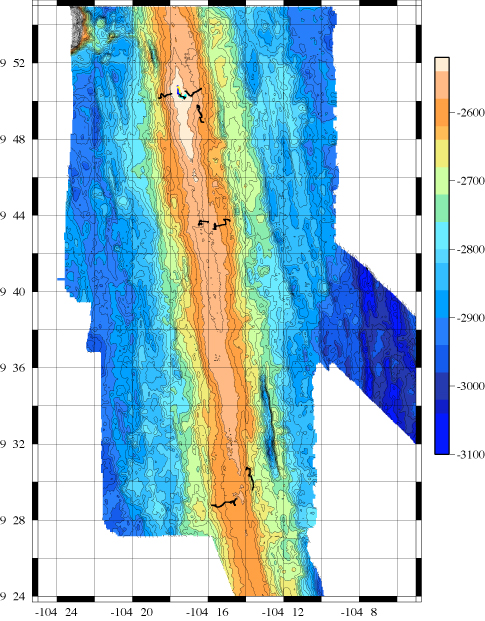
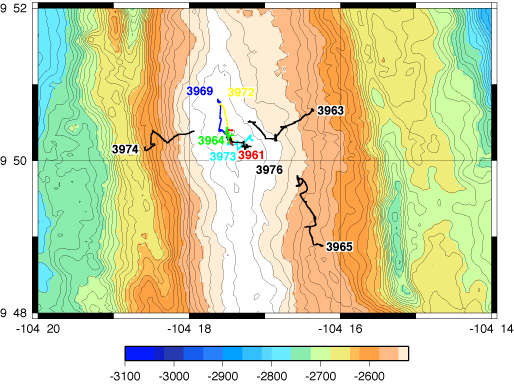
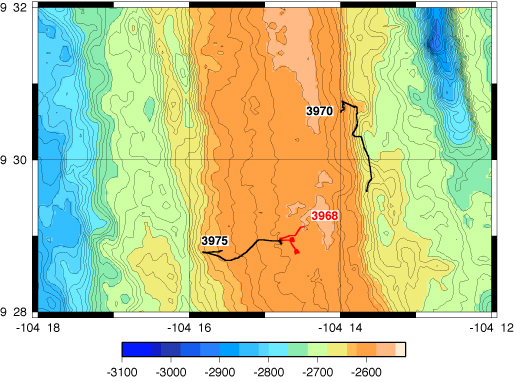
Location map showing where the Alvin dives were located during AT11-7. See the following detailed maps for expanded views in the three primary areas where the dives were located.

Updated crustal magnetization map over the summit of the East Pacific Rise. Colored contours indicate the magnetization calculated from the magnetic field collected in 2001 with the deep towed DSL120A sidescan system and assuming a constant thickness source layer of 500 meters. The magnetization shows a maximum over the ridge axis indicating the extent of the recent lava flow locations. The maximum value along axis appears to be located near 9° 43 N. Bold lines indicate the new TowCam surveys made during this cruise that include near-bottom magnetometer data - a just-implemented sensor on the TowCam built by Paul 'Luigi' Fucile at WHOI.

Updated reduced to the pole magnetic anomaly map over the summit of the East Pacific Rise. Colored contours indicate the magnetic anomaly measured over the study area in 2001 using the deep-towed DSL120A sidescan system. The magnetic field has been reduced to the pole (RTP) to account for the inclination of Earth's magnetic field at this latitude (Inclination=32 degrees).
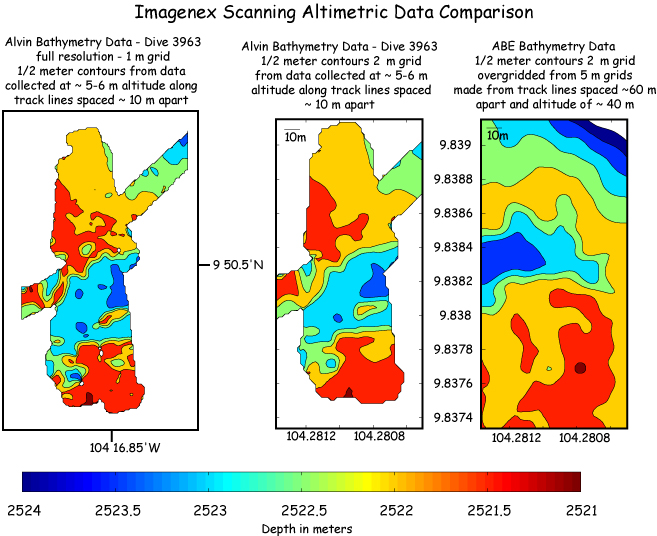
A tryptic of maps comparing the different resolutions of data collected using the Imagenex scanning altimeter on ABE, the Autonomous Benthic Explorer AUV in 2001, and on Alvin during this cruise. Vicki Ferrini - soon to be Dr. Vicki Ferrini -of SUNY-Stony Brook, has been working hard to streamline the processing of Alvin navigation and scanning altimetric data to produce these detailed bathymetric maps of the volcanic seafloor on the East Pacific Rise. The left map shows the full resolution data collected close to the seafloor during Alvin Dive 3963. The data were gridded at 1 m. The center map is the same data but resampled to produce a 2 m grid in order to compare with the ABE data collected 2 years ago. You can see that the general character of the lava channel - blue contours in the middle of the map - is there in all the maps, but the fine-scale details of the terrain get smoothed out in the larger grids. The right-hand map shows the ABE microbathymetry that has been essential to our understanding the detailed topography of the EPR in our study areas. In order to cover as much terrain as possible, we flew ABE at an altitude of 40 meters and had line spacing of about 60 m in Nov. 2001. Because of the elevation and track spacing, the ABE data can only be confidently gridded at 5 m, which is why the data appear to smooth out the fine details seen in the Alvin data in the left-most map. Most of the small, elliptical depressions seen in the map at left are collapse features in the lobate lava.