The following is based on a poster presented at the 1999 ASLO
Meeting in Santa Fe, NM:
AN IN SITU FLOW CYTOMETER FOR THE OPTICAL ANALYSIS OF INDIVIDUAL PARTICLES
IN SEAWATER
Olson, R.J., Woods Hole Oceanographic Institution, Woods Hole, MA 02543,
USA
Sosik, H.M., Woods Hole Oceanographic Institution, Woods Hole, MA 02543,
USA
Abstract
Flow cytometry has proved a valuable tool for the analysis of phytoplankton
and other suspended particles because of its speed and quantitative measurements,
but the methods oceanographic application has been limited by the need
to take discrete water samples for analysis on board ship or in the laboratory.
For this reason, we have developed an in situ flow cytometer, which can
operate unattended. This instrument differs from conventional flow
cytometers in that it uses a simple ducted flow of seawater through the
flow cell, rather than hydrodynamically focussing a stream of sample seawater
by injecting it into a sheath of particle-free fluid. The new instrument
defines a sensing region in the center of a diode-pumped 532 nm laser beam,
based on the intersection of 2 diode lasers; only signals from those particles
which pass through all 3 beams are accepted. This approach should
be less susceptible than conventional flow cytometry to problems stemming
from flow disturbances, and hence more amenable to unattended long-term
operation. Tests in the laboratory and off the WHOI dock indicate that
sensitivity is comparable to that of conventional flow cytometers.
Design details and initial results will be presented.
Approach
(click on image for better resolution)
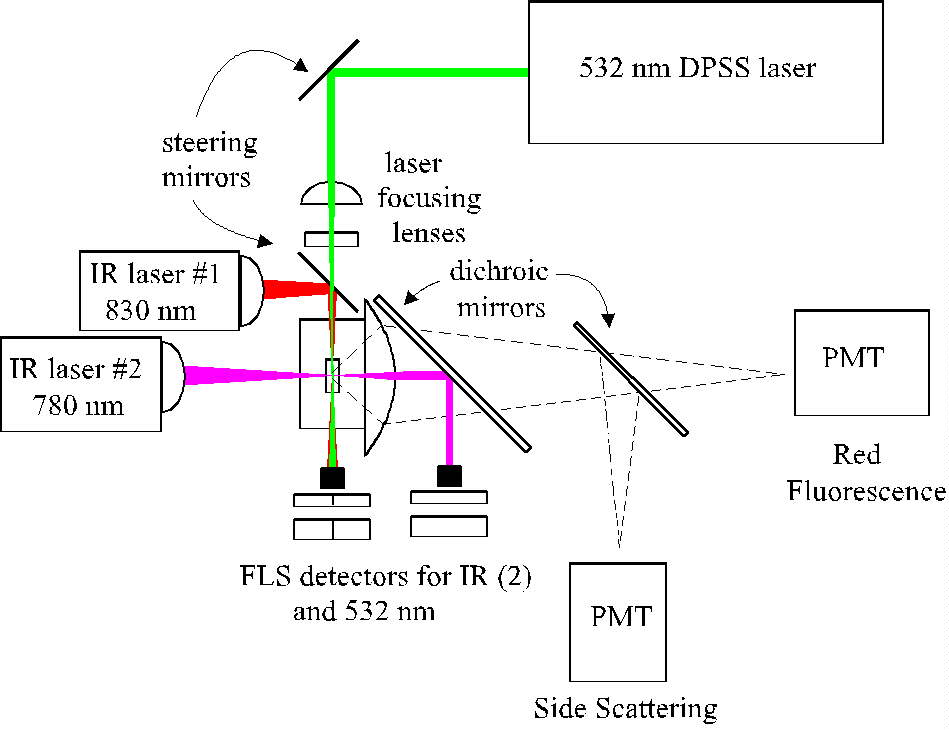
Fig. 1. Schema of the optical and detection systems. For
simplicity, not all lenses, dichroic mirrors and detectors are shown.
In the actual instrument photomultipliers measuring scattering from the
two IR lasers, forward and side scattering from the green laser, and green-excited
red and orange fluorescence.
(click on image for better resolution)
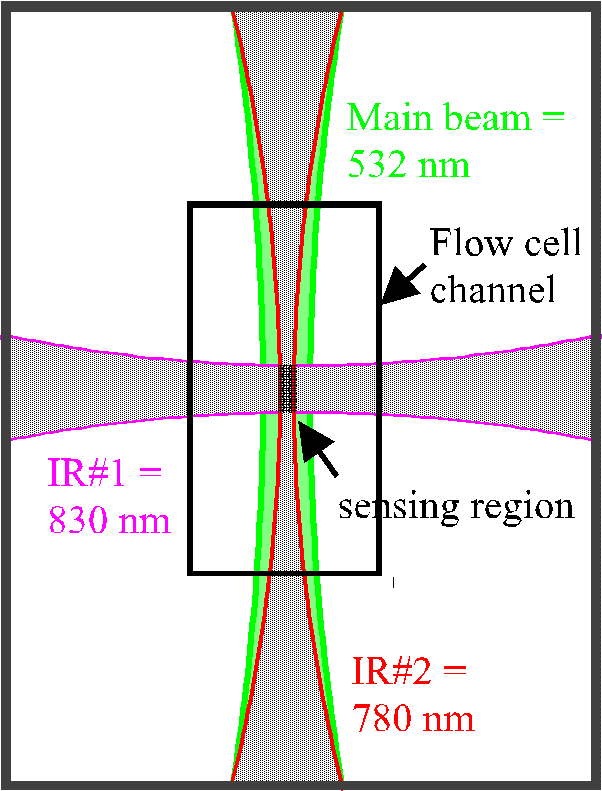
Fig. 2. Cross-sectional view of the flow cell. The
intersection of two IR lasers defines a sensing region in the center of
a third, 532 nm, laser beam. All three beams are in the same plane,
with particles flowing upward through the flow cell channel. Data
will be acquired only from particles passing through all three beams simultaneously,
ensuring that only signals from the central, uniform part of the green
beam will be collected.
(click on image for better resolution)
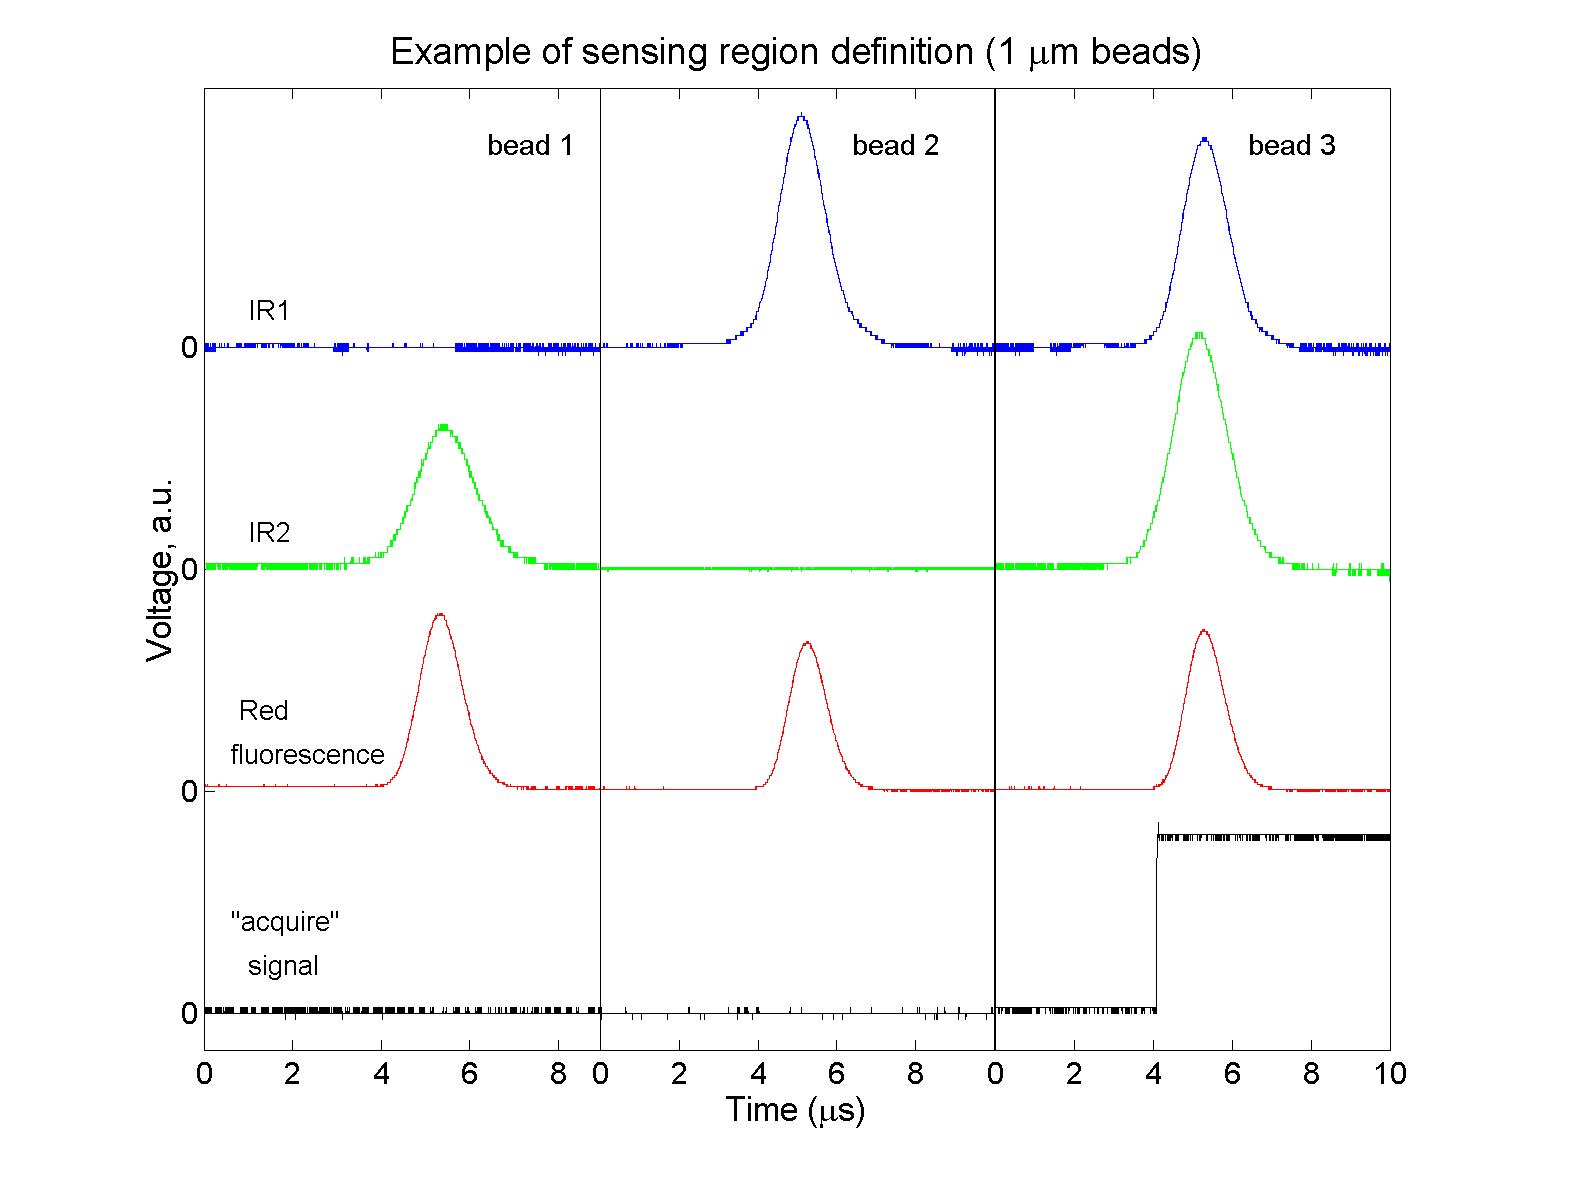
Fig. 3. Snapshot of signals from 3 beads passing through through
the flow cell. Only 1 of these passed through both IR beams as well
as the green beam and was acquired.
(click on image for better resolution)
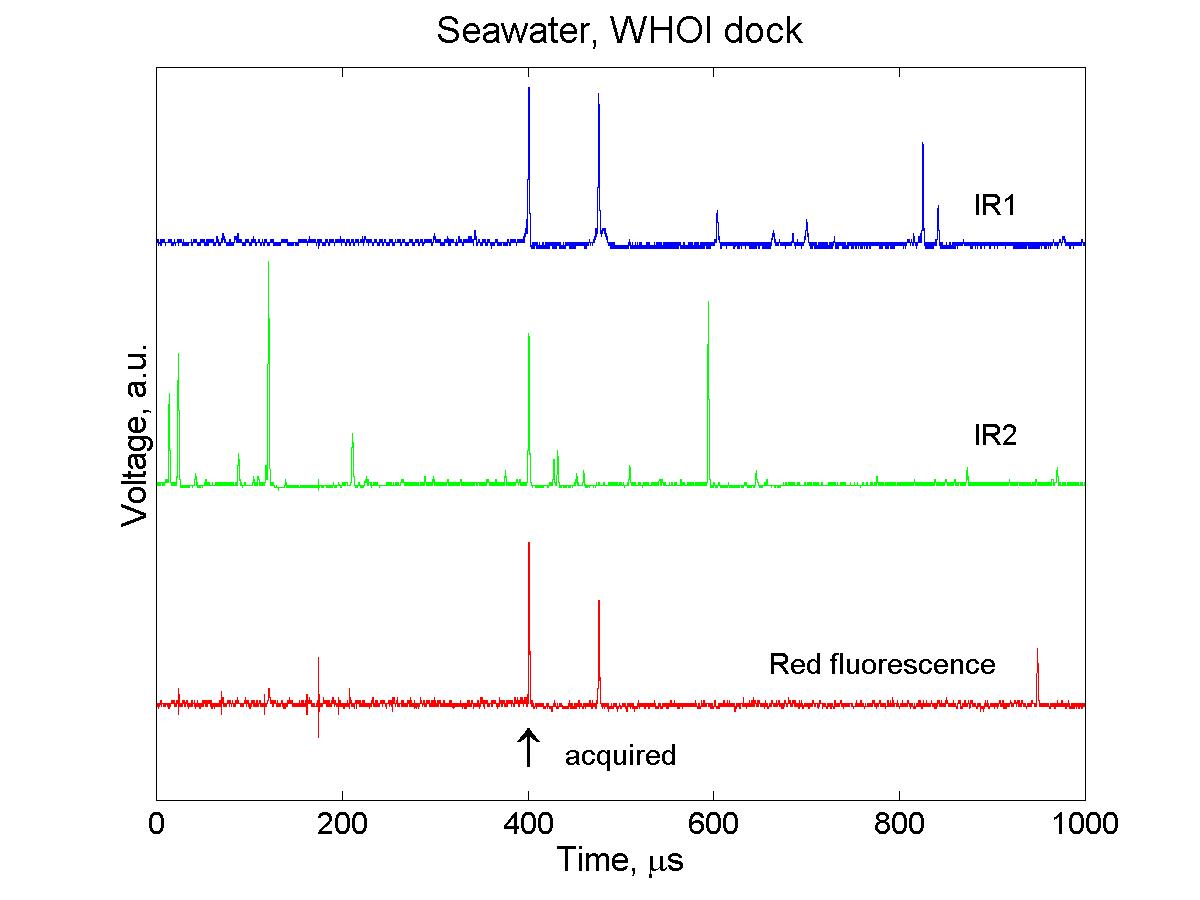
Fig. 4. Signals from particles in a seawater sample recorded
over 1 ms. Of several particles observed during this time, only 1
passed through both IR beams as well as the green beam and was acquired
(arrow).
(click on image for better resolution)
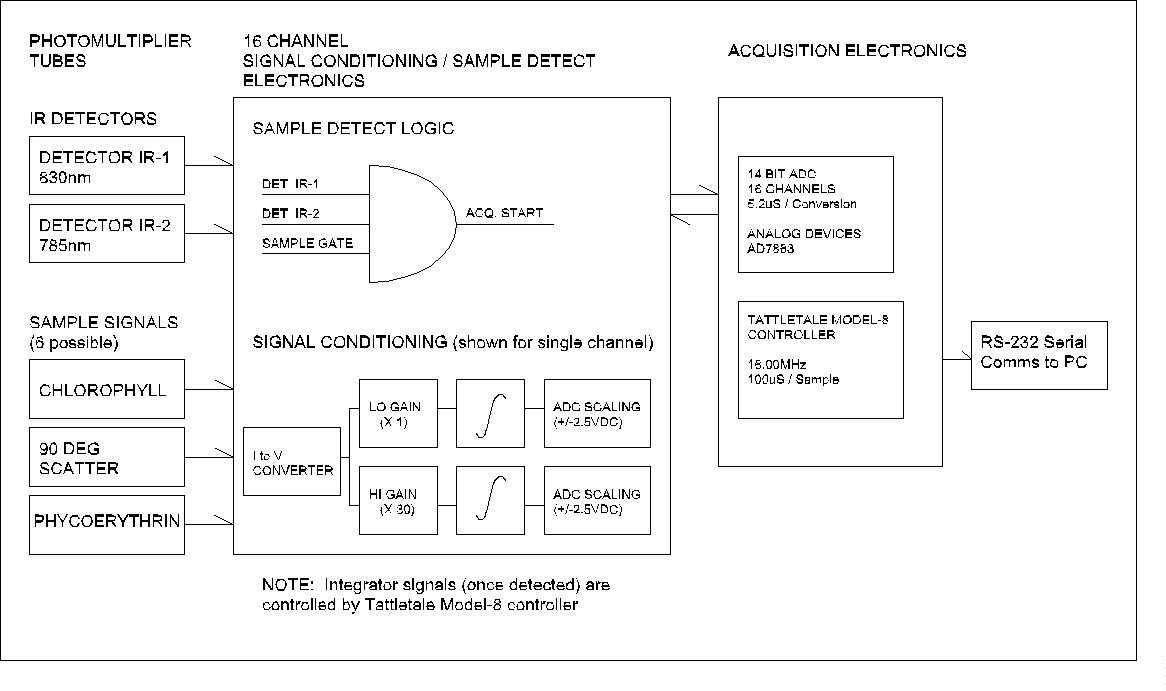
Fig. 5. Block diagram of the flow cytometer electronics.
(click on image for better resolution)
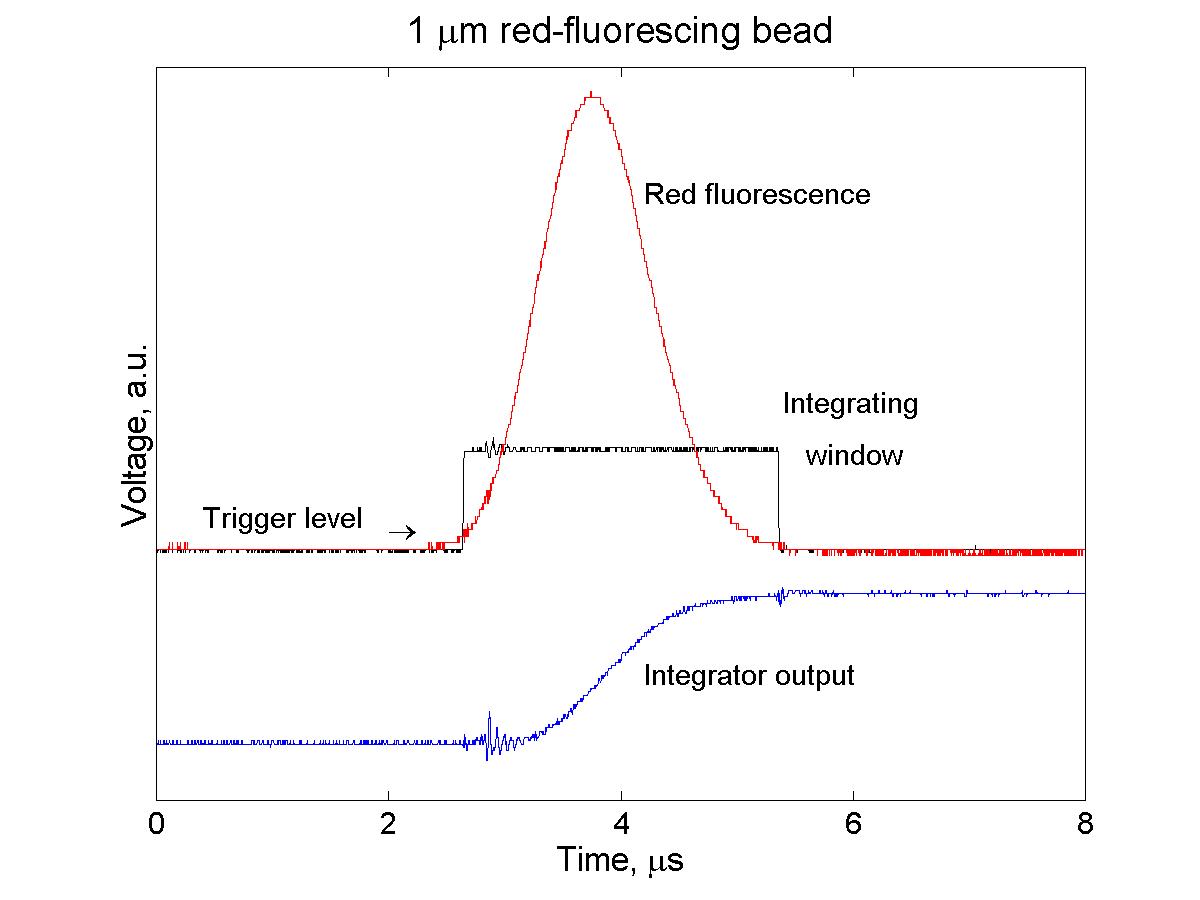
Fig. 6. Integration of photomultiplier signals. Each
amplified signal is independently controlled, with its own threshold to
start and stop integration.
Results
(click on image for better resolution)
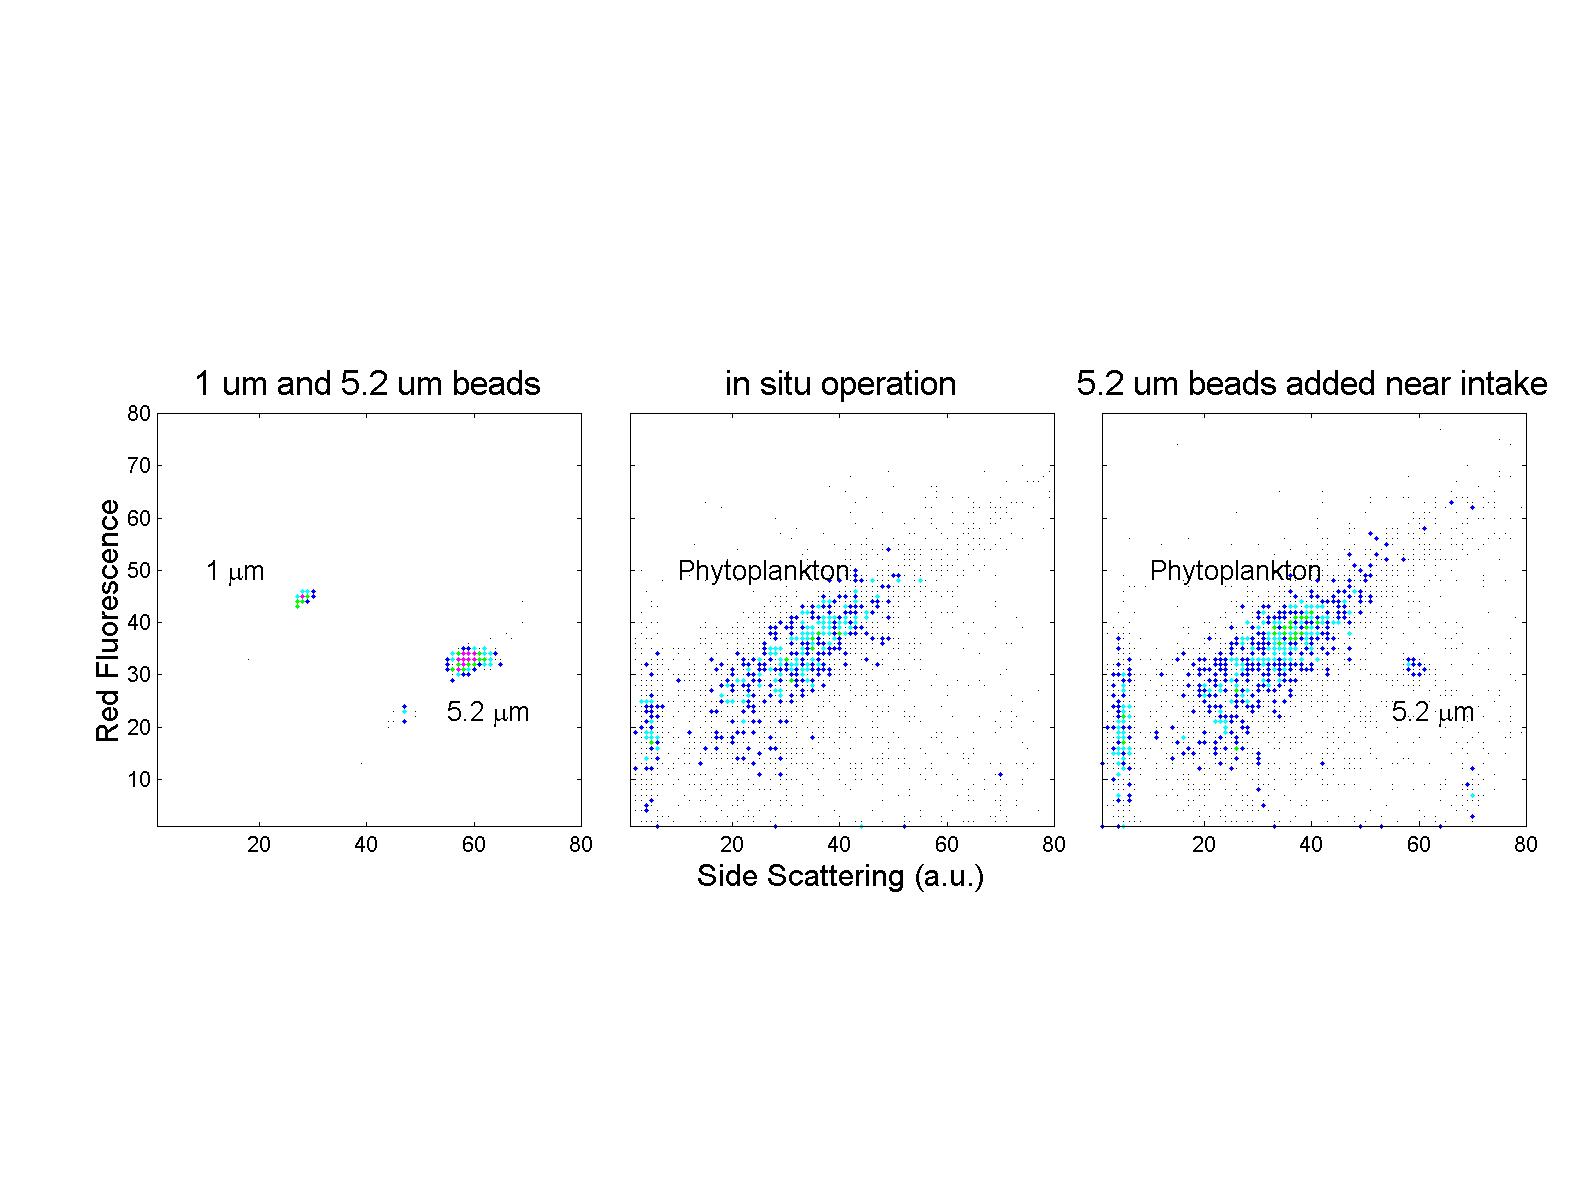
Fig. 7. In situ operation off the WHOI dock. The first
version of the instrument was pressure tested to 130 m and completed the
initial phase of field testing off the WHOI dock in January 1998.
After aligning the laser beams in the laboratory using uniform plastic
microbeads suspended in a bucket of seawater that was circulating through
the instrument (left panel), the flow cytometer was transported to the
dock and lowered into the water on a cable. After operating for a
few minutes, a suspension of 5.2 mm beads was
injected into the water near the sample intake. The in situ beads
had scattering and fluorescence signals identical to those measured in
the laboratory, indicating that alignment was stable (right panel).
We are especially encouraged by this result since it occurred despite an
abrupt temperature shift of 25 oC.
(click on image for better resolution)
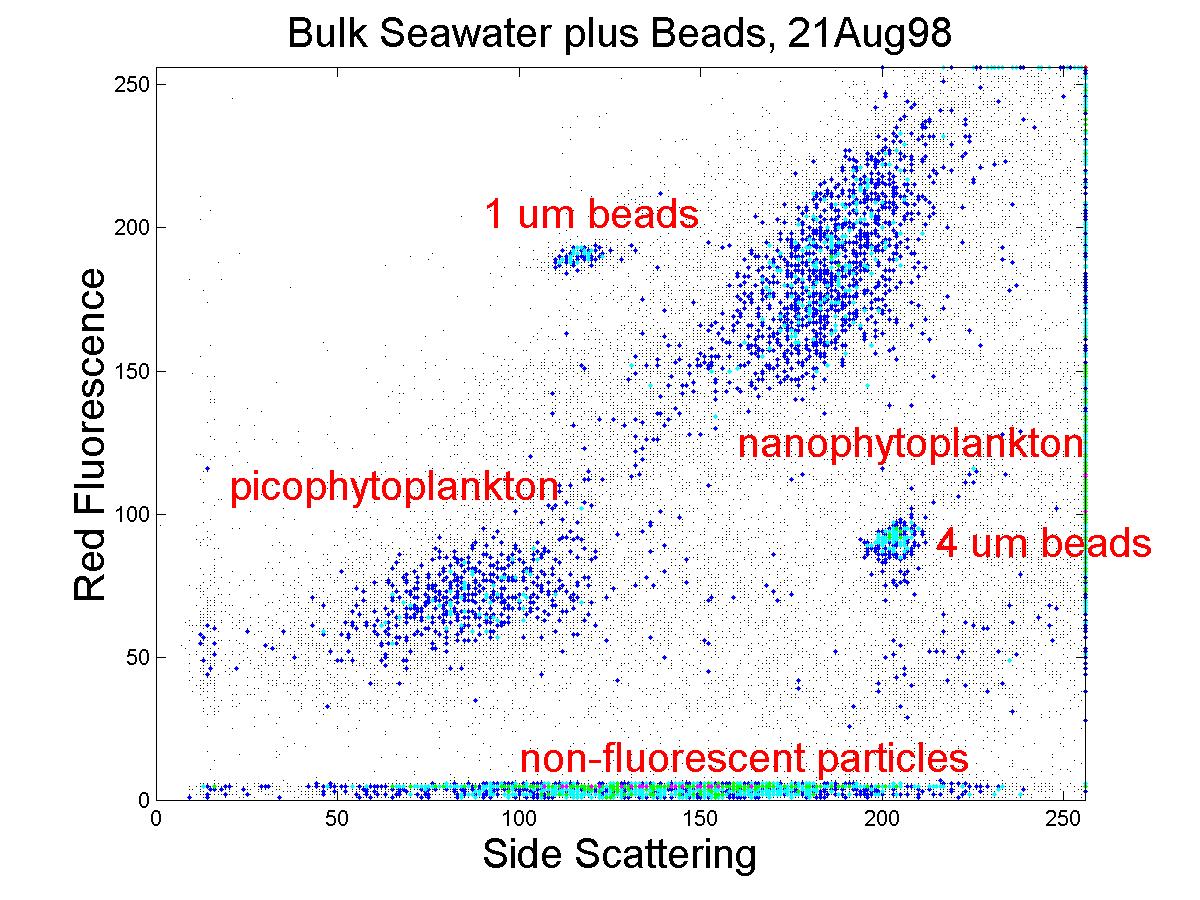
Fig. 8. Flow cytometric signature of particles from a sample
from the WHOI dock. Dynamic range was increased compared to
the in situ dock test, by splitting each signal for simultaneous amplification
at 2 different gain settings. In this test, the gains are offset
by 25-fold. When we replace the current PMTs by new ones with improved
signal:noise characteristics, this factor can be increased. Dynamic
range of more than 4 decades should be achievable with this approach (for
comparison, the modified EPICS, using 2 detectors and log amps for each
parameter measured, has a range of about 5 decades).
Interpretation
Calibration of particle concentration is necessary because the number
of particles detected depends on the volume flow rate through the sensing
region defined by the intersection of the two IR laser beams. This
volume flow rate will depend on both the rate of pumping of sample through
the instrument (by the adjustable MicroPump), and on the size of the
laser spots, which can be adjusted to vary the sensitivity.
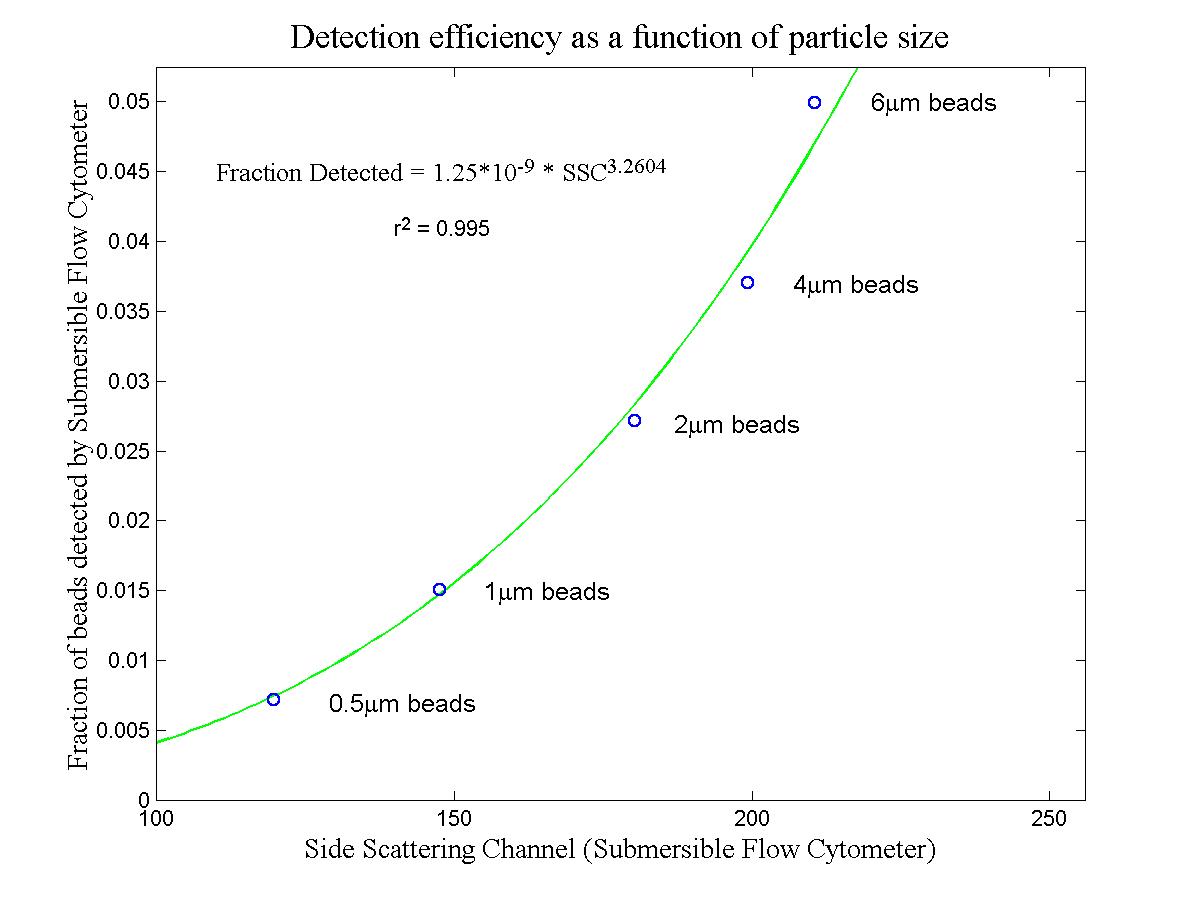
As a consequence of the Gaussian intensity profiles of the IR beams,
larger particles are more likely to be detected than small particles: A
small particle must pass through the central, most intense part of the
IR beam to produce a signal above threshold, while a larger particle may
do so even if it passes through the outer edge of the beam. This
means that a size-dependent correction is necessary to obtain particle
concentrations. We can empirically derive a correction algorithm
by analyzing known mixtures of particles, as illustrated here for beads
from 0.5 to 6 mm in diameter.
This size dependence of sampling efficiency can be viewed as an advantage
(when calibrated) because in most cases flow cytometric analyses of phytoplankton
are limited by the relative rarity of large phytoplankton, which are usually
far less abundant than small cells. With this approach, the data
collected will no longer be determined by the numbers of the smallest cells,
but will be more closely related to biomass.
(click on image for better resolution)
Fig. 9. Detection efficiency as a function of particle size (as
indicated by green beam side scattering). A mixture of 5 kinds of
beads was analyzed by conventional flow cytometry (Coulter EPICS modified
for large dynamic range, with a 488 nm argon ion laser) and by the submersible
flow cytometer in the laboratory.
(click on image for better resolution)
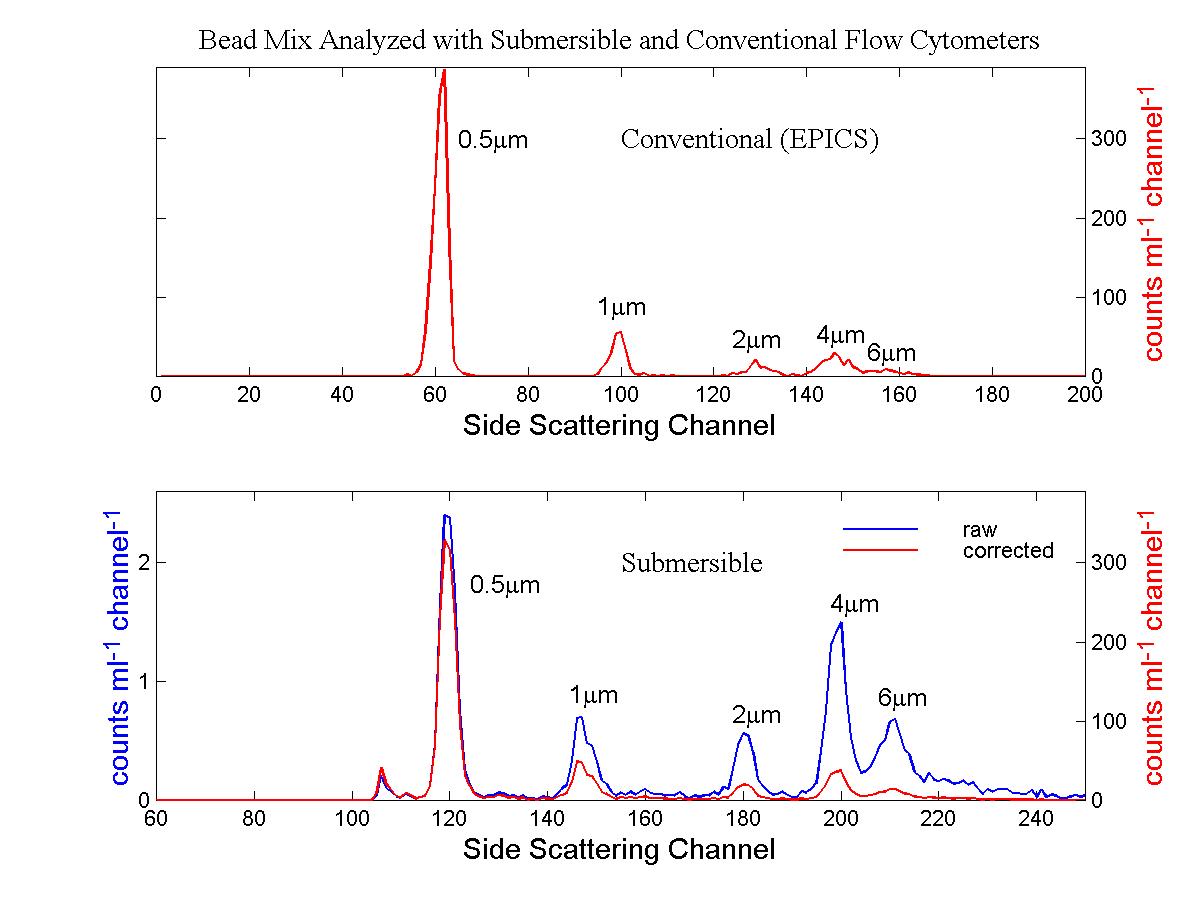
Fig. 10. Side scattering signals from the bead mixture.
The size-dependent correction was applied to the raw data from the in situ
flow cytometer.
(click on image for better resolution)
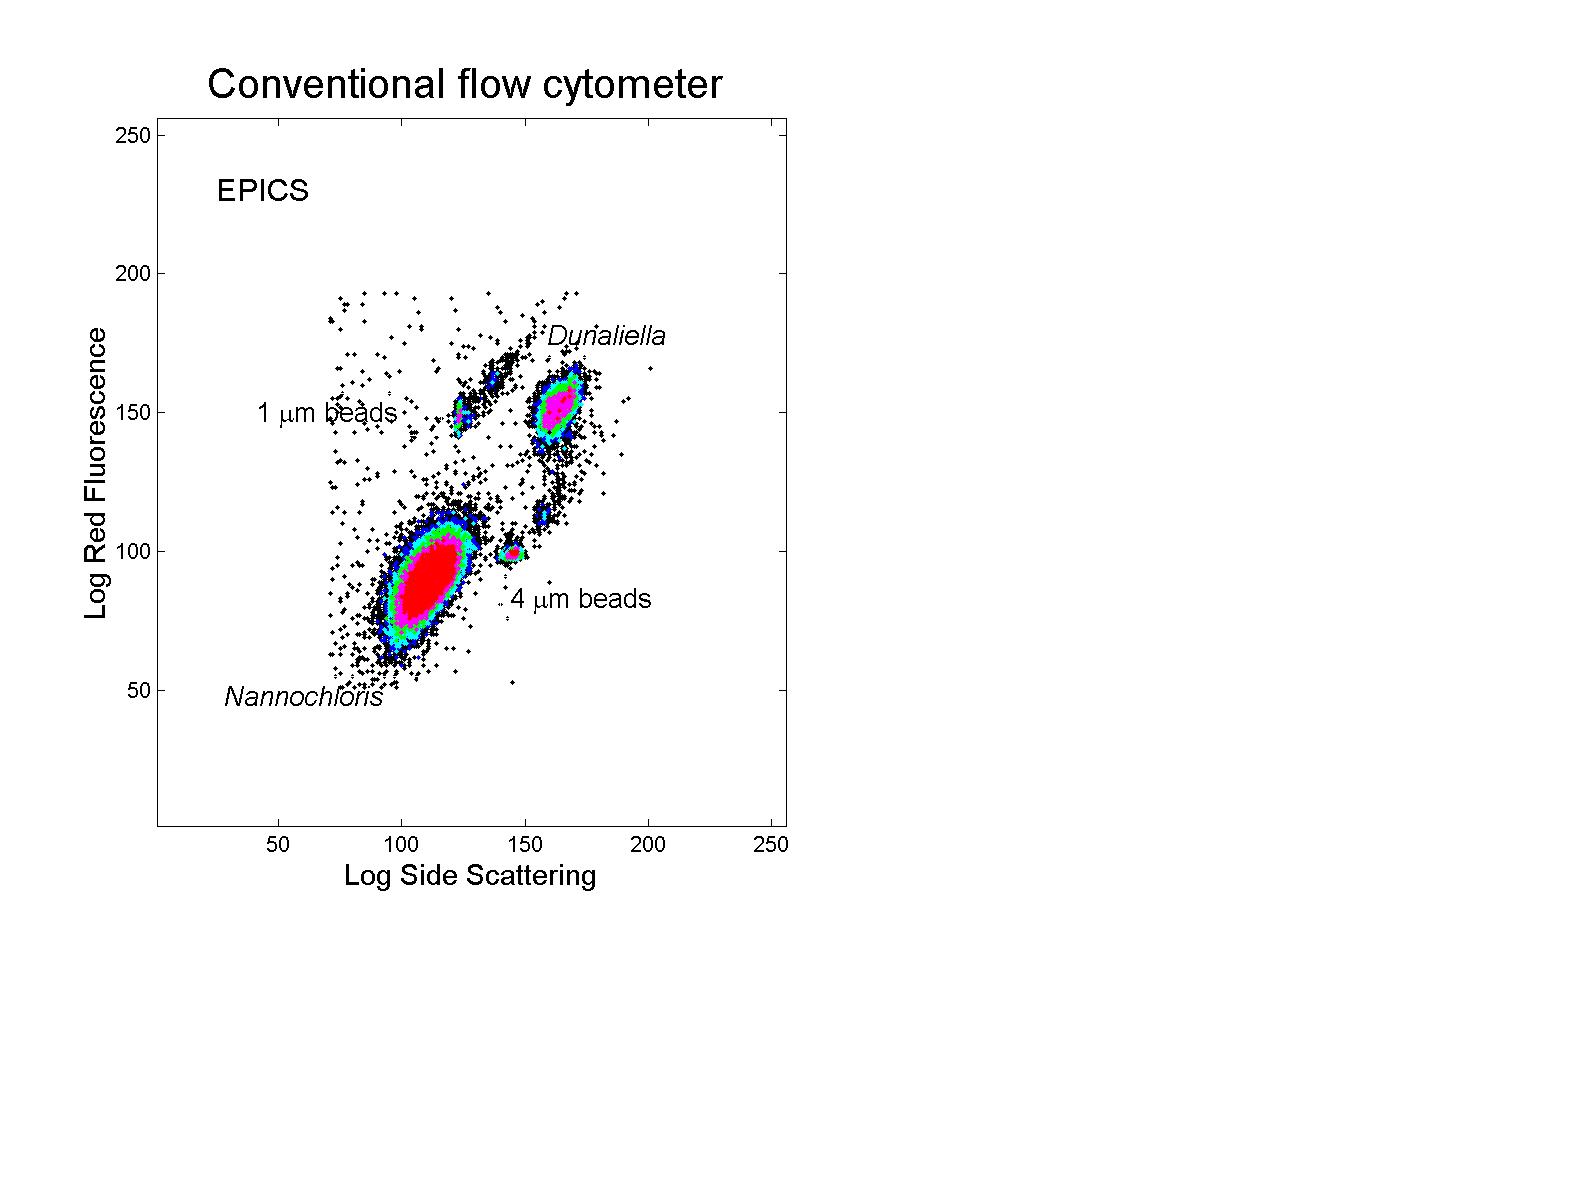
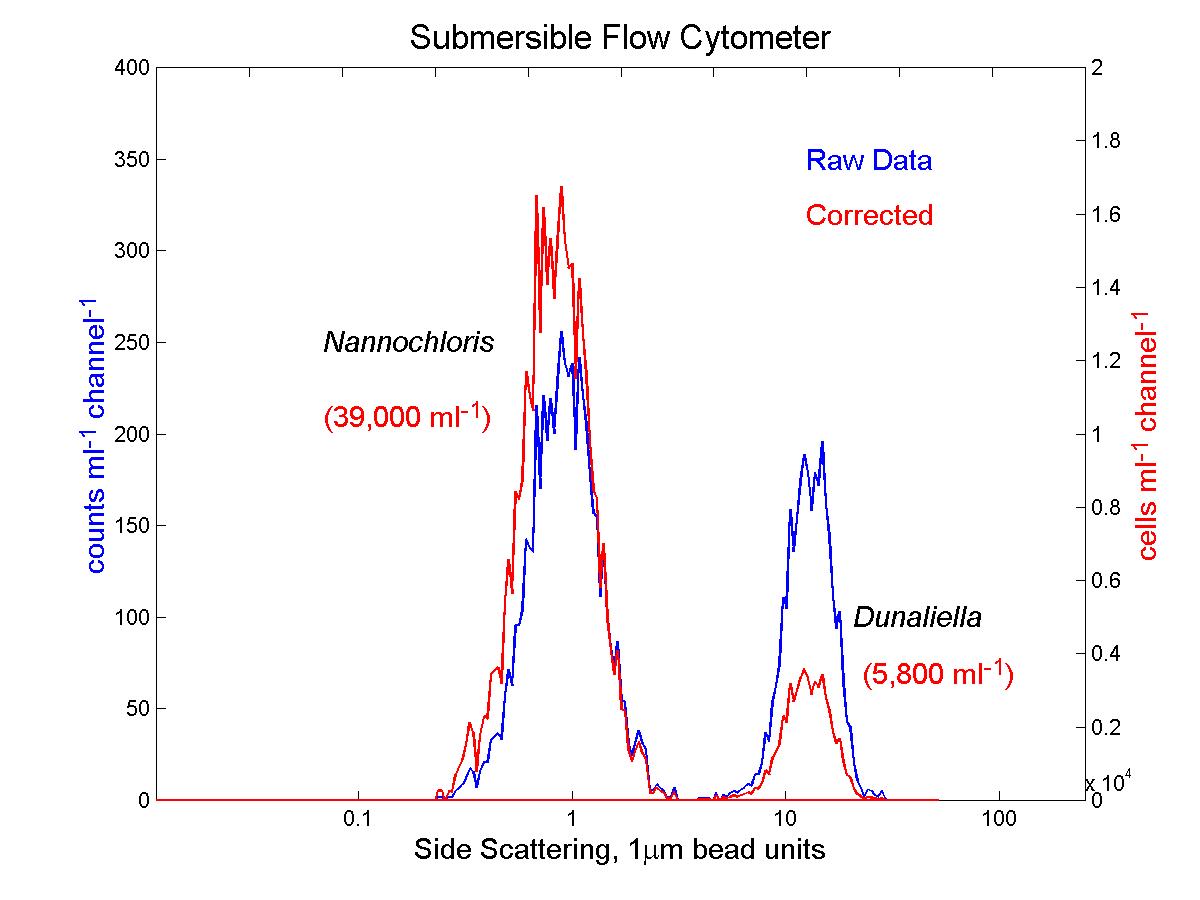
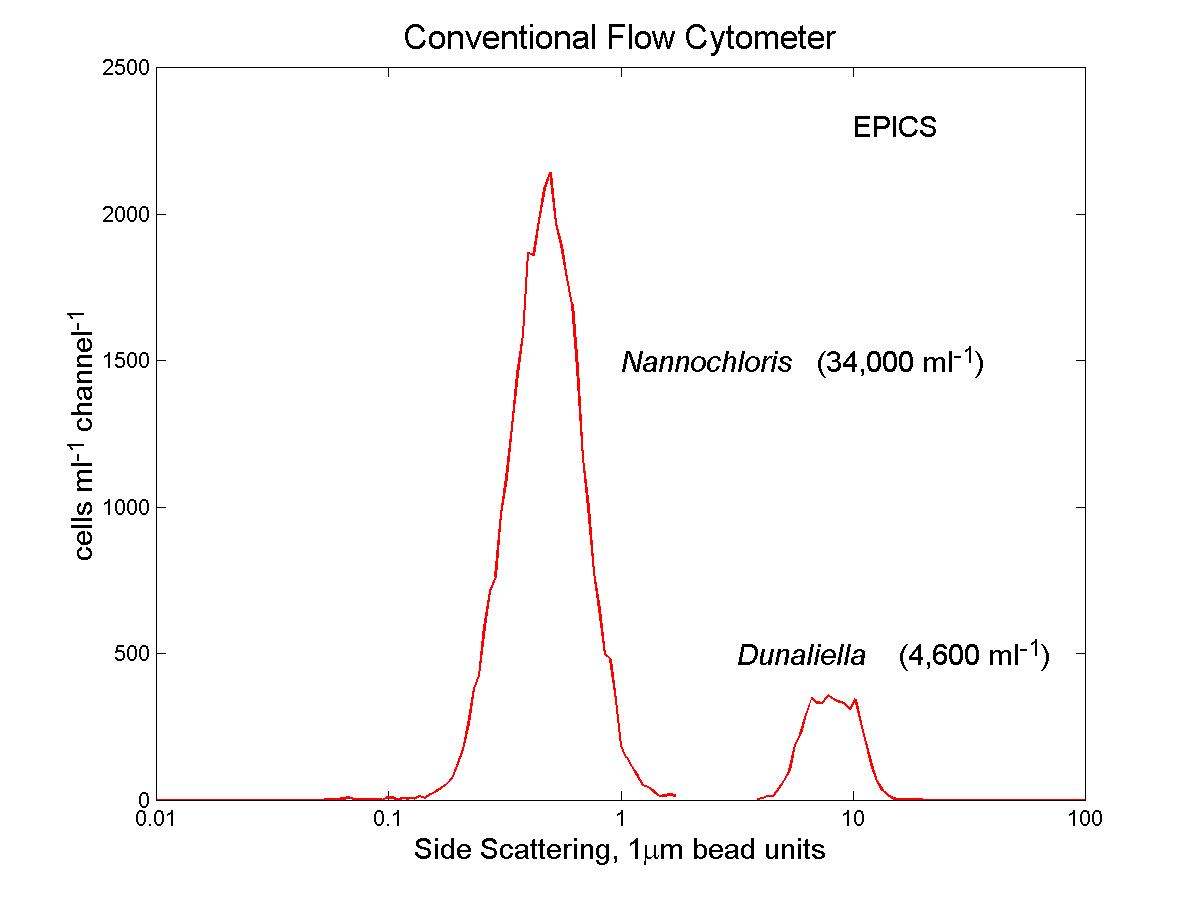
Fig. 11. Analysis of phytoplankton cultures. Cultures of
Dunaliella tertiolecta (8 mm diameter) and Nannochloris
sp. (2-3 mm diameter) were analyzed with the
conventional (EPICS) and submersible flow cytometers. The submersibles
raw data overestimates the concentration of the larger cells relative to
the smaller ones. After application of the correction derived from
the bead mixture described earlier, the data is in good agreement with
that of the conventional flow cytometer (see Fig. 12).
(click on image for better resolution)
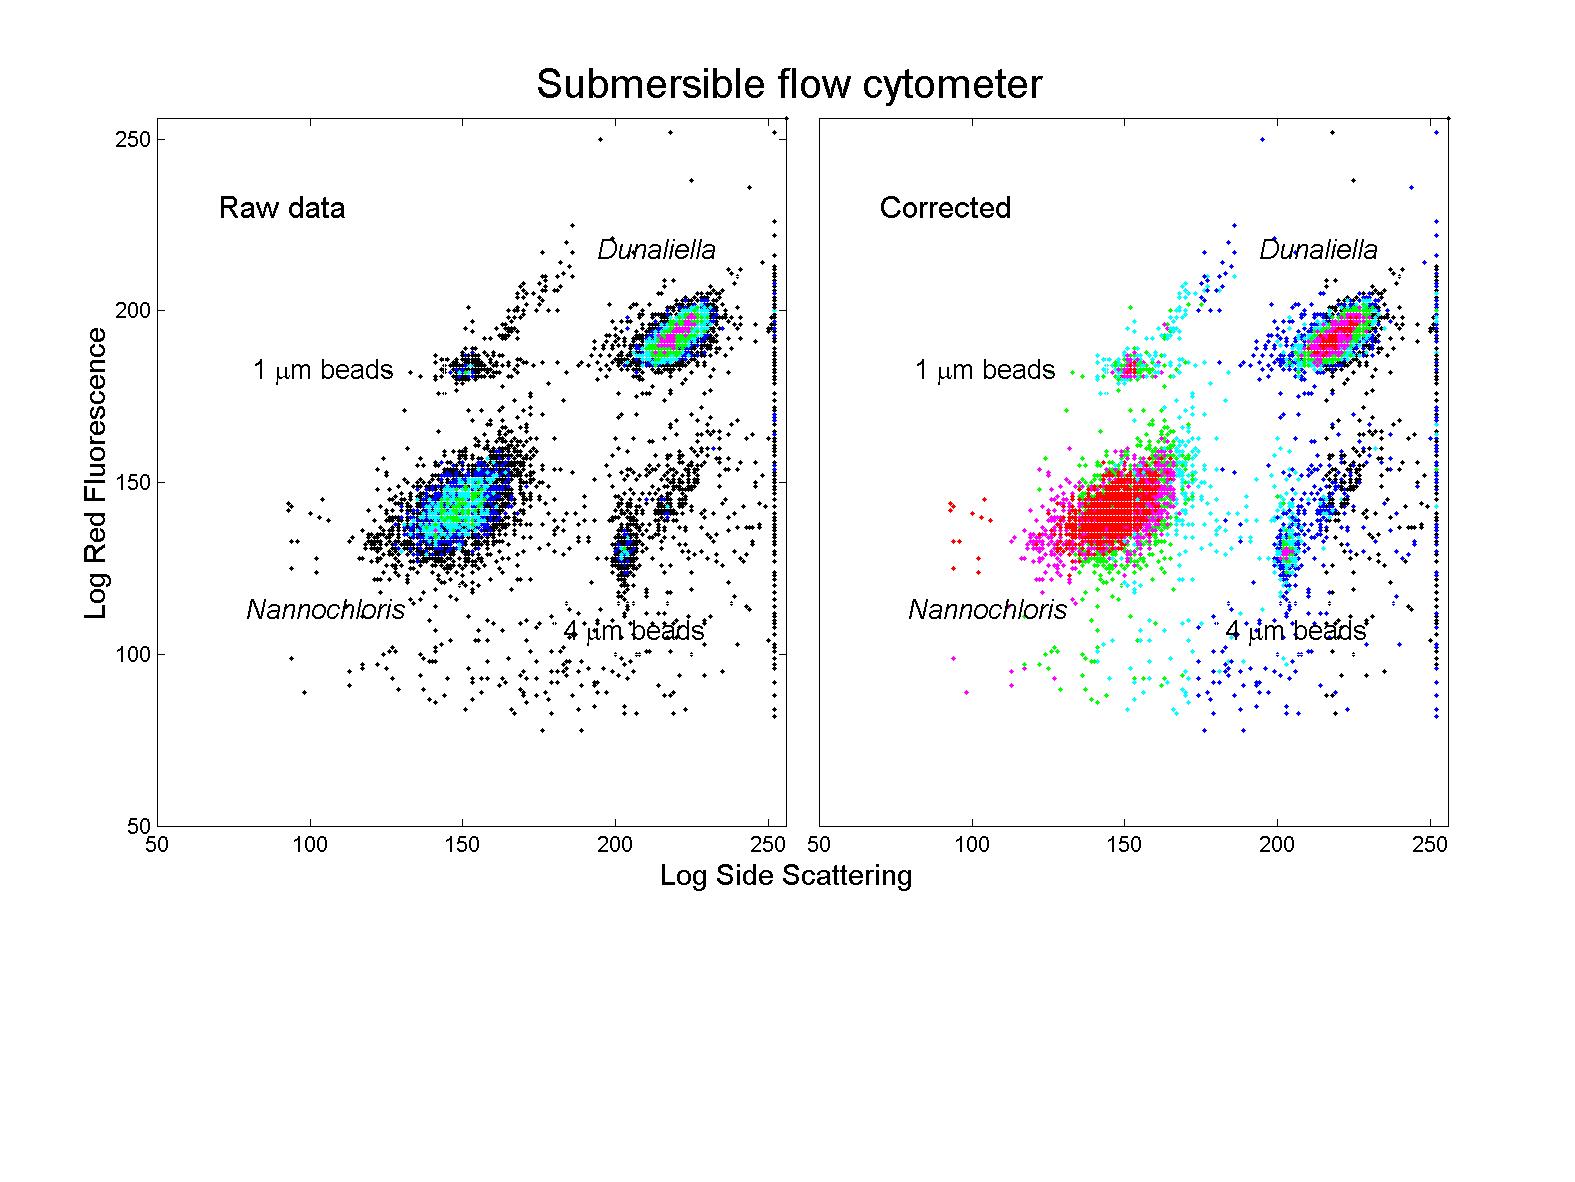
Fig. 12. Distribution of side scattering signals from phytoplankton
culture samples. The size-dependent correction applied to the raw
data from the in situ flow cytometer (left panel) brings the results close
to those from the conventional flow cytometer (right panel).
(click on image for better resolution)
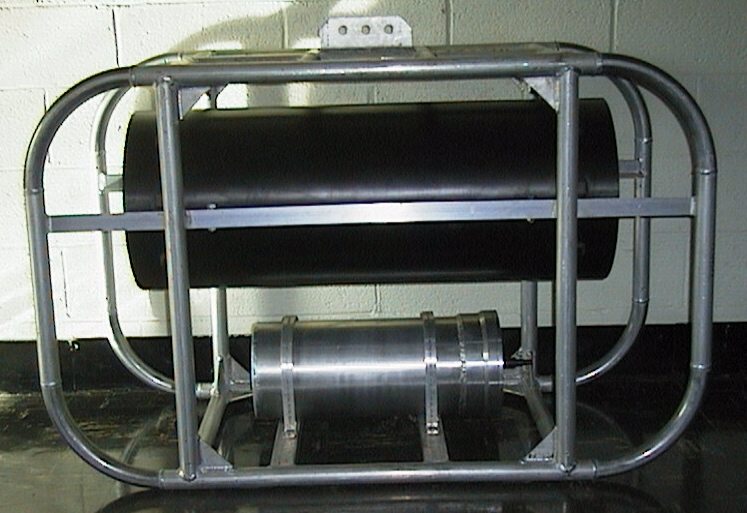
Fig. 13. Submersible flow cytometer in its frame, with battery
case below).
(click on image for better resolution)
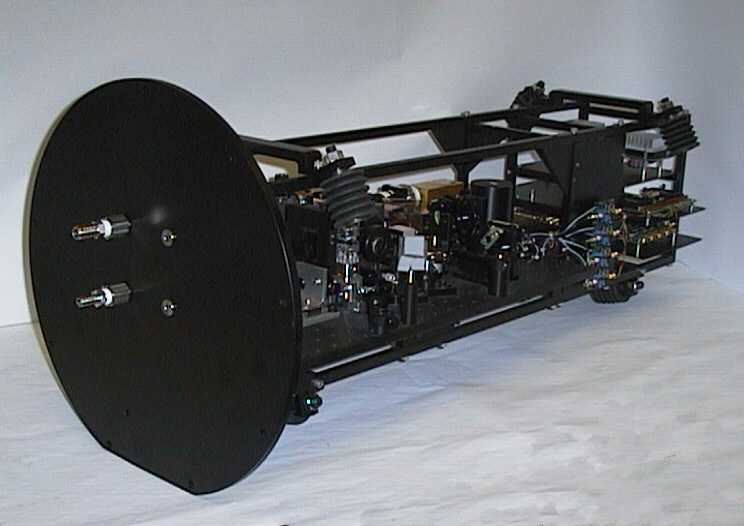
Fig. 14. Housing removed to show optical bench and electronics.
(click on image for better resolution)
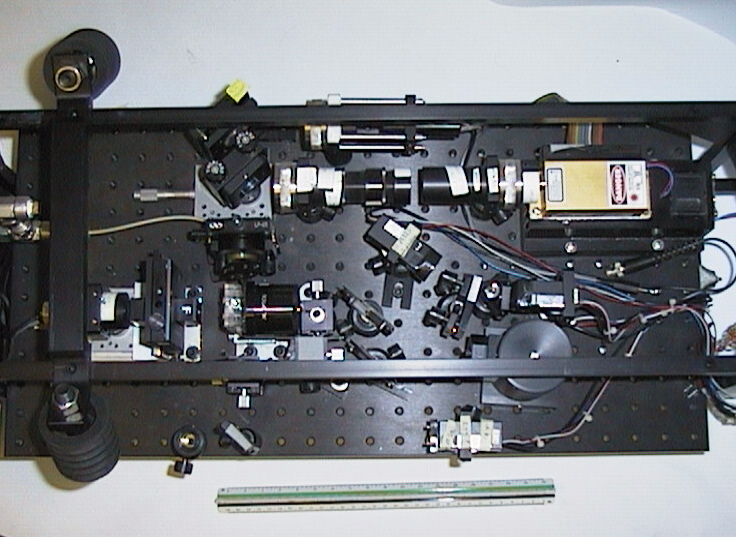
Fig. 15. Top view of optical bench.
Future Directions
Over the next few months, we will continue testing the instrument
off the WHOI dock to evaluate laser beam and flow stability. We also
need to implement mechanisms for injecting bead mixtures for calibration
and cleaning solutions to prevent fouling. We then plan to deploy
the in situ flow cytometer at the LEO-15 mooring (which can supply power
and transmit data to shore) off New Jersey, to examine time series data
of phytoplankton and other particles in the coastal environment.
We also envision a ship-based version of the flow cytometer to continously
analyze phytoplankton in samples from the ships intake or from sample
water pumped from a SeaSoar vehicle.
Go back to Olson Lab Homepage