Justin Small, Dr Bob Hornby, Dr Mark Prior and Dr John Scott
Oceanography, Defence Evaluation and Research Agency (DERA)
Winfrith Technology Centre, Dorchester DT2 8XJ, UK
e-mail: jsmall@taz.dera.gov.uk
Justin Small, Dr Bob Hornby, Dr Mark Prior and Dr John Scott
Oceanography, Defence Evaluation and Research Agency (DERA)
Winfrith Technology Centre, Dorchester DT2 8XJ, UK
e-mail: jsmall@taz.dera.gov.uk
1. Introduction
Internal solitary waves have been frequently observed in the ocean, and are often generated by the non-linear deformation of internal tides [1]. The waves are often termed solitons, in analogy with the waves discussed by Zabusky and Kruskal [2]. Oceanic internal solitons vertically displace the thermocline and cause internal currents, with near-surface flow convergence and divergence [3]. The latter effects can modulate the sea-surface roughness on small length-scales (O(1cm-10 cm)), which can be imaged by radar such as satellite-borne Synthetic Aperture Radar (SAR) [4]. SAR consequently appears to be an attractive method for predicting solitons, due to its ability to show the complete 2D surface distribution of wave-packets. Its disadvantages include the present infrequent repeat-cycle of satellite SAR (typically 20-30 days), and the masking of internal wave signatures at high wind speeds (e.g. 10m/s or above).
This paper summarises the results from an international collaborative experiment involving DERA which investigated the effects of internal solitons at the shelf-edge, and tests the possibility of making accurate predictions of phase speeds and amplitudes from SAR.
2. KdV Solitons
The observed internal waves in SAR will be modelled in terms of the first order Korteweg de Vries equations. Although this theory clearly has limitations, in its assumptions that the waves are small amplitude, long wavelength and in shallow water, its simplicity allows for the rapid interpretation of SAR signatures, and the results will be assessed below.
The steady soliton solutions predicted by KdV are given by [1]
![]() Eq. 1
Eq. 1
Here h 0 is the maximum
displacement, x and t are range and time respectively, xc
is the soliton central position, and L (the soliton half width)
and c1 (the soliton phase speed) are given by
 Eq
2.
Eq
2.
where c0, a and g are the linear phase speed, and parameters of non-linearity and dispersion respectively, (defined in [1], also in Pelinovsky et al, this workshop) strongly dependent on the stratification and water depth respectively. These equations demonstrate the well known dependence of amplitude on width L, and phase speed on amplitude
The internal currents can also be obtained by the approximation to the continuity equation
![]() Eq. 3
Eq. 3
The surface currents induced by the soliton give rise to the areas of convergence and divergence which can modulate the surface roughness in the capillary-gravity range which is imaged by SAR. (see section 4 below). Of particular note is the range D between convergence and divergence, which in suitable circumstances can be measured from SAR. A fixed relationship between D and L is given simply by [5]
D=1.32 L Eq. 4
Together with equation 2 this gives a means of estimating amplitude
and phase speed from the distance D on SAR signatures.

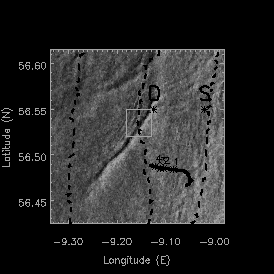
Figure 1. Close up of an ERS-1 SAR image of 20th August
1995, 1136 UTC,
indicating the 160m, 600m and 1000m bathymetry contours
(dashed lines,
from right to left respectively, from swath surveys),
together with the ship
survey track on 19th August (solid black line), two
mooring positions S
and D, and the box used to derive a SAR profile across
the leading
wave (section 4).
3. SESAME- Internal solitons at the Continental slope/shelf-edge.
In August-September 1995 and August 1996 the Shelf Edge Study Acoustic Measurement experiment (SESAME) took place on the Malin shelf-edge, on the North-West UK shelf margin [5]. The experiment coincided with the NERC SES experiment, and a large complementary dataset of remotely sensed and in-situ measurements was gathered.
Figure 1 shows a close-up from an ERS-1 SAR image (20th August 1995,
1136 UTC) of the SESAME region. A prominent internal wave can be seen approaching
the shelf edge, with the characteristic signature of an internal soliton
of depression, with weaker undulations trailing it. Overplotted on Figure
1 is the tow-track of the survey vessel RV Colonel Templer from 0100 to
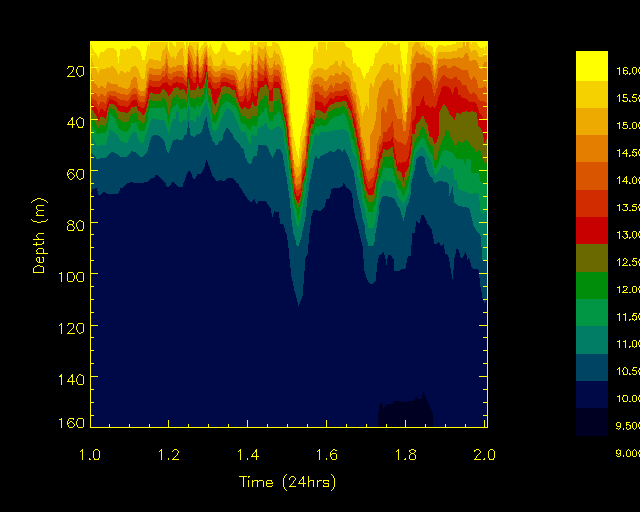
0200 UTC on the 19th August. The data gathered by towed thermistor chain
is shown in Figure 2, and indicates the presence of a packet of four internal
waves of depression, rank ordered in amplitude, the leading wave being
a solitary wave with an amplitude of displacement of -49 m. On the survey
track in Figure 1, the positions where the waves were measured are marked
1-4, from the leading wave to the back of the packet respectively. It seems
likely that the waves in Figure 2 are of the same type as the internal
bore and undulations seen in Figure 1.

Figure 2. Thermistor chain cross-section of temperature
(° C) through internal wave
packet over Continental slope. Total water depth 400
m.
The phase speed of the waves has been derived independently by two methods
1. Comparing the SAR image in Figure 1, and an ERS-2 image 24 hours later showing a similar feature
2. Comparing the positions of the wave signatures in Figure 1 with the positions of the waves when measured by thermistor chain.
Here the assumption is made that the bore is regenerated every 12.4
hour M2 tidal cycle. The phase speed is then deduced by noting the distance
between the wave positions, and the difference in tidal phase. These methods
gave consistent values of phase speed between 55 and 65 cms-1,
confirming that the signatures are of the same feature, which propagates
from deep on the slope towards the shelf edge, evolving into a set of large
amplitude internal waves.

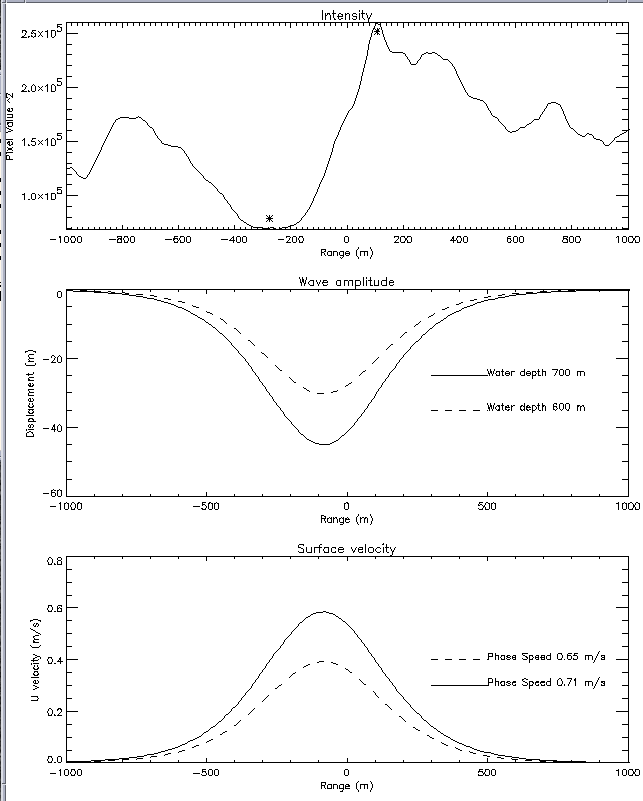
Figure 3. Profile of ERS image intensity across the
internal wave (top), and the equivalent
KdV soliton amplitude (middle) and surface current
(bottom). Solid line: wave at 700 m
water depth, dashed: in 600 m water depth.
4. Prediction from SAR
Figure 3 (top) illustrates a profile of image intensity perpendicular to the leading wavefront in Figure 1. The profile has been produced by averaging in the along-front direction over the box shown in Figure 1, to remove image speckle, without removing important length-scale information in the cross-front direction.
From the image intensity profile the peak and trough associated with the leading internal wave was identified (range positions marked with asterisks), and used to give the distance D defined above. From this the half width L of the equivalent KdV soliton was derived.
As discussed above, knowledge of the soliton half width and of the background environmental conditions allows an estimate of wave amplitude to be made. For this case, the basic 1 km geolocation accuracy of ERS-SAR enabled the water depth of the measurements to be calculated as between 600 and 700 m (see Figure 1). The environmental parameters of linear phase speed, and coefficients a and g were determined from coincident survey data and are listed in Table 1. Using this information, and equations 1-4, the wave amplitude was estimated for the two possible water depths , and the result is plotted in Figure 3(middle). Assuming the deeper water depth, an estimate of 45 m for the wave amplitude was derived, close to the observed value. For the shallower depth of 600 m, an amplitude of 30 m was calculated.
The soliton theory also allows estimation of surface velocity and phase speed. these are illustrated in Figure 3 (bottom). An important point here is that the surface velocity approaches the phase speed, implying that these are large finite amplitude waves which may be subject to turbulent processes and breaking. The large surface currents of O(0.5 m/s ~ 1 knot) explain why the wave has a striking signature on the SAR image. Further, the estimates of phase speed are close to the observations, indicating that this method may be used to predict the soliton position forward in time.
Table 1. Environmental parameters (coefficients of
the KdV equation) for period
19-21 August, for three water depths, from SESAME
survey data. c0 is the linear
phase speed, a is the non-linear
coefficient, and g is the dispersive coefficient.
The values were derived for the first mode solution
to realistic density stratification.
| Water Depth | C0 | a | g |
| 400 | 0.48 | -0.016 | 1535 |
| 600 | 0.5 | -0.015 | 3202 |
| 700 | 0.51 | -0.014 | 4449 |
Conclusions and Discussion
The SAR prediction method gives a good estimate of wave amplitude and phase speed from the across-wavefront lengthscales. However, in practice the estimate is sensitive to the following two factors:
· The knowledge of water depth, as one of the environmental parameters (g ) is critically dependent on depth. This is particularly important in shelf-edge regions.
· The measurement of the peak-trough distance D, and the related half width L. As the soliton amplitude is inversely proportional to the square of the half width, small changes in half width measurement lead to large changes in amplitude prediction.
In the example shown here, the phase speed estimate was less critically dependent on these two factors (as the coefficient a , which is related to the nature of the stratification, changes little). Consequently it seems that the method may be used to forecast the likely position of the wave, and give an order of magnitude (within a factor of two, say) estimate of the amplitude.
It should be noted, of course, that the type of signature of internal waves illustrated in Figure 1 (namely the bright and dark banding) does not always occur, especially in the presence of natural surface slicks [6]. The single sign signatures [7] produced in these other circumstances will need to be treated differently, and this is an area of future work.
A final point of interest is that the KdV soliton solution appears to well describe a wave of amplitude -49 m on a background thermocline which only extends to 60-80 m. Clearly the wave is finite (i.e. large) amplitude, and so the KdV solution (to first order in wave amplitude) should not be valid. However, detailed analysis of the thermistor chain data (see Annex and [5]) confirms that the wave shape is that of a KdV soliton. The question of why this solution is suitable for waves of such large amplitude remains open.
Related Work at DERA
The non-linear interactions of internal solitons, as observed in SAR imagery, is being studied using a three-dimensional CFD code and being compared to previous analytical results. Preliminary results indicate that the observations confirm the analytical predictions of Mach-stem formation due to phase shifts, and that the CFD code can be used to model complex three-dimensional interactions.
The effects of internal solitons on acoustic propagation has been studied
using a simple surface duct propagation model. Results show that the typical
internal solitons observed near shelf-edges in summer thermocline environments,
which are solitons of depression, act to reduce diffraction leakage out
of the duct due to deepening of the surface mixed-layer. Consequently this
increases the range of acoustic frequencies which can be trapped in the
duct. These results have been incorporated into a software demonstrator
that takes a SAR image as input, and outputs estimates of internal wave
amplitude and of the duct leakage.
References
[1] Ostrovsky, L A and YU A Stepanyants. Do internal solitons exist in the ocean, Rev of Geophysics, 27, pp293-310,1989
[2] Zabusky N J and M D Kruskal (1965) ?Interaction of solitons in a collisionless plasma and the recurrence of initial states?, Phys Rev Letters, 15, 250-243, 1965
[3] Alpers, W. Theory of radar imaging of internal waves, Nature, 314,pp 245-247, 1985
[4] Gargett, A. E. and Hughes, B. A. (1972) ?On the interaction of surface and internal waves?, Journal of Fluid Mechanics, 52(1), 179-191.
[5] Small J, Hallock Z, Pavey G and J Scott. ?Observations of large amplitude internal waves at the Malin shelf-edge during SESAME 1995?, submitted to Continental Shelf Research, 1998.
[6] Ermakov SA, Salashin S G, and A R Panchenko. ?Film slicks on the sea surface and some mechanisms of their formation?, Dyn. Atm Oceans, 16 (1992), 279-304
[7] DaSilva et al.? Role of surface films in ERS SAR signatures of internal waves on the shelf 1. Short period internal waves?, J Geo Res, 103, C4, 8009-8031, 1998
Annex. Is the wave a soliton ?
Finally, the following question may be asked: was the solitary wave
really a KdV soliton, or did the method give good predictions by chance,
for a non-soliton wave ? This has been checked, by detailed analysis of
the thermistor chain data. Using information on the wave speed and direction
from the observations, it is possible to remove the Doppler shift due to
ship towing through the internal wave. This has been done in Small et al
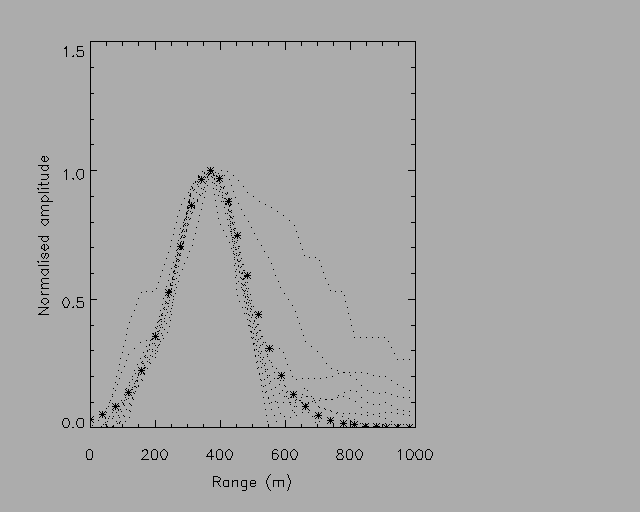
1998. Figure 4 shows an illustration of the results: here the displacement
curves for a selection of isotherms have been normalised to unity and overplotted
as a function of true range. Overplotted as asterisks is the KdV solution
for a wave of -49 m in a water depth of 400 m, again using coincident survey
data to provide the environmental parameters. The close fit of the KdV
solution and the observations for the majority of the displacement curves
indicate that the wave has soliton characteristics.

Figure 4. Profiles of normalised amplitude as a function
of range for the lead wave in Figure 2,
corrected for Doppler-shifting. Dotted lines are the
normalised amplitudes of displacement for
selected isotherms, and the asterisks are the KdV
solution for a wave of -49 m amplitude.
Unresolved question
Observed mooring records sometimes have the appearance of classic internal tide bores (or ?solibores?), and at other times in the same location appear random (e.g. at the moorings S and D shown in Figure 1). The latter effect may be due to the influence of more than one internal wave source, together with the complex interaction phenomenon this implies. The question is: is it worthwhile to model the waves deterministically ? this is linked to the question: for how many tidal cycles can predictions based on one SAR image be valid ? (In the SESAME results above, the internal wave pattern repeated itself for at least 5 cycles).
British Crown Copyright 1998/DERA
Published with the permission of the Controller of Her
Brittanic
Majesty's Stationary Office.