Phytoplankton patchiness and high-frequency internal
waves
Cleridy E. Lennert-Cody and Peter J. S. Franks
Marine Life Research Group
Scripps Institution of Oceanography
La Jolla, California, 92038-0218, USA
clennert@iattc.ucsd.edu
pfranks@ucsd.edu
Long, narrow sea surface slicks associated with internal waves are common
features of exposed coastal environments. Such slicks, which may be accompanied
by foam or debris, also have been shown to be associated with high concentrations
of many types of planktonic organisms. Shanks (e.g., 1983, Mar.
Ecol. Prog. Ser., Vol. 13) proposed that organisms in these sea-surface
slicks are concentrated by currents associated with the internal waves.
Although most observations have been made near the sea surface, recently
published data suggest that the effects of internal waves on the distribution
of the plankton and small fishes may extend throughout the water column.
Still, the magnitude of internal wave-induced changes in the concentration
of planktonic organisms and its relationship to the physical forcing remain
largely unexplored. Using a low order analytical model we predict the effects
of high-frequency internal waves on the patchiness of planktonic organisms
within the water column, and test those predictions using field data.
Simple model predictions for high-frequency interfacial waves suggest
that organisms that swim vertically, in opposition to the physical flow,
will experience ephemeral changes in concentration throughout the water
column as a wave passes. Previous modeling studies of surface-trapped particles
have shown that the maximum concentration should occur over the trough
of the wave. Using two interfacial wave profiles, a small-amplitude wave
and a weakly nonlinear wave, we also find that increases in the concentration
of planktonic organisms within the upper layer are predicted to occur over
the wave trough. That is, changes in concentration of planktonic organisms
within the upper layer are predicted to be out of phase with displacements
of the interface. Within the lower layer, the perturbations are predicted
to be in phase. The maximum wave-induced increase in concentration is predicted
to increase linearly with either the wave amplitude or the wave period,
depending on the swimming behavior. Maximum increases in concentration
are predicted to be less than twice the background concentration.
To compare field data to these model predictions, we have computed estimates
of along-isotherm fluorescence, along-isotherm beam attenuation coefficient
and isotherm depth. If organisms behave completely passively, then on short
time scales we would expect the organisms to be advected with the water,
similar to temperature. That is, we would expect no coherent relationship
between along-isotherm concentration anomalies and isotherm displacements.
Data were collected using a profiling CTD\fluorometer\transmissometer instrument
package during the spring and summer of 1997 in depths of 30 m or less
off Mission Beach California. Spring sampling occurred during a bloom of
dinoflagellates, including Lingulodinium polyedrum, Ceratium
spp.
and Prorocentrum spp. Profiling data were collected at a fixed station
for up to 6 hours at a time. During the summer, profiling data were also
collected by sampling at a near-surface drifter, drogued at 0.5-1.5 m.
High-frequency internal waves with periods less than 30 minutes were often
observed, sometimes accompanied by high-frequency changes in the level
of fluorescence (Fig. 1).
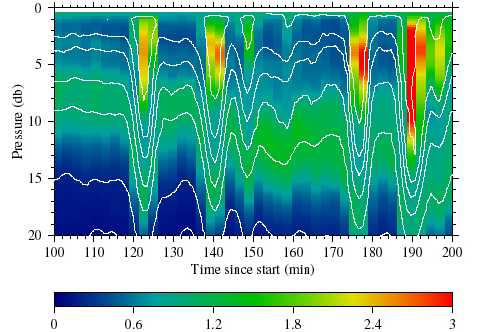
Figure 1. Fluorescence (color image; in µg/l) and
temperature (1 ºC contours; 11-17 ºC) for profiling data
collected on April 17, 1997 in 30 m water depth. Vertical
sampling resolution is approximately 0.5 m;
horizontal sampling resolution is approximately 1 min.
The horizontal axis shows time in minutes from
the start of sampling. The vertical axis shows pressure
(db). Fluorescence and temperature have been
smoothed slightly using linear interpolation.
Our analyses so far show that temporal variability in the relationships
between along-isotherm fluorescence, along-isotherm beam attenuation coefficient
and isotherm depth are often consistent with model predictions of high-frequency
internal wave-induced changes in the concentration of planktonic organisms.
Estimates of the phase relationship between along-isotherm fluorescence
and isotherm depth at periods between 5-30 minutes suggest that these quantities
are often out of phase in the upper part of the water column, with a possible
phase shift deeper down (Fig. 2). This general pattern holds for both spring
and summer; however, there is a considerable amount of day-to-day variability,
particularly in spring. Although the phase relationship between along-isotherm
beam attenuation coefficient and isotherm depth was more variable, at periods
between 5-30 min, along-isotherm fluorescence and along-isotherm beam attenuation
coefficient were approximately in phase throughout the water column. For
data collected in a quasi-Lagrangian sampling mode, depressions of isotherms
often corresponded to localized maxima in along-isotherm fluorescence indicating
that increases in fluorescence were occurring over the trough of the waves
(Fig. 3). Also associated with some isotherm depressions were localized
increases in the along-isotherm beam attenuation coefficient. Cell counts
computed for water samples collected during the spring suggest that high-frequency
variability in fluorescence at a fixed depth can be due to changes in the
concentration of swimming dinoflagellates. More extensive testing of the
model predictions is currently being done using data from individual internal
wave events.
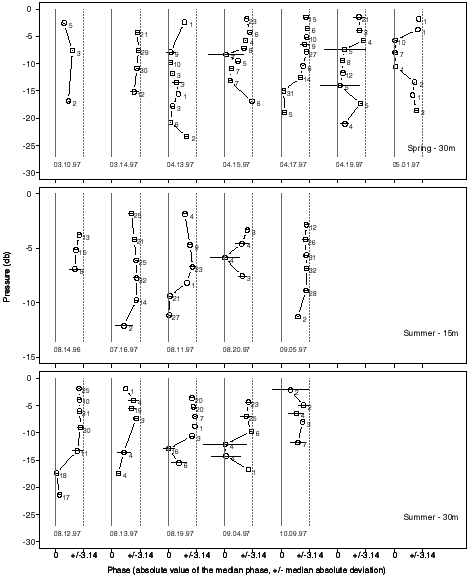
Figure 2. Waterfall plots showing the phase relationship
between along-isotherm fluorescence and isotherm depth versus the median
isotherm depth on 17 days during spring and summer of 1997. Open
circles correspond to the absolute value of the median of phase estimates
at periods between 5-30 min. The horizontal bars indicate plus/minus the
median absolute deviation. Panels represent data collected in 30 m water
in spring (top panel), 15 m of water in summer (middle panel) and 30 m
of water in summer (bottom panel). Only phases at frequencies for which
the squared coherency was significantly greater than zero (5% level) were
used to estimate the phase in this frequency band. The number of frequencies
associated with each phase estimate is shown to the right of the point
estimate. The horizontal axis shows the phase in radians from -p
to p . Note that
p
radians for a previous profile corresponds to -p
radians for the next profile. The solid gray vertical lines correspond
to 0 radians and the dashed gray lines correspond to +/-p
radians. Dates of sampling are shown at the bottom-right of each zero line.
Our simple model would predict along-isotherm fluorescence and isotherm
depth to be out of phase (i.e., phase = p
) above the pycnocline and in phase (i.e., phase = 0) below the
pycnocline.
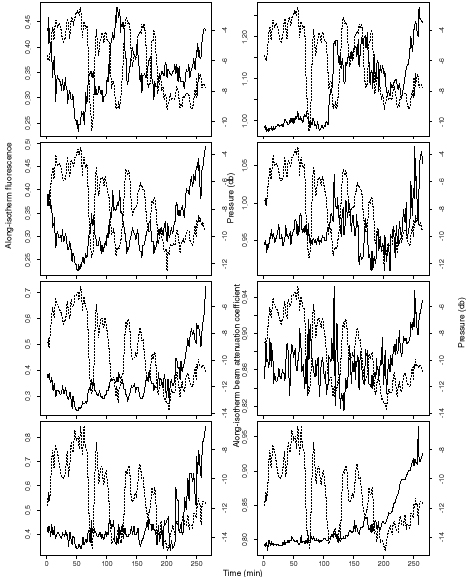
Figure 3. Median along-isotherm fluorescence (solid line,
left panel) and isotherm depth (dashed line, left
panel), and along-isotherm beam attenuation coefficient
(solid line, right panel) and isotherm depth (dashed
line, right panel) for profiling data collected at a
near-surface drifter on September 10, 1997. Isotherms for
both sets of plots were defined (from bottom to top)
using the following temperature ranges: 18.0-18.5 ºC,
18.5-19.0 ºC, 19.0-20.0 ºC, and 20.0-21.0 ºC.
The horizontal axis shows time in minutes from the start of
sampling. Vertical axes on the left show fluorescence
(µg/l) or beam attenuation coefficient (m-1 ); vertical
axes on the right show the depth of the isotherm in units
of pressure (db). Note that the scale of the vertical
axes changes from panel to panel.