Preliminary Results from Observations of Internal
Tides
and Solitary Waves in the Bay of Biscay
Frans-Peter A. Lam*, Theo Gerkema and Leo R.M. Maas
Netherlands Institute for Sea Research (NIOZ)
PO Box 59, 1790 AB Texel, The Netherlands
*) Present affiliation:
TNO Physics and Electronics Laboratory
(TNO-FEL), Underwater Acoustics,
PO Box 96864, 2509 JG The Hague, The Netherlands
e-mail: Lam@fel.tno.nl
1. Introduction
The Bay of Biscay is well known for its energetic internal tides [1].
This is caused by the combination of (summer) stratification, steep (shelf-edge)
topography and strong (cross-slope) tidal currents, especially at spring
tides [2]. The disintegration of the internal (or: interfacial) tide in
internal solitary waves (ISWs from now on), eg. [3], is of importance for
biology and fishery [4], sedimentology [5] and has big consequences for
acoustics [6] as well as for mooring design.
In a numerical study on the generation of ISWs in the Bay of Biscay,
Gerkema showed [2,7] that at neap tides the additional dispersion supplied
by the Earth's rotation does prevent the disintegration of the internal
tide into ISWs. This was corroborated by earlier measurements [3] on the
shelf over a whole spring-neap cycle.
2. Experimental setup
Encouraged by the success of Gerkema's model in verifying observations
at different forcing magnitudes and in different geographical regions [2,7],
additional measurements have been performed at the shelf-edge region in
the Bay of Biscay (see figure 1) in August 1995 and in July 1996. Aim of
these experiments was to check details of the generation process near the
shelf-edge region (figure 2). In order to do so, we tried to observe the
travelling internal tide and/or ISWs in both the oceanward and the coastward
direction (leftward and rightward direction in figure 2 respectively).
This was done by yo-yoing ship's CTD on the slope for 25 hours, and with
two thermistor chain and current meter moorings on the shelf respectively.
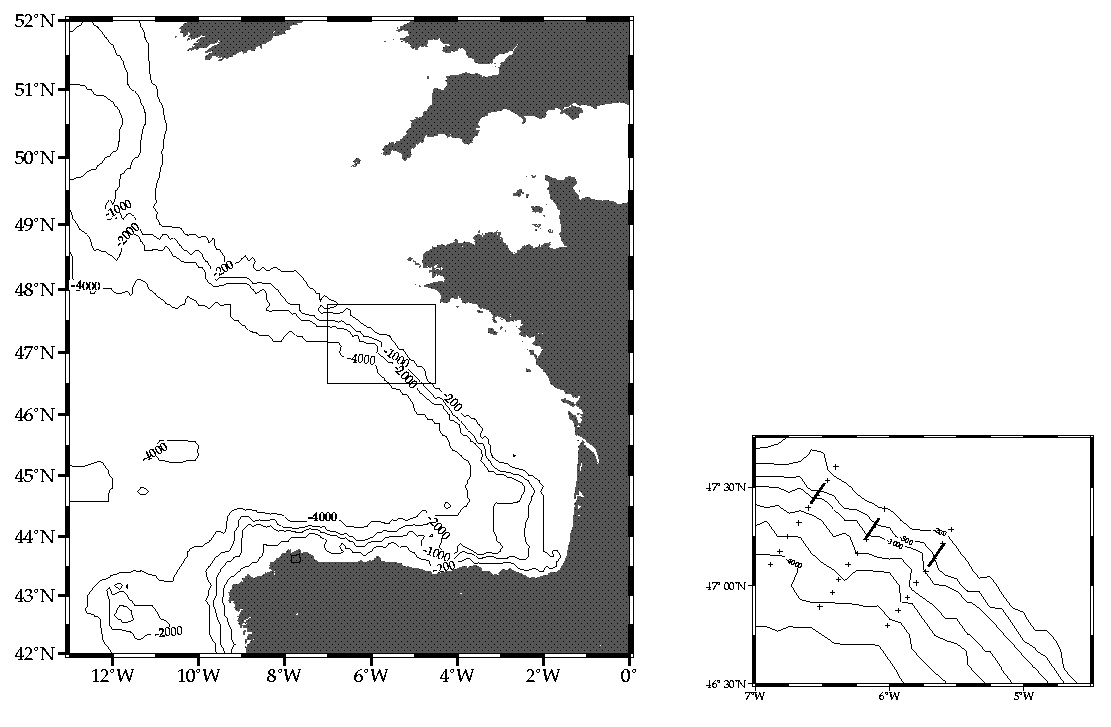
Figure 1. The Bay of Biscay (left) as part of the west European
shelf-edge. In the inset (right) the shelfbreak region can be seen in more
detail. The yo-yo stations has been performed at the middle indicated line
at the crossing with the 1000 m isobath. The 2 thermistor chain moorings
were located on the shelf, about 32 and 54 km shoreward along this line.
Depths are taken from NOAA-ETOPO5; a 5-minute bathymetry database.
The simultaneous observations of the travelling ISWs in both directions
should provide insight into the precise generation location, and eg. give
answer to the question whether the two "trains" are originating from the
same depression, or from two separate depressions, as can be seen in figure
2. By measuring with the highest possible resolution --- twice every 5
minutes for the yo-yo station and every 10 seconds for the moored 2x11
thermistors on shelf --- additional and useful information about the fine-scale
structure of the passing ISWs can be expected.
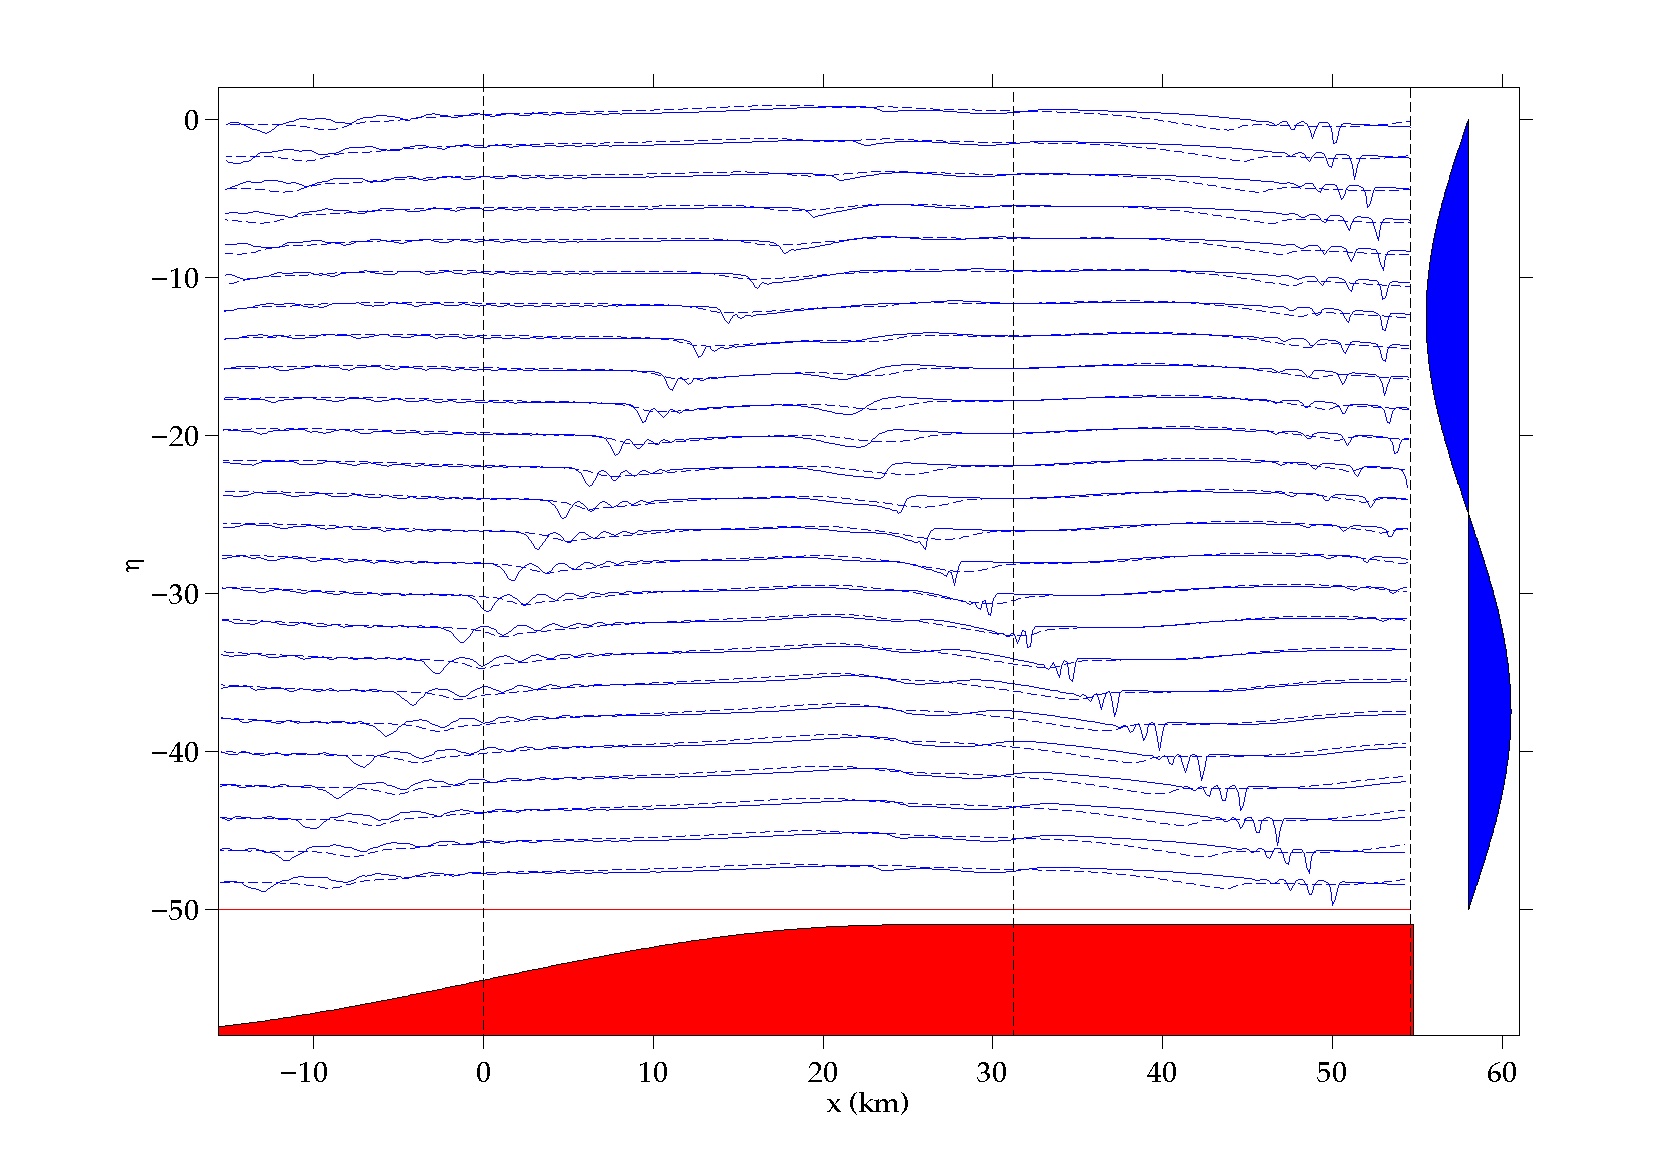
Figure 2. The generation of the internal tide at the transect indicated
in figure 1 during spring tides (full lines) and neap tides (dashed) for
1 tidal period as calculated with Gerkema's model [2,7]. Upper (lower)
part of the figure shows the ebb (flow) phase, as is indicated schematically
in the right margin. The time differences between successive interface
shapes is 1/24 tidal period, corresponding with an dimensionless elevation
offset of -2. Topography is sketched at the bottom. Measurements are performed
at the positions of the 3 vertical dashed lines: yo-yo station at x=0,
and the 2 on-shelf moorings at x= 32 and 56 km respectively.
3. Observations
In both years the yo-yo measurements have been successful, while some
problems had to be faced with the on-shelf moorings. The mooring nearest
to the shelf-edge (T1, at x=32 km in figure 2) suffered both years from
a buoyancy defect, and the other mooring (T2, at x=56 km in figure 2) was
lost in 1996.
Figure 3 shows an example of the observed temperature, corrected for
the varying depths of the thermistors, at the near shelf-edge mooring T1
in 1996. Though there is no maximal stratification (early summer; 2-3 July)
the forcing at this time is (nearly at spring tides), and the observed
trains of high-frequency waves can probably be identified as ISWs.
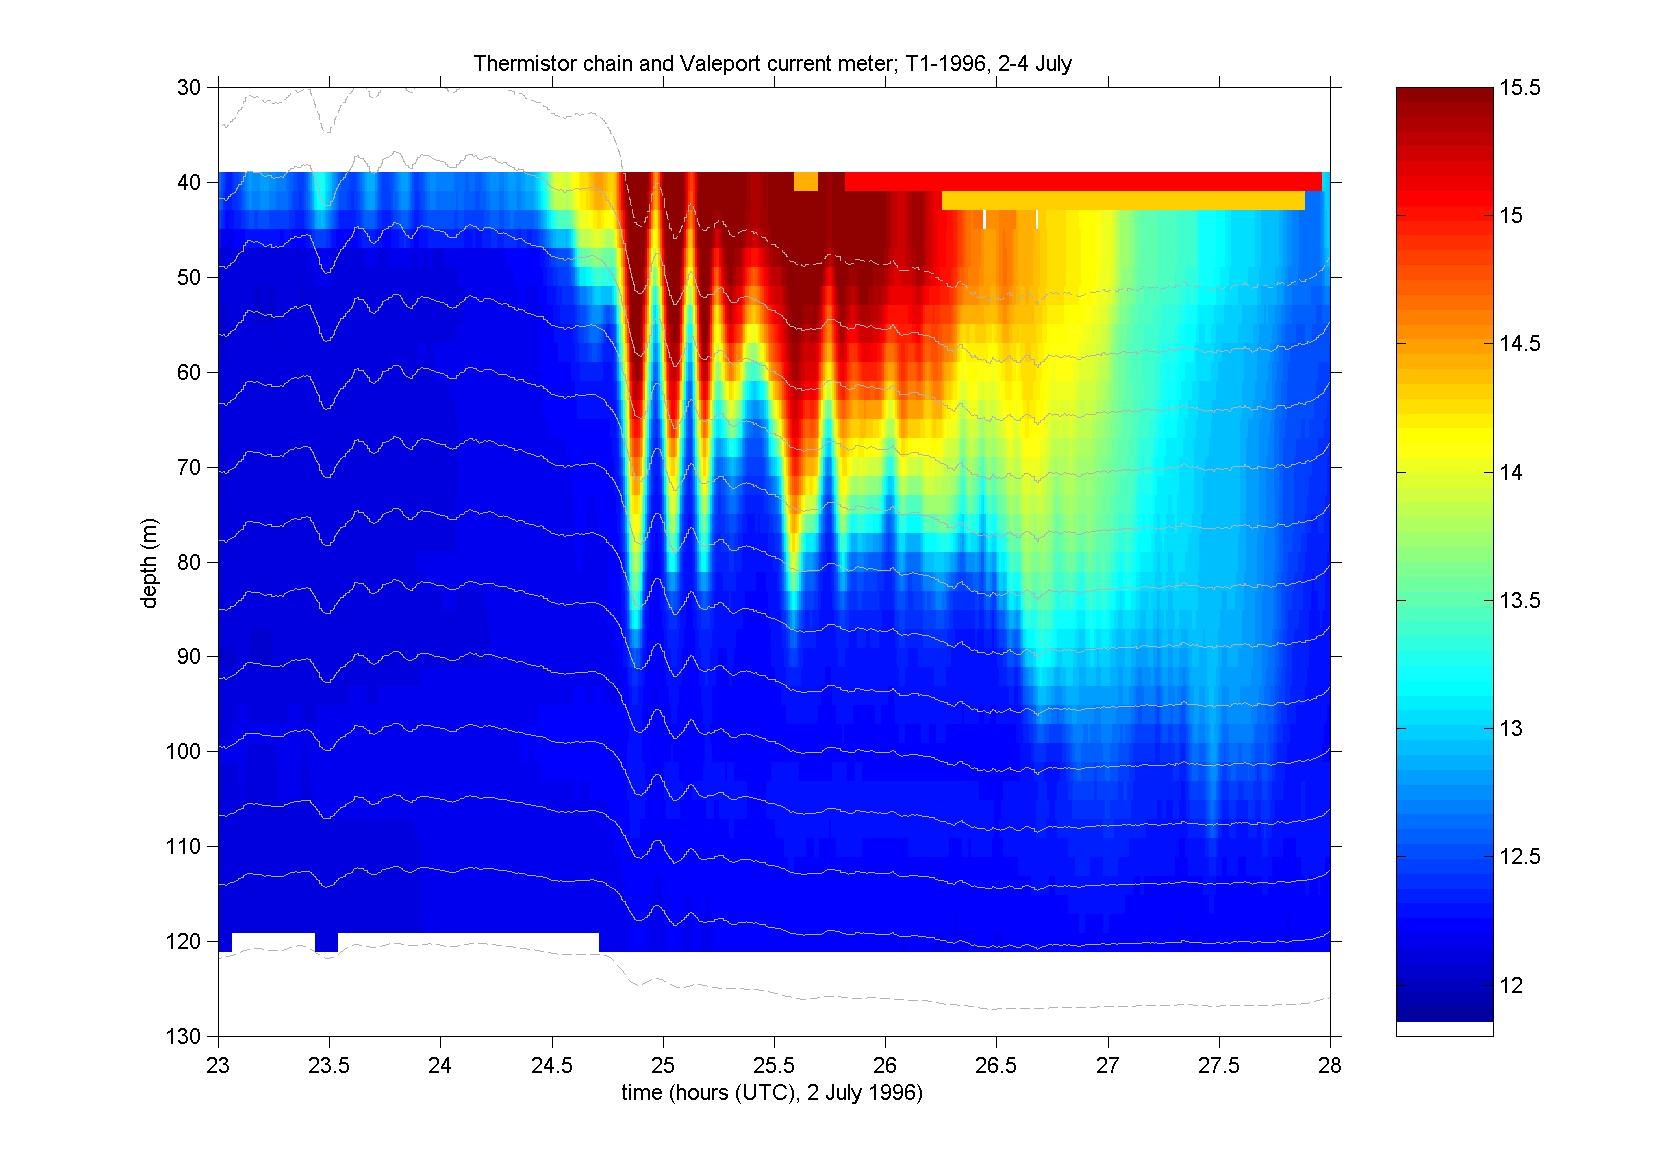
Figure 3. Part of the on-shelf mooring registration 1996. Temperature
(in degrees Celsius) has been measured every 10 seconds at the indicated
gray lines. The dashed lines are for the current meter positions, where
temperature and pressure sensors were located as well. It can be seen that
measurements are taken relatively deep, and at variable depth, due to buoyancy
problems of the mooring. The red/orange colour in the upper right corner
are an artefact of the gridding used.
An example of a part of the yo-yo cast (x=0 in figure 2) in 1995 is
given in figure 4. Now, August 2, we have a fully developed seasonal thermocline.
This measurement is almost 4 days after spring tides, but it can be seen
that the vertical elevations of the interface are very large (order 50
m) and fast (20 minutes). High frequency temporal coherence is not easy
(if at all) to recognize, and as a result ISWs cannot be positively identified.
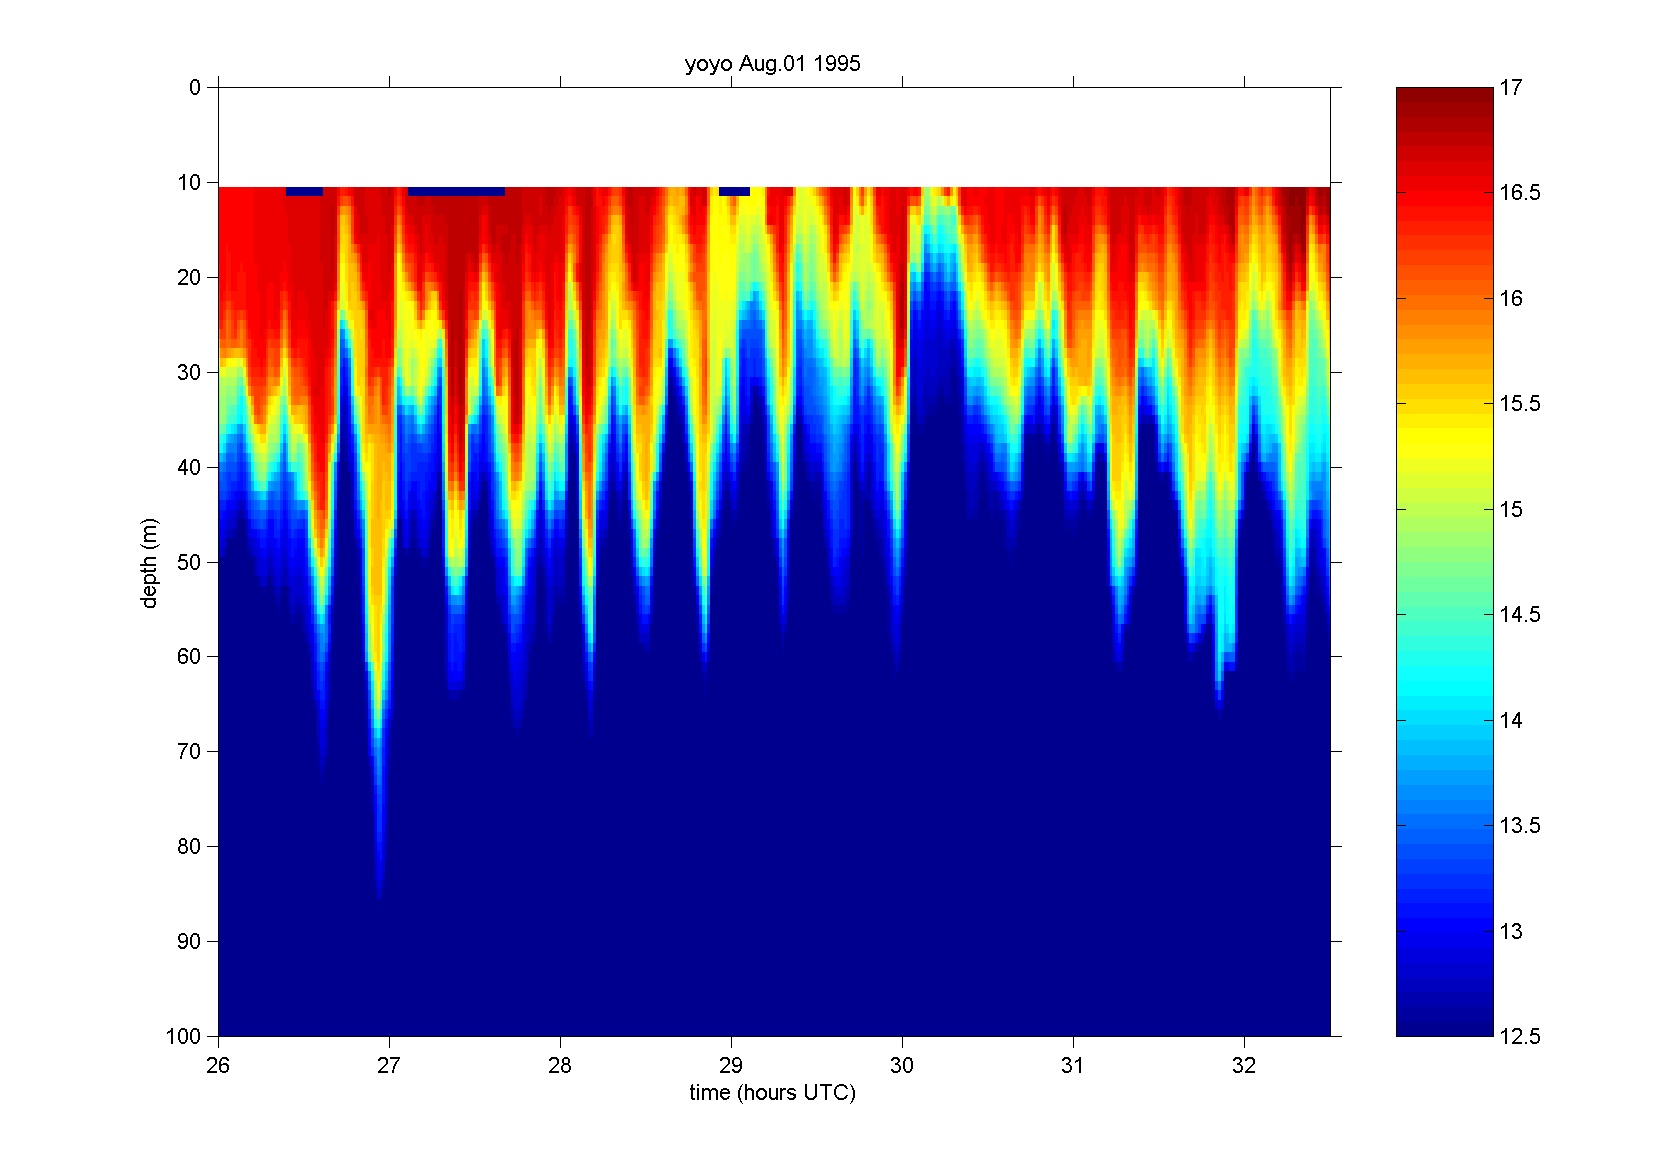
Figure 4. Part of the temperature measurements at the yo-yo cast
in 1995. Note the different temperature scale as compared with figure 3.
Furthermore, the vertical axis is 30 m shifted, and a somewhat larger time
span is selected.
4. Conclusions and discussion
Further work on the data presented here is in progress. Arrival times
of oceanward and shoreward travelling ISW fronts at measurement locations
(yo-yo station and on-shelf moorings respectively) still have to be compared,
but correlation is hard to recognize. This might be due to the fact that
topography is far from two-dimensional, as is illustrated in ref. [8];
it can lead to the interference of internal tide and ISW patterns, originating
from different generation areas. In figure 3b of ref. [9] this complex
interference is visualized by analysing a SAR image.
Another topic concerns the propagation of the internal tide into the
deep ocean, which owes its behaviour to the continuous stratification,
and can therefore not be described in terms of a two-layer model. This
part of the internal tide is of course generated in the same region, and
most energetic wave rays are emanating from the shelf-edge into the deep
ocean[1]. In ref. [10] it is suggested that another group of ISWs is generated
by the oceanward travelling internal-tidal beam, when it crosses the thermocline
after its first reflection at the bottom.
In 1995 we did an additional deeper CTD yo-yo: between 950 and 1250
meter, just above the bottom of the shelf slope on the same transect. The
measured isotherm elevations were surprisingly high (order 100 m), and
these will also be shown in Victoria BC.
References
1. Baines, P.G. (1982) On internal tide generation models.
Deep-Sea
Res. 29, 307-388
2. Gerkema, T. (1994)
Nonlinear dispersive internal tides:
generation models for a rotating ocean. Ph.D. thesis, Utrecht Univ.
3. Pingree, R.D and G.T. Mardell (1985) Solitary internal waves in the
Celtic Sea.
Prog.Oceanog. 14, 431-441
4. Holligan, P.M. et al. (1985) Oceanic solitons, nutrient pulses and
phytoplankton growth.
Nature 314, 348-350
5. Heathershaw, A.D. et al. (1987) Internal tides and sediment transport
at the shelf break in the Celtic Sea.
Cont.Shelf Res. 7,
485-517
6. Apel, J.R. et al. (1997) An overview of the 1995 SWARM shallow water
internal wave acoustic scattering experiment.
IEEE J.Oceanic Eng.
22,
465-500
7. Gerkema, T. (1996) A unified model for the generation and fission
of internal tides in a rotating ocean.
J.Marine Res. 54,
421-450
8. Holt, J.T. and S.A. Thorpe (1997) The propagation of high frequency
internal waves in the Celtic Sea.
Deep-Sea Res. 44, 2087-2116
9. New, A.L. (1988) Internal tidal mixing in the Bay of Biscay.
Deep-Sea
Res. 35, 691-709
10. New, A.L. and R.D. Pingree (1992) Local generation of internal soliton
packets in the central Bay of Biscay.
Deep-Sea Res. 39, 1521-1534