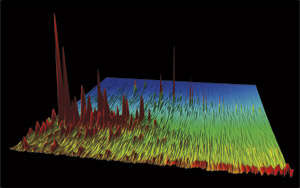
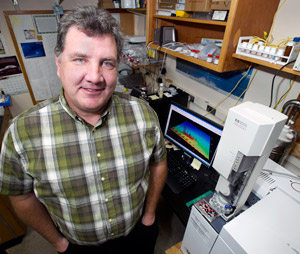
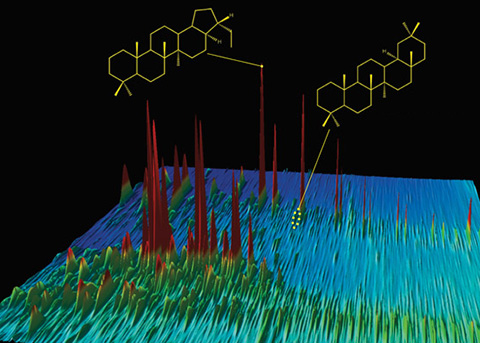
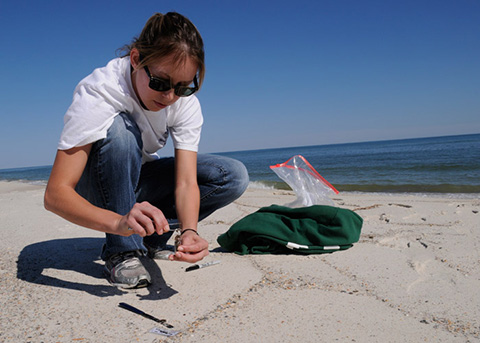
Where is this mountainous landscape? [Click here] Actually, that’s the wrong question. It’s a landscape, all right, but it’s a chemical landscape: You’re looking at oil from the Deepwater Horizon spill. Each colorful peak depicts an individual chemical compound in the oil that gushed out of the Macondo well and into the Gulf of Mexico in the spring of 2010. Taller peaks represent more abundant compounds, which stand out among the thousands of hydrocarbons that oil is made of. (In fact, this is only a segment of the entire Macondo oil chromatogram.) Bob Nelson, a research specialist at Woods Hole Oceanographic Institution (WHOI), creates these special gas chromatograms and says they are “like topographical maps.” He knows each peak like the back of his hand and can readily give you the chemical lay of the land. “That tallest peak in this image—that’s a diasterane,” he said. More precisely, it is DiaC27ßα-20S 13ß(H), 17α(H)-20S diacholestane, but you’ll excuse Nelson for opting for the more general class of compounds. Every oil is composed of a distinctive variety and abundance of compounds. A skilled researcher can detect many more compounds in an oil sample, creating finely detailed gas chromatograms with more peaks that can be mined for more information. Scientists can use these chromatograms to “fingerprint” whether oil came from a well off Santa Barbara, Calif., from the Macondo well, or from a different well in the Gulf of Mexico. Gas chromatograms can also tell you how Nature forms oil in reservoirs and what Nature does to oil after it is released into the environment. If you examine chromatograms of spilled oil, you can detect whether some of its chemical constituents evaporated into the air, dissolved in seawater, or were consumed by microbes or broken down by sunlight. A legacy of oil spill researchMax Blumer, a legendary chemist at WHOI, pioneered the use of gas chromatography in marine chemistry and the environmental science of oil spills. In 1969, he applied the relatively new technology in groundbreaking studies of an oil spill that occurred in West Falmouth, Mass. Shortly after, marine chemist John Farrington came to WHOI and for decades used gas chromatography to make major advances in oil spill research. Today, WHOI chemist Chris Reddy, Blumer’s scientific grandson, carries on the tradition of using gas chromatography as a research tool. “But it’s not just having the tool,” Reddy said. “It’s not enough to own a Ferrari if you don’t know how to get it out of first gear. Gas chromatography is a delicate, often unforgiving process. Bob Nelson has Paul Bunyan hands but the dexterity of a Swiss watchmaker. His chromatograms are the best in the world. He can tease apart more compounds out of a complex mixture and bookkeep them better than anyone. He paints beautiful paintings, and we interpret them.” In traditional gas chromatography, samples of chemical mixtures are conveyed via an inert gas through a narrow tube, known as a column. One sample may contain thousands of compounds, most with tortuous polysyllabic names. Each compound may have from eight to 40 carbon atoms and even more hydrogen atoms. Many have elaborate ring structures, branches, and long chains. These different structures give the compounds different physical and chemical characteristics—“different personalities,” Nelson joked. Gas chromatography exploits the compounds’ different personalities to separate them. Two dimensionsThe chromatograph column is lined with a microscopically thin polymer film. Compounds in a complex mixture interact with the film for different lengths of time, depending on their personalities—in this case, their boiling points, which are related to their molecular weights. With oil samples, lighter compounds generally get through faster and emerge first from the column. As components emerge from the column they transit into a detector, such as a mass spectrometer, which measures the abundance of each compound. In the end, the oil compounds are essentially separated by molecular weight, like kindergarten students lining up in size order. However, hydrocarbons with similar molecular weights but different chemical structures can emerge from the column at the same time, hindering scientists’ ability to tell them apart. To distinguish among these compounds, the WHOI lab adds another special process. It puts all the compounds through a second separation, distinguishing them by a second chemical characteristic: their polarity, a measure of how their electrons are distributed. This second separation takes place on a second column coated with a different chromatographic film. The complete technique is known as comprehensive two-dimensional GC×GC gas chromatography. In chromatograms, more polar compounds are at the top; less polar compounds are at the bottom. Compounds with lower molecular weights are to the left; higher molecular weights are to the right. So a compound toward the lower right corner has low polarity and high molecular weight; compounds that line up vertically have the same molecular weights, but different polarities. A haystack of chemical needles“The more highly resolved the chromatogram—the more pieces of hay we get out of the haystack—the more we can analyze to tell a better story of what the chemical mixture is made of, where it came from, and what may and does happen to it if released,” Reddy said. So, for example, what happened to the Macondo well oil after it leaked into the Gulf in the spring of 2010? Reddy and Nelson found differences when they compared gas chromatograms of Macondo well oil right from the well and the same oil after it surfaced within a few miles of the blowout. In the latter, simple polar compounds had disappeared, but compounds such as diasteranes remained. “Diasteranes are nonpolar,” Nelson explained. “So they don’t dissolve in water, and they don’t evaporate. They are also large, bulky compounds. Bacteria can’t easily get access to them due to their bulky nature and don’t eat them unless it’s a last resort. They prefer smaller, straight-chained compounds that are easier to eat.” The polarity measurements can help scientists disentangle how the lighter compounds disappeared. A GC×GC chromatogram of oil found on a rocky beach can reveal that the oil lost 35 percent of its naphthalene via evaporation, while 10 percent of the compound dissolved in water. “Traditional gas chromatography can’t distinguish that with certainty,” Reddy said. “Why is this important? Because it tells us that evaporation can remove a lot of toxic naphthalene from water, but some portion of it can still get back into the water where it can affect organisms.” Molecular fossilsCompounds like diasteranes, which resist breaking down in the environment and can remain in oil for millions of years, are referred to as “molecular fossils.” Like the bones of dinosaurs, they can give scientists a window into the past. Oil ultimately derives from organic carbon from decomposed organisms that are buried under sediments, where they are “cooked and squeezed,” as Reddy put it; that is, they undergo heat and pressure that convert the organic matter into petroleum. Molecular fossils in chromatograms can indicate what went into oil, under what conditions, and when. See those peaks of trisnorneohopanes in the chromatogram of Macondo well oil? Heating alters the shape of the compound trisnorhopane, converting it to the more stable form, trisnorneohopane. So oil with a higher fraction of trisnorneohopane had been subjected to more heating. Peaks of bisnorhopanes in the Santa Barbara oil chromatogram are telltale molecular fossils indicating that the oil formed in sediments where there was little or no oxygen. The Santa Barbara oil also contains oleanane, which comes from the remnants of flowering plants that washed from land into the ocean—a clue to the past flora and climate of the Southern California coast. It also tells you that the oil is younger than 65 million years old; before then, such flowering plants didn’t exist on Earth. Once, in a chromatogram of oil from Texas, Nelson found bicadinane, a compound he recognized from a chromatogram of oil from a shipwreck in the Pacific Ocean. Bicadinane comes from a resinous hardwood flowering plant that is indigenous to Southeast Asia. The chemical clues suggest that relatives of the Southeast Asian flowering hardwoods once grew in Texas, but subsequently went extinct there. And how could it be that oil samples from offshore Brazil and Nigeria, from different sides of the Atlantic Ocean, have similar compounds in their chromatograms? That’s an easy one: The oil in both modern-day reservoirs formed in one reservoir millions of years ago, before Earth’s tectonic plates moved apart to separate South America and Africa and create the Atlantic Ocean. Originally published: October 12, 2011 Last updated: August 14, 2013 | |||||||||||||||||||||||||||
Copyright ©2007 Woods Hole Oceanographic Institution, All Rights Reserved, Privacy Policy. | |||||||||||||||||||||||||||