Gridded Freshwater Content Data
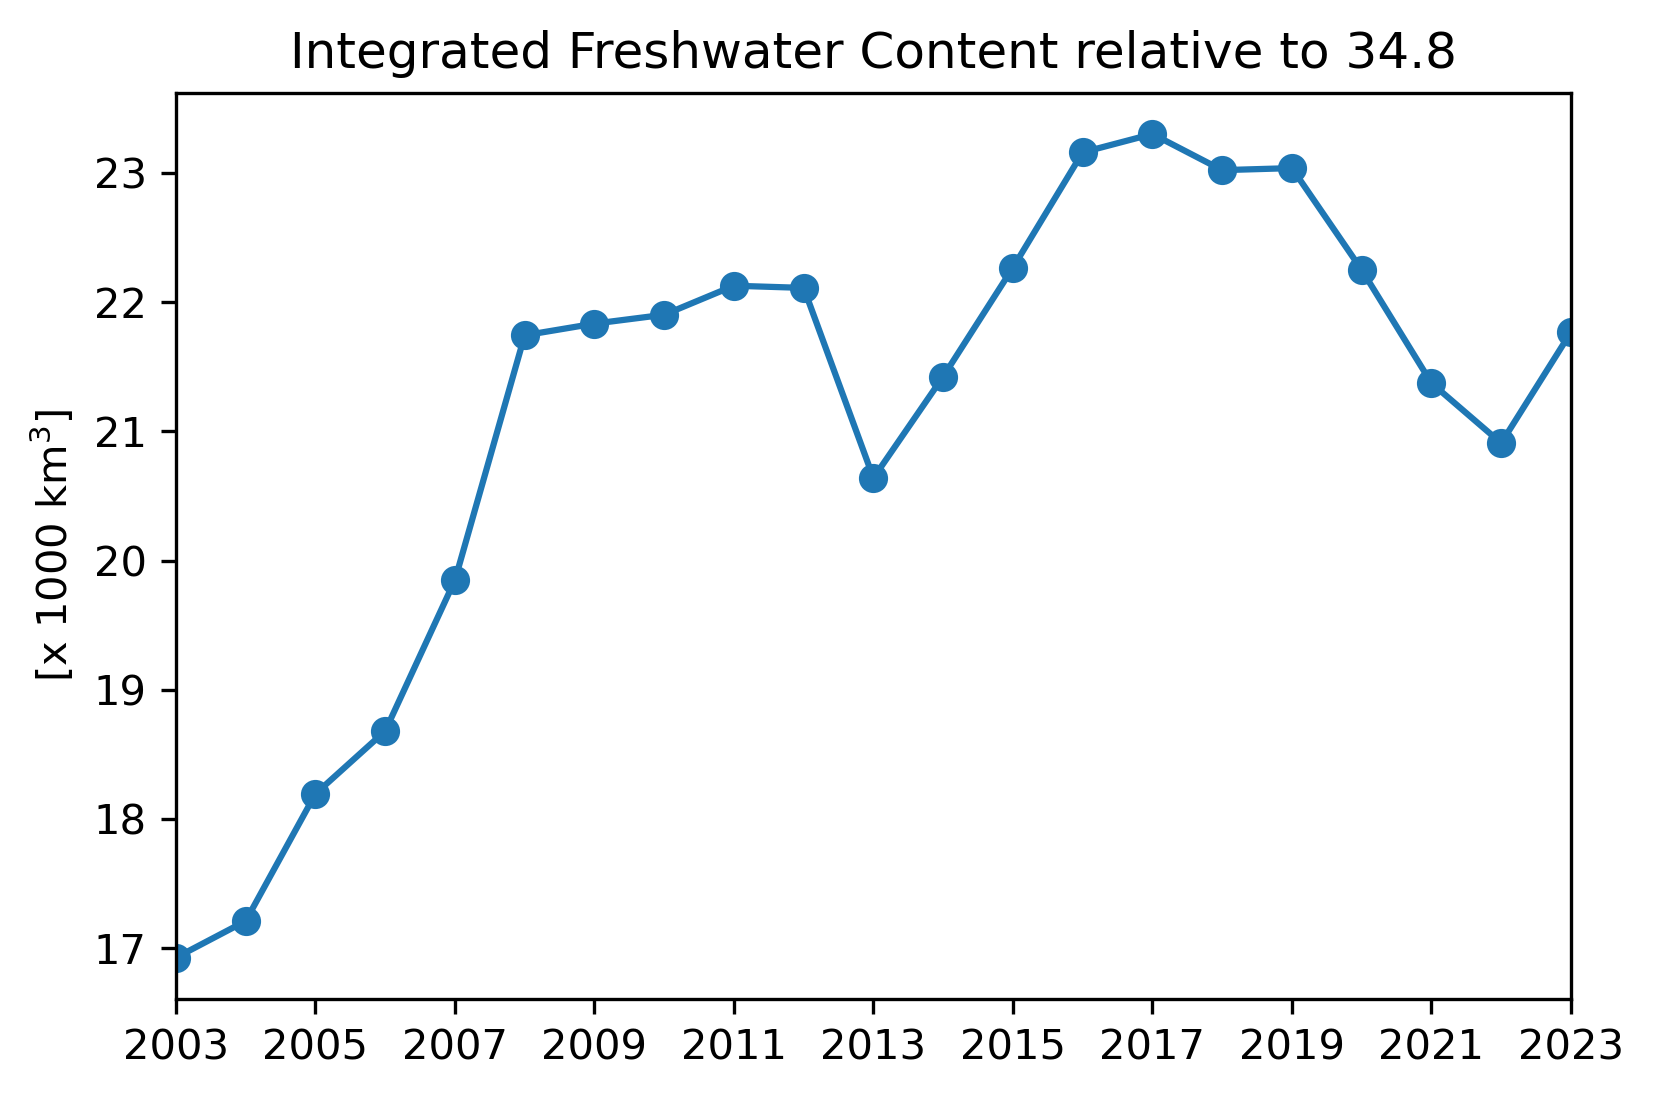
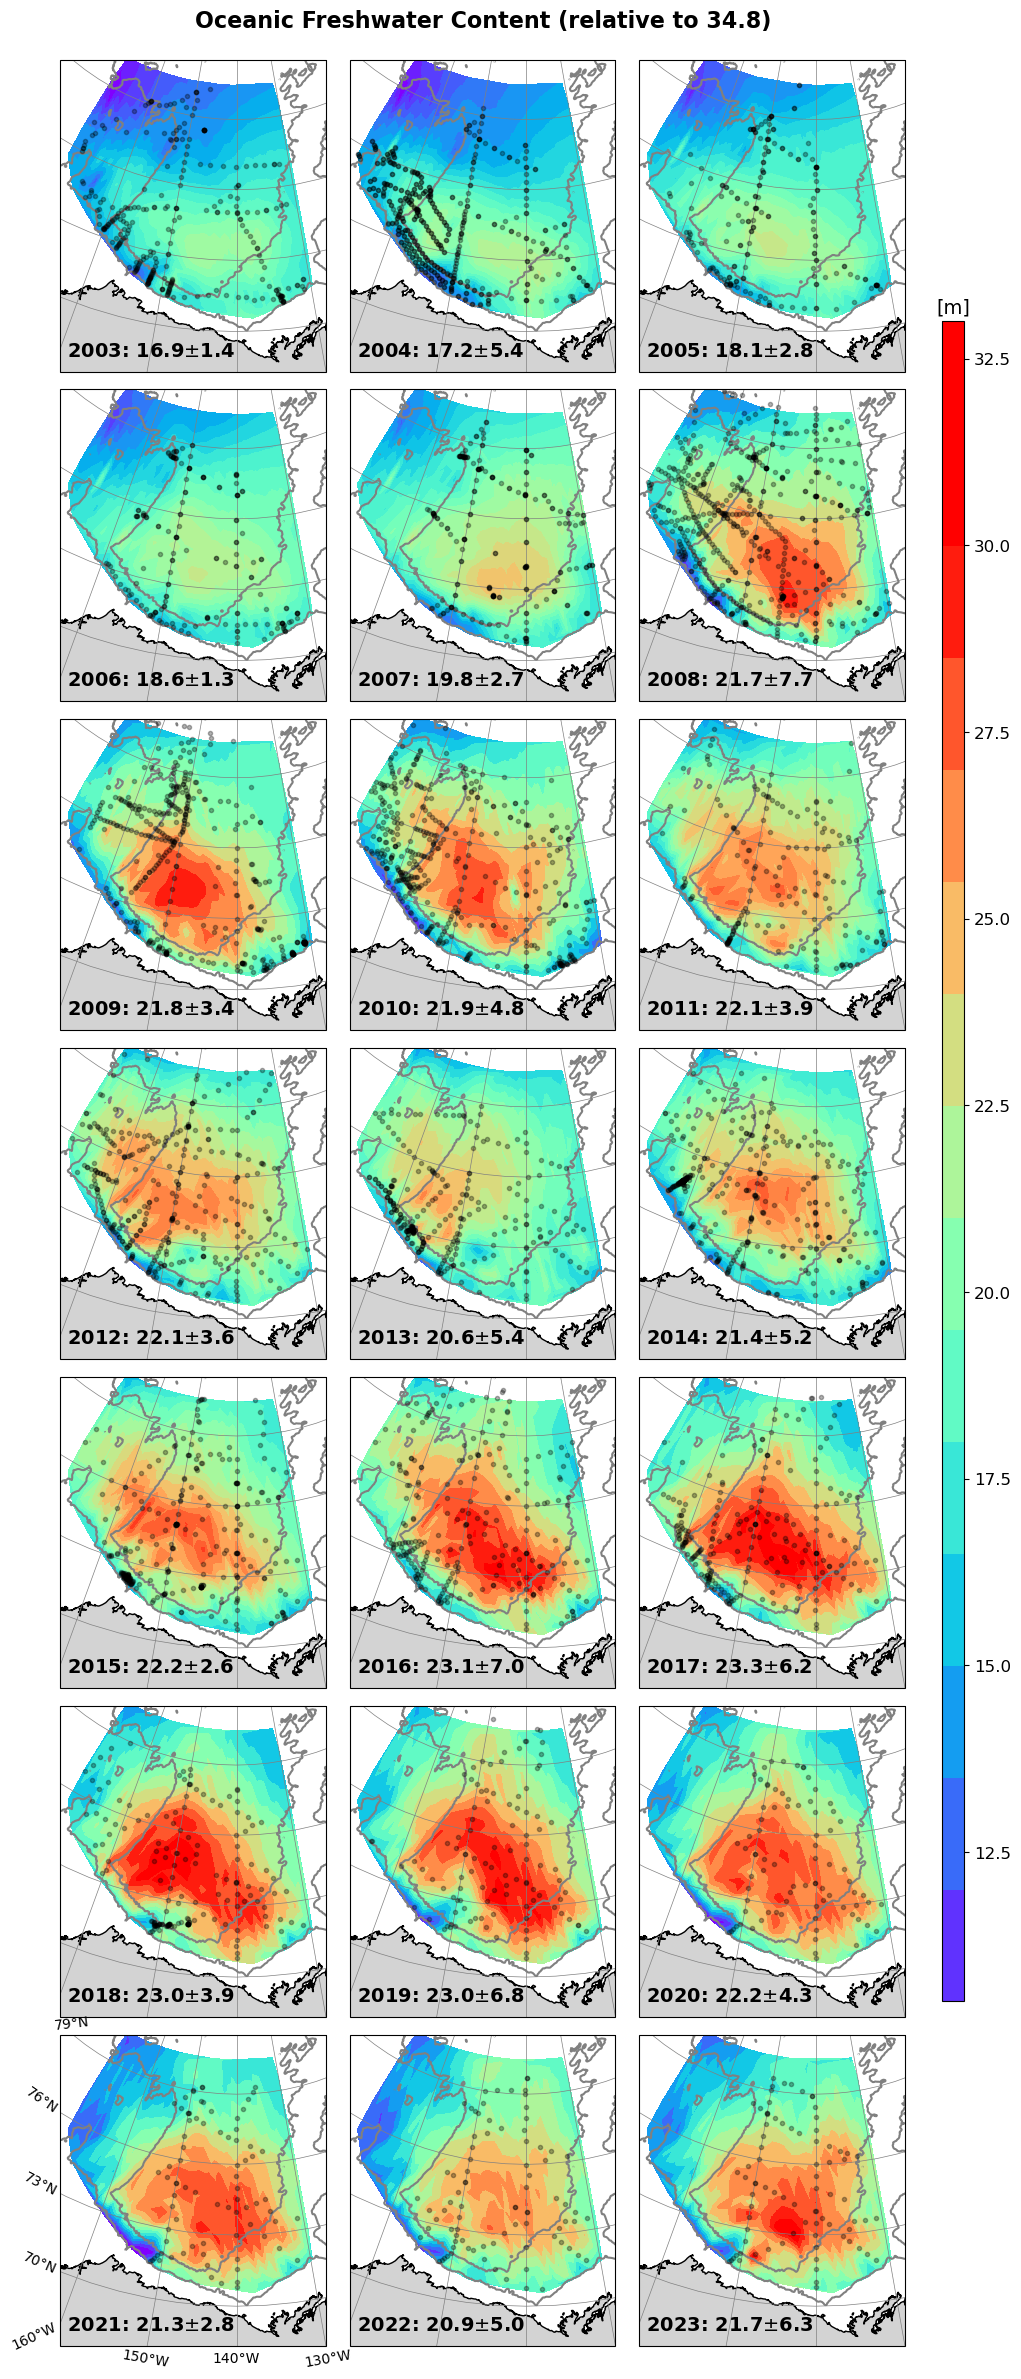
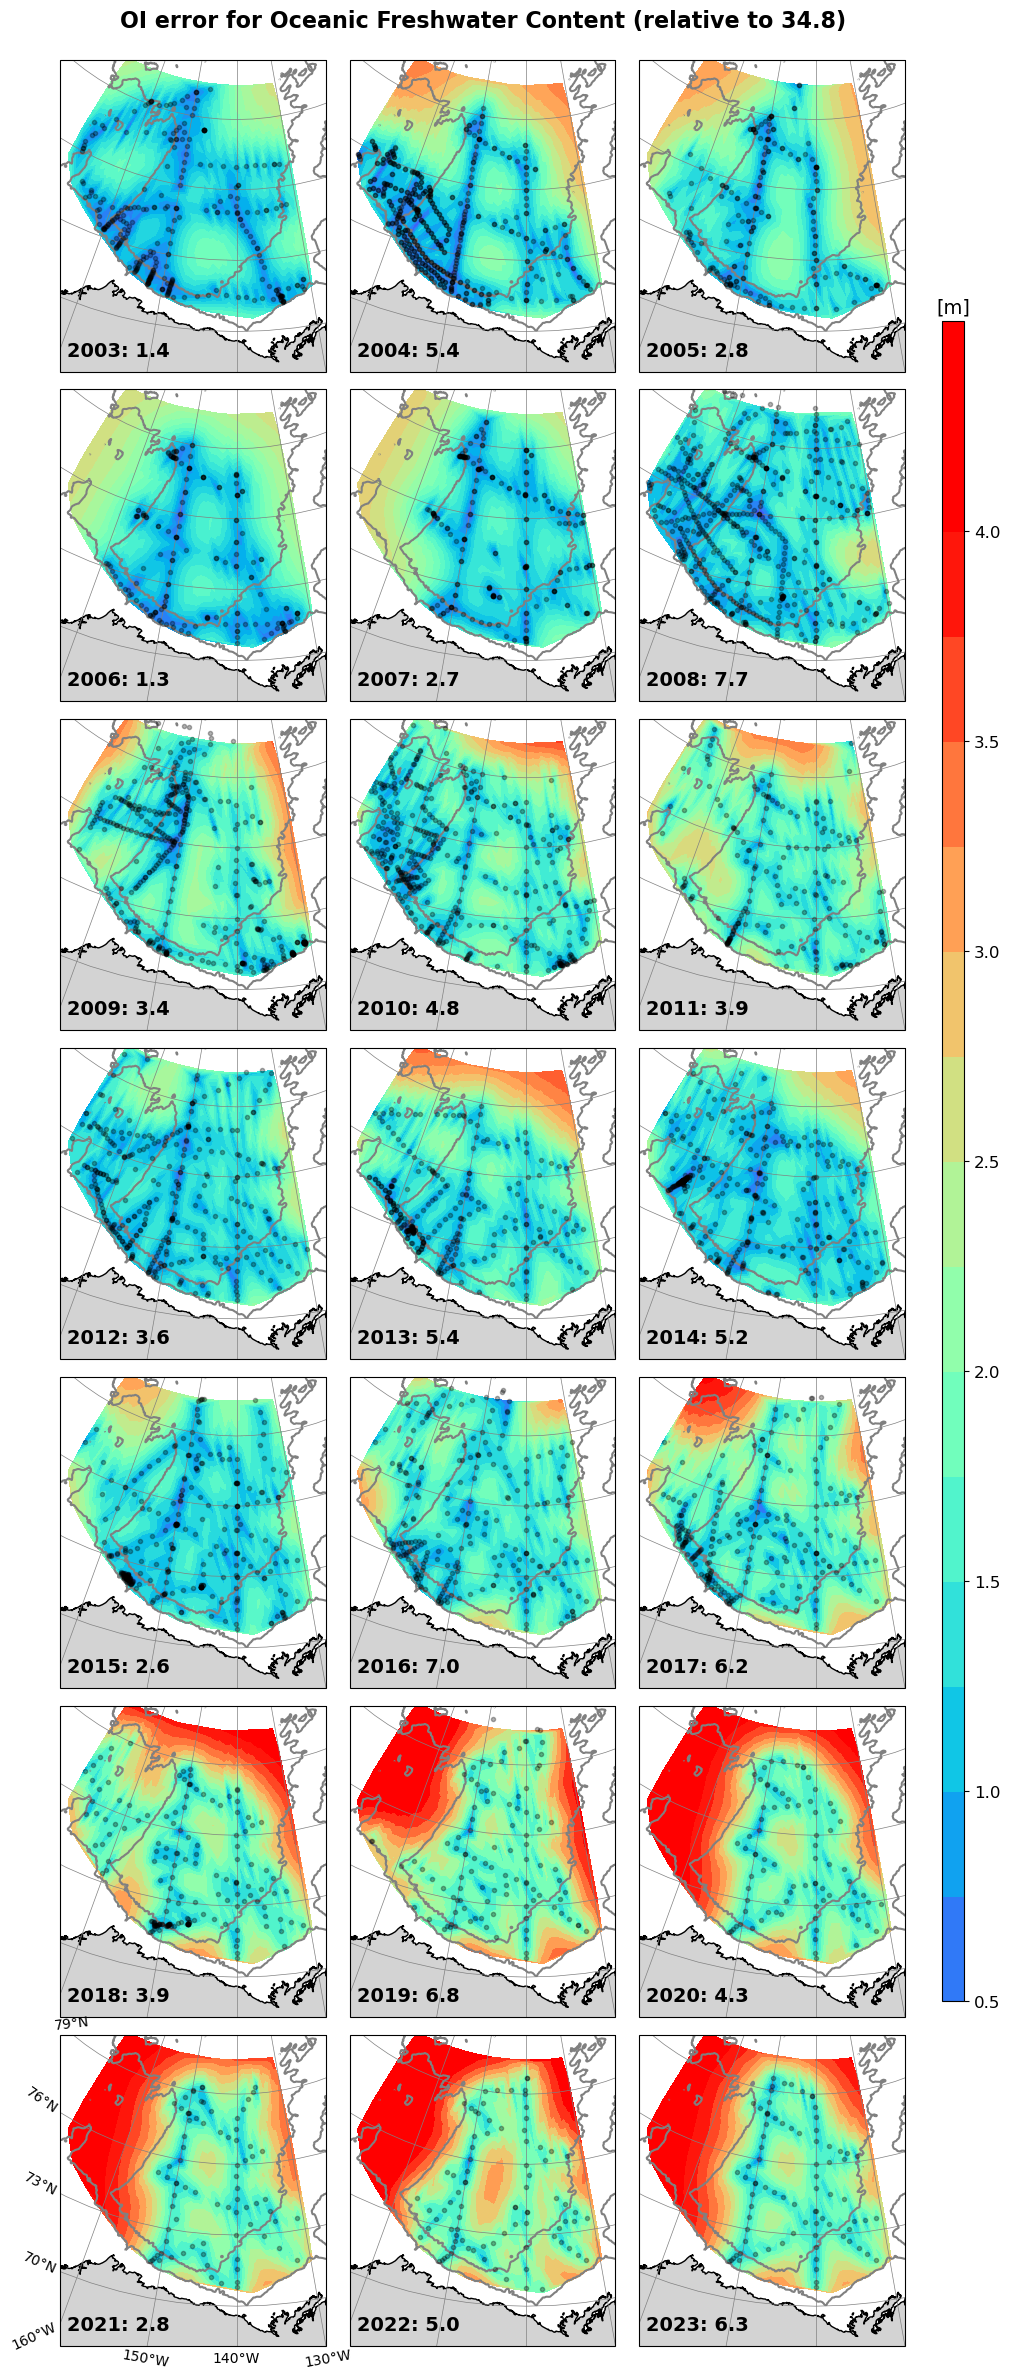
Estimates of liquid freshwater content (FWC) of the Beaufort Gyre region (BGR) are computed following Proshutinsky et al. (2009) using CTD, XCTD, and UCTD profiles collected each year from July through October. The FWC is calculated using optimal interpolation on a 50-km square grid between 70˚N and 80˚N, and 130˚W - 170˚W, and where water depths exceed 300 m. Spatially-integrated fresh water volumes for the BGR (encompassing an area of 1.023 x 10⁶ km2) are labelled for each year on each panel in Figure 2 (and shown in Figure 1), with uncertainties determined from combining the uncertainties in the profiles with the optimal interpolation errors shown in Figure 3.
The most up-to-date FWC data (2003-2023) can be found here. This dataset includes the FWC in each grid cell and its error as well as the total FWC and its error.
Proshutinsky, A., R. Krishfield, M.-L. Timmermans, J. Toole, E. Carmack, F. Mclaughlin, W. J. Williams, S. Zimmermann, M. Itoh, & K. Shimada (2009), Beaufort Gyre freshwater reservoir: State and variability from observations, Journal of Geophysical Research, 114, 1–25, doi:10.1029/2008JC005104.


