
My work in the South China Sea is supported by the US Office of Naval Research program in physical oceanography. The study is part of a collaboration with numerous colleagues, most significantly Harper Simmons of the University of Alaska - Fairbanks (http://people.iarc.uaf.edu/~hsimmons/) and YuHuai Wang of National Sun Yat-Sen University (http://www.iut.nsysu.edu.tw/html/profile/yu_hwai_wang.html)
We have worked in the South China Sea in a series of research cruises since 2005. These studies have focused on the large amplitude internal waves that occur in this region. A very nice presentation on the topic is given by Chris Jackson of Global Ocean Associates ( http://internalwaveatlas.com/Atlas2_index.html).
Some aspects of the 2005 work along the shelfbreak region of the northern S. China Sea can be found here (a description of results from the 2005 study can be found here). I will focus here on the work done in 2007 and 2008, in the region of Dongsha Reef. This region gets hit my some of the largest internal waves occurring in the global ocean, and there is considerable evidence that nearly all aspects of the oceanography of the region are influenced by the internal waves, including aspects of the coral reef.
This map shows the survey regions for turbulence measurements in the South China Sea during 2007 and 2008. The Taiwan research vessel OR3 surveyed sites east of Dongsha Reef in 2007, with waves measured at the 250-m and 900-m isobaths. During 2008, the Taiwan research vessel OR1 surveyed the region along the previously established APL/UW mooring (MP1 and MP2) and ADCP long-ranger (LR1-LR3) line. The 2008 measurements tracked wave packets from the 550-m to 375-m isobath.

Here is a composite data section showing the classic South China Sea depression wave. The wave is visible in the undulations of the backscatter intensity. In this case the wave has nearly 100-m displacement amplitude in 900-m of water. The turbulence levels observed in the core and wake of the wave are among the largest turbulence levels ever observed in open (non-coastal and non-bottom boundary layer) waters.

Our survey directly east of Dongsha Reef was done between depression wave arrivals. With no wave present, most of the enhanced turbulence occurred in the upper and bottom boundary layers.

The wave we observed just east of Dongsha Reef at the 250-m isobath was more disorganized than the wave we observed at 900-m. This is presumably due to changes in the wave that occur as it shallows. Interestingly, the turbulence levels in this wave are no greater than those observed in deeper water.
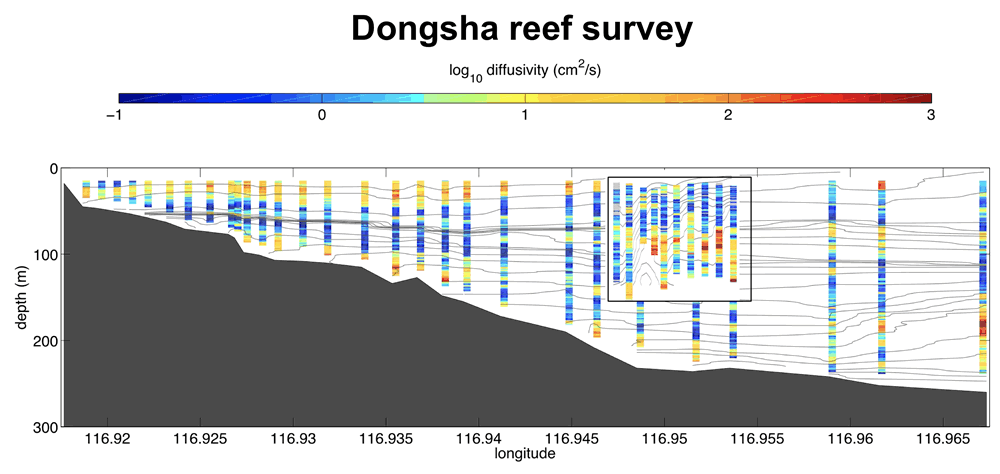
The diffusivity levels along the eastern edge of the Dongsha Reef are shown for the period both before and during the arrival of a large amplitude wave. Diffusivities at mid-depth were enhanced by a factor of 10 to 100 when the wave passed.

The biologic cycle at Dongsha Reef may be strongly influenced by the internal wave processes. The work of YH Wang (NSYSU) suggests that wave processes trigger cycles of primary production, shown here via chlorophyll concentrations.

The Taiwan research vessel Ocean Researcher I.
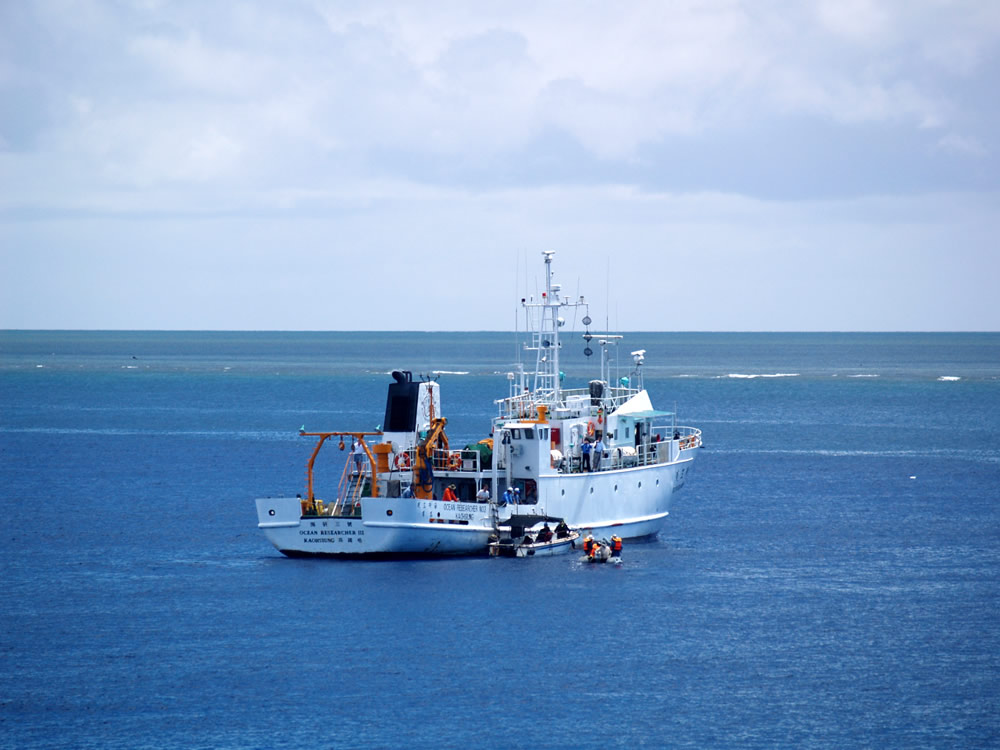
The Taiwan research vessel Ocean Researcher III.

The Rockland Scientific VMP-500 turbulence profiler used by FSU during 2008.
The movie above requires a Quicktime plugin for viewing. Download
one here.
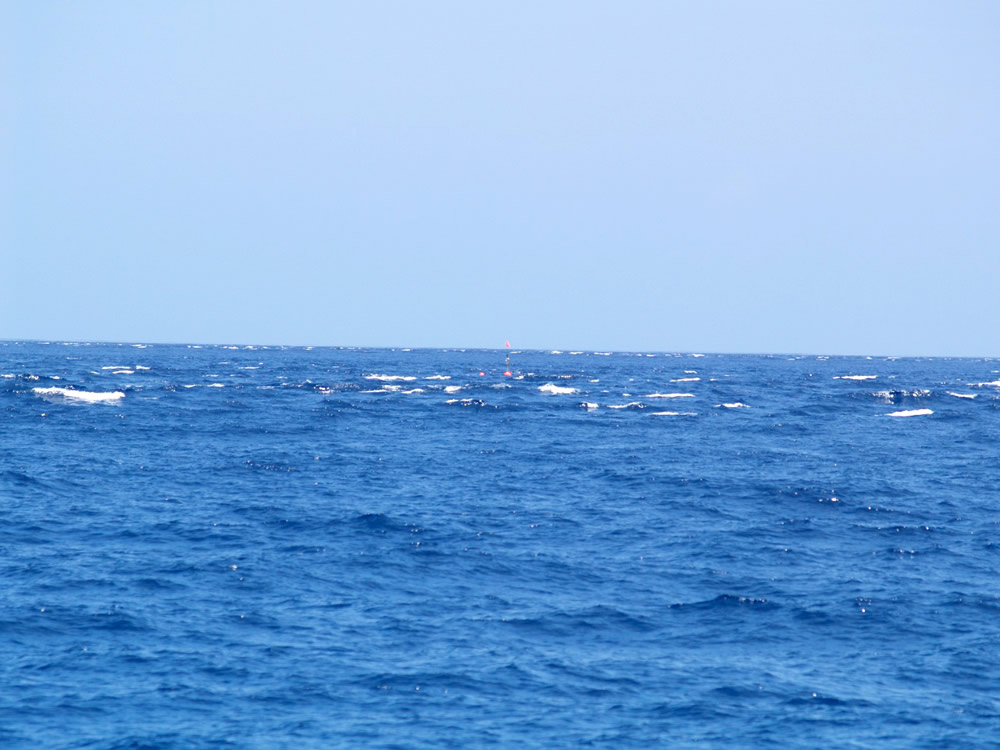
The breaking wave front indicates the arrival of a large internal wave. There was no wind acting at the time of this picture.

One of the many ship wrecks of Dongsha Reef.