Preliminary Cruise Report –
Meteorological Measurements
R/V Professor Khromov
Pusan, Korea to Otaru, Japan
February 28 – March 17, 2000
Richard Limeburner and Robert. Beardsley, Woods Hole Oceanographic Institute
Alexey Scherbinin and Igor Filippov, Far Eastern Regional Hydromet Research Institute, Vladivostok
Purpose
The
objectives of the meteorological component of the 2000 winter hydrographic
cruise on the R/V Professor Khromov to the Sea of Japan were to make high
quality shipboard measurements of wind speed and direction, barometric
pressure, relative humidity, air temperature, sea surface temperature, short
wave radiation, long wave radiation and precipitation. GPS positions were also
recorded every 10-minutes to determine the ship’s speed during the cruise.
Figure 1 shows the cruise track from the Woods Hole Oceanographic Institute
(WHOI) GPS data.
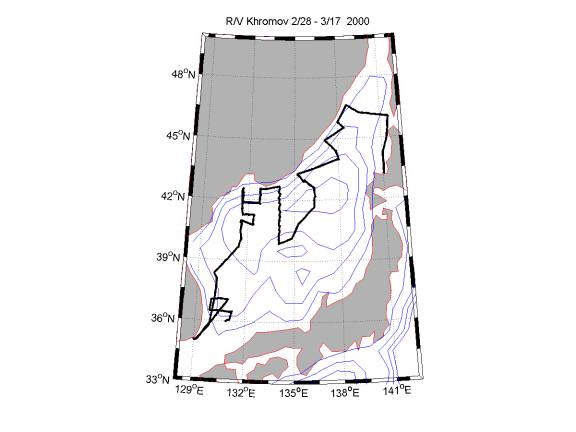
Figure
1. The cruise track of the R/V Professor
Khromov during the winter 2000
hydrographic cruise to the Sea of Japan..
The meteorological equipment was shipped to Korea in January 2000 and the instruments were then mounted on the Russian ship in Pusan. This report describes the instruments used during the cruise and the data collected. R. Limeburner from WHOI installed the meteorological instruments on the ship in Pusan, Korea and Alexey Sherebinin and Igor Filippov from the Far Eastern Regional Hydromet Research Institute, Vladivostok assisted in the installation.
Log
The R/V Professor Khromov arrived in Otaru, Japan March 17, 2000 to unload hydrographic equipment from the Scripps Institute of Oceanography (SIO) and meteorological instruments from WHOI. Instrument times from the meteorological recorders were first checked when reading the data in Otaru. Table 1 below summarizes the time drift of each sensor.
|
Instrument |
Sampling in Minutes |
Number Records |
Clock 3/17/00 |
UTC 3/17/00 |
Difference in seconds |
|
|
|
|
|
|
|
|
GPS |
10 |
2581 |
na |
na |
na |
|
WND 206 |
1 |
na |
na |
na |
na |
|
HRH 211 |
1 |
434 |
07:04:12 |
07:04:22 |
-10 |
|
BPR 205 |
1 |
436 |
06:59:37 |
06:59:17 |
+20 |
|
LWR 204 |
1 |
434 |
05:51:42 |
05:51:57 |
-15 |
|
SWR 206 |
1 |
435 |
06:52:38 |
06:52:36 |
-2 |
|
SST 206 |
1 |
435 |
06:46:29 |
06:46:02 |
+17 |
|
PRC 204 |
1 |
435 |
06:34:08 |
06:33:51 |
+17 |
Table 1. Instrument status observed during recovery 9/28/99 in Otaru, Japan.
The common start time of the meteorological recorders is 2/28/2000 06:59:00. Common stop time of all the instruments was 3/17/2000 04:58:00.
GPS
Data
The raw GPS data (2581 positions) was recorded every 10 minutes during the cruises and this raw data was stored in file gpsmar17.dat. There were 12 locations with flagged bad data. These errors were generally due to locally poor reception. The recorded 10-minute GPS sampling was not sampled at exactly 10-minute intervals since it takes a varying duration of time to receive the GPS signal. A Julian decimal year day was then calculated with 1/1/00 0000 as day 0. Velocities (m/s) were calculated using a backward difference method and the data was stored in a Matlab array named z10 in the file gps10min2000.mat. The data format is decimal year day, longitude, latitude, u (m/s), v (m/s). Figure 1 shows the resulting cruise track and Figure 2 summarizes the interpolated u and v ship velocities.
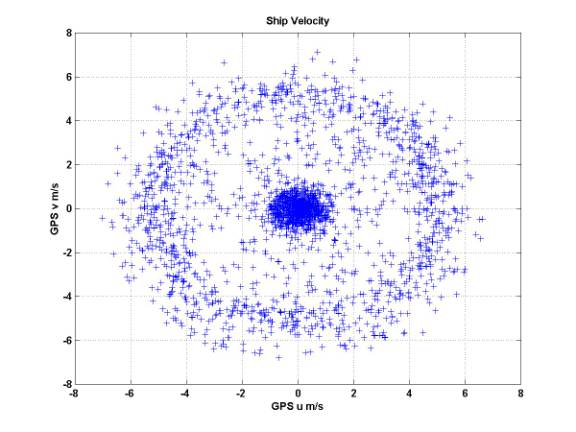
Figure 2. Ship velocity calculated from the March 2000 corrected GPS data.
A summary of the GPS ship velocity data is shown in Figure 3. This data will be used to correct the wind speed and direction measured by the WHOI meteorological recorder.
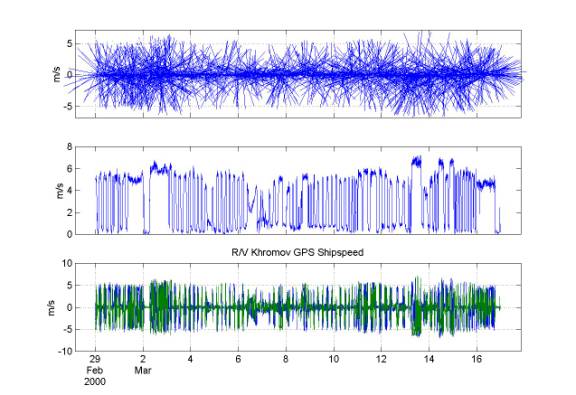
Figure 3. Khromov ship speed from the WHOI 10 minute interpolated GPS data showing a stick plot (top), speed (middle) and east (blue m/s) and north (green m/s) speeds.
Wind
Data
The wind recorder did not respond to requests for communication after the cruise in Otaru. The wind recorder battery voltage was 10.75 V after the cruise and the recorder appeared to have worked during the cruise. WHOI engineers inspected the instrument after its return to Woods Hole and concluded that a software failure prevented the recording of good during the cruise. Thus there is no WHOI wind data during the March 2000 cruise.
Barometric
Pressure
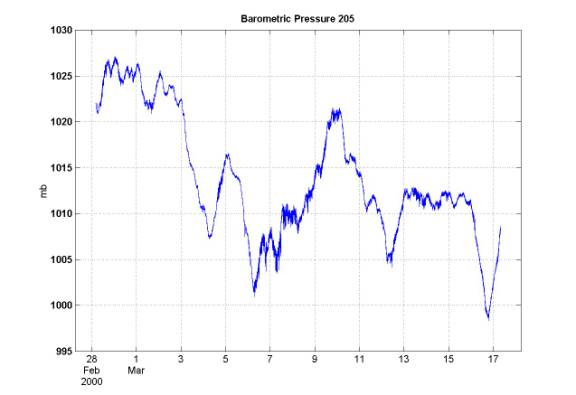
The raw barometric pressure data sampled every minute can be found in the Matlab5 file bprjapan2000.mat. Array data is z, jd is the julian day, start is the start time, stop is the stop time.
Long
Wave Radiation

The raw long wave radiation data sampled every minute can be found in the Matlab5 file lwrjapan2000.mat. Array data is z, jd is the julian day, start is the start time, stop is the stop time.
Short
Wave Radiation
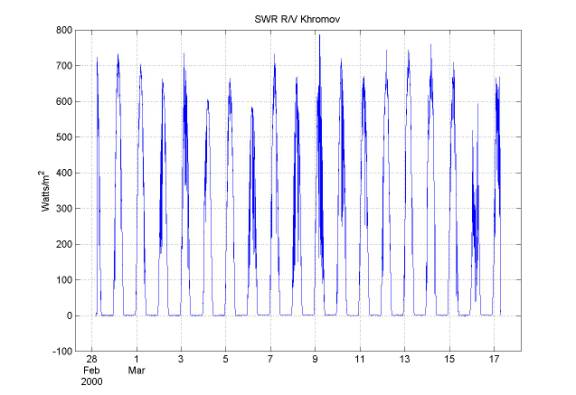
The raw short wave radiation data sampled every minute can be found in the Matlab5 file swrjapan2000.mat. Array data is z, jd is the julian day, start is the start time, stop is the stop time.
Sea
Surface Temperature
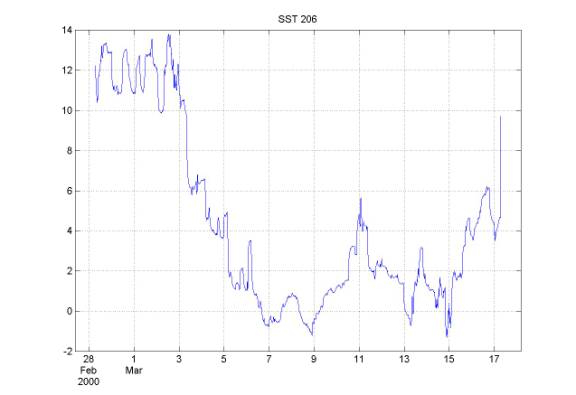
The raw sea surface temperature data sampled every minute can be found in the Matlab5 file sstjapan2000.mat. Array data is z, jd is the julian day, start is the start time, stop is the stop time.
Relative
Humidity
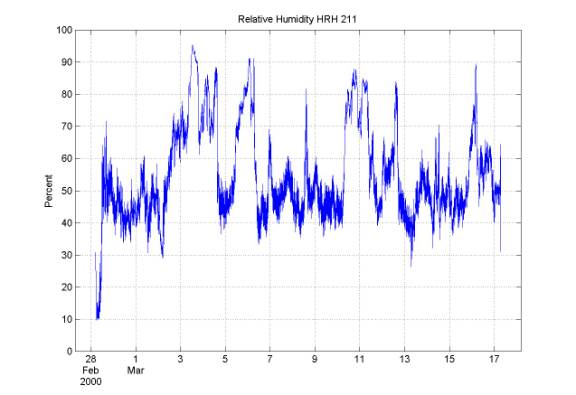
The raw relative humidity data sampled every minute can be found in the Matlab5 file hrhjapan2000.mat. Array data is z, jd is the julian day, start is the start time, stop is the stop time.
Air
Temperature
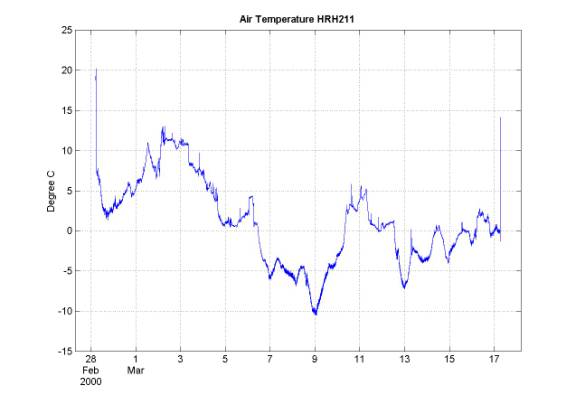
The raw air temperature data sampled every minute can be found in the Matlab5 file artjapan2000.mat. Array data is z, jd is the julian day, start is the start time, stop is the stop time.
Precipitation
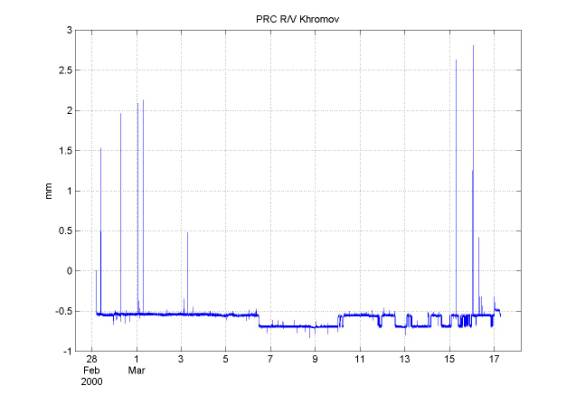
The raw precipitation data sampled every minute can be found in the Matlab5 file prcjapan2000.mat. Array data is z, jd is the julian day, start is the start time, stop is the stop time.
Acknowledgements
The successful installation of the
meteorological recorders was dependant on the knowledgeable support of Alexey
Scherbinin and Igor Filippov of the Far Eastern Regional Hydromet Research
Institute, Vladivostok. Lynne Talley
(SIO) also provided excellent coordination of the meteorological installation
with the Russian scientists and ship’s officers.