Shipboard Meteorological Measurements in the
Japan/East Sea
during January-March 2000
R. Beardsley, R. Limeburner, J. Edson (WHOI),
C. Dorman (SDSU), C. Lee (UW)
ABSTRACT
Surface
meteorological measurements were made in the Japan/East Sea during January
16-February 4 abroad the R/V Revelle and February 28- March 17 aboard the
R/V Khromov. The measurement suite included wind velocity, air temperature,
pressure and relative humidity, sea surface temperature, and incident short-
and long-wave radiation. The measurements were made on the Revelle with
the ship's IMET system, additional SDSU sensors, self-contained WHOI ASIMET
radiation recorders, and a WHOI sonic anemometer mounted on the bow mast,
and on the Khromov with WHOI ASIMET sensors and the ship's anemometers.
Time series estimates of the surface momentum and heat fluxes made using
both bulk aerodynamic and direct covariance methods show a consistent spatial
pattern associated with air flow across the subpolar surface front and
large increases in the surface cooling caused by "cold air outbreaks" of
relative dry continental air from Asia.
INTRODUCTION
The
wintertime circulation and water mass formation in the Japan/East Sea (JES)
are thought to be strongly driven by surface wind momentum and heat fluxes.
Strong winds off Siberia during "cold air outbreaks" and orographic effects
due to the coastal mountain range and gap at Vladivostok may combine to
produce large spatially concentrated surface wind stresses and associated
heat and moisture fluxes that have direct and possible large effects on
the ocean. Despite the potential importance of surface forcing on the JES,
very little is actually known about the marine boundary layer and surface
forcing over the JES during winter conditions. To help remedy this, high-quality
meteorological data were collected during two research cruises in the JES
during winter 2000 as part of the ONR Japan/East Sea Directed Research
Initiative field effort. Preliminary results from these measurements are
presented here.
INSTRUMENTATION
and METHODS
Meteorological
data were collected on the R/V Revelle winter SeaSoar cruise (January
16-February 4) and the R/V Khromov winter survey cruise (February
28- March 17) (Figure 1). The ships' standard meteorological instruments
were augmented by self-contained SDSU and WHOI sensor systems. This sensor
redundancy proved critical to collect a complete set of high-quality wind,
air temperature, pressure and relative humidity, incident short- and long-wave
radiation, and sea surface temperature data for both cruises (Table 1).
Table
1. Instrumentation used to obtain best surface data during winter cruises.
The R/V Revelle is equipped with an IMET sensor system as its standard
instrumentation. The WHOI ASIMET units were developed recently as stand-alone
systems for use on volunteer observing ships and buoys. The ship's gyro
and P-code GPS navigation data were used to compute true winds from measured
relative winds for the Revelle data. True winds were estimated on
the R/V Khromov every 6 hrs for real-time submission to WMO.
|
|
|
|
|
|
|
|
|
|
|
|
|
|
|
|
|
|
|
|
|
|
|
|
|
|
|
|
|
|
|
|
|
|
|
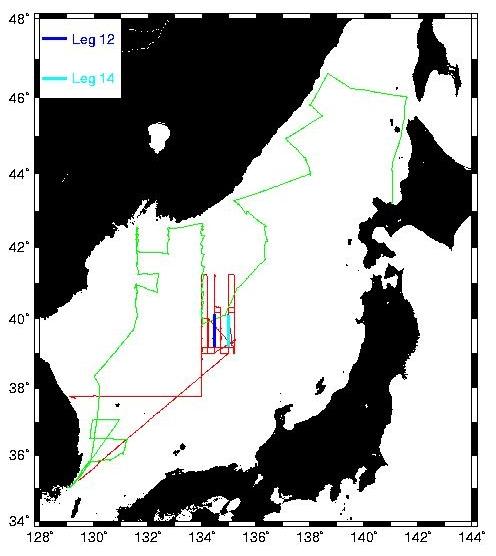
Figure
1. Ship tracks from R/V Revelle (red) and R/V Khromov
(green) cruises.
This
data set is used here to describe the surface meteorological conditions
during these two cruises and estimate the surface momentum and heat fluxes
using the MATLAB Air-Sea Toolbox (Pawlowicz et al, 2001). The net heat
flux into the ocean is given as
QNET
= QSW + QLW + QSEN + QLAT,
where
the sensible and latent fluxes are estimated using the TOGA/COARE bulk
aerodynamic formulation (Fairall et al., 1996; Beardsley et al, 1998).
Uncertainty in the heat flux components is roughly 10-20 W/m^2.
In
addition, turbulent velocity and temperature measurements were made with
a WHOI sonic anemometer /thermometer system mounted on the
Revelle
bow mast during the winter SeaSoar cruise. This system featured a 3-axis
sonic anemometer sampling at 20 Hz plus motion sensors and GPS (Edson et
al., 1998). The sonic system returned good data, allowing direct covariance
estimation of surface forcing during high wind cooling events.
RESULTS
The
basic meteorological data collected on the winter Revelle and
Khromov
cruises
are shown in Figures 2 and 3, and the resultant surface heat flux components
computed using the bulk aerodynamic method shown in Figures 4 and 5. Three
cold air outbreaks occurred during the Revelle cruise; OB1 (yd 18-22),
OB2 (yd 23-29), and OB3 (yd 29-34). Each outbreak is characterized by low
air temperature and relative humidity and increased southeastward winds
as a low-pressure center passes eastward, intensifying the flow of cold,
dry continental air over the central JES. Skies became cloudy during each
outbreak, causing a reduction in incident insolation.
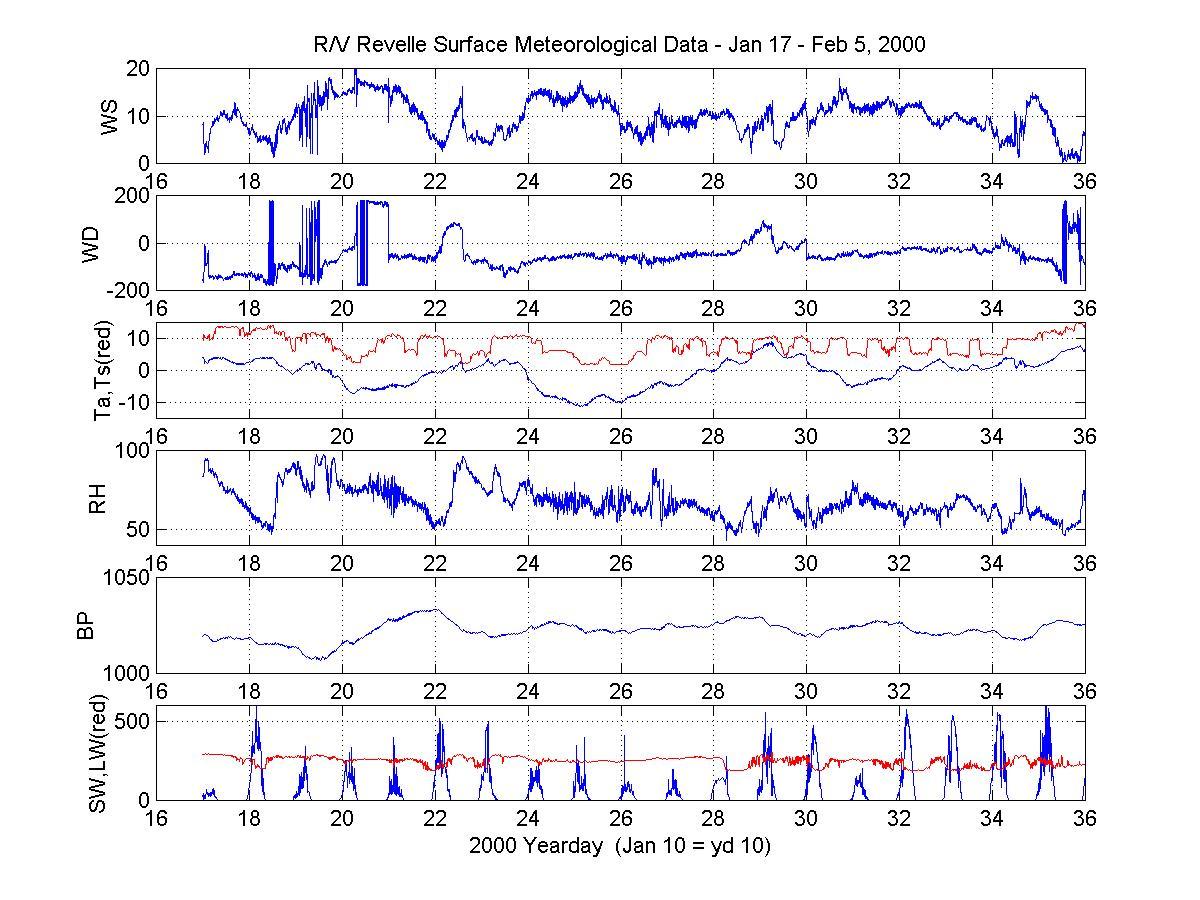
Figure
2. Meteorological conditions during the Revelle winter cruise. The
panels show from the top wind speed (m/s), wind direction in degrees relative
to E, air temperature and SST (red) (OC), relative humidity
(%), barometric pressure (mb), and incident shortwave and longwave (red)
radiation (W/m2). Three cold air outbreaks cause the minimum
air temperatures observed on yd 20 (OB1), yd 25 (OB2), and yd 31 (OB3).
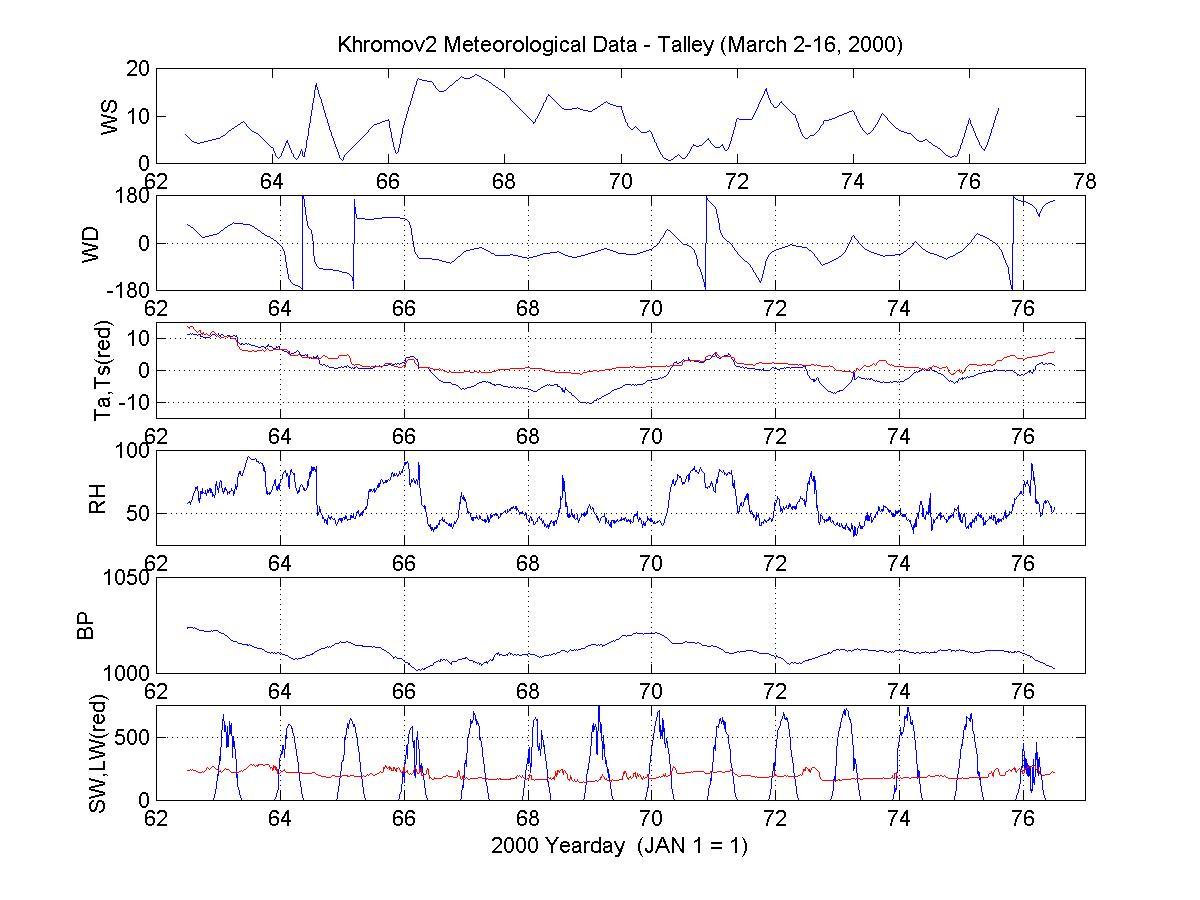
Figure
3. Meteorological conditions during the Khromov winter cruise. The
panels show from the top wind speed (m/s), wind direction in degrees relative
to E, air temperature and SST (red) (OC), relative humidity
(%), barometric pressure (mb), and incident shortwave and longwave (red)
radiation (W/m2). Two cold air outbreaks cause the minimum air
temperatures observed on yd 68 (OB4) and yd 72 (OB5).
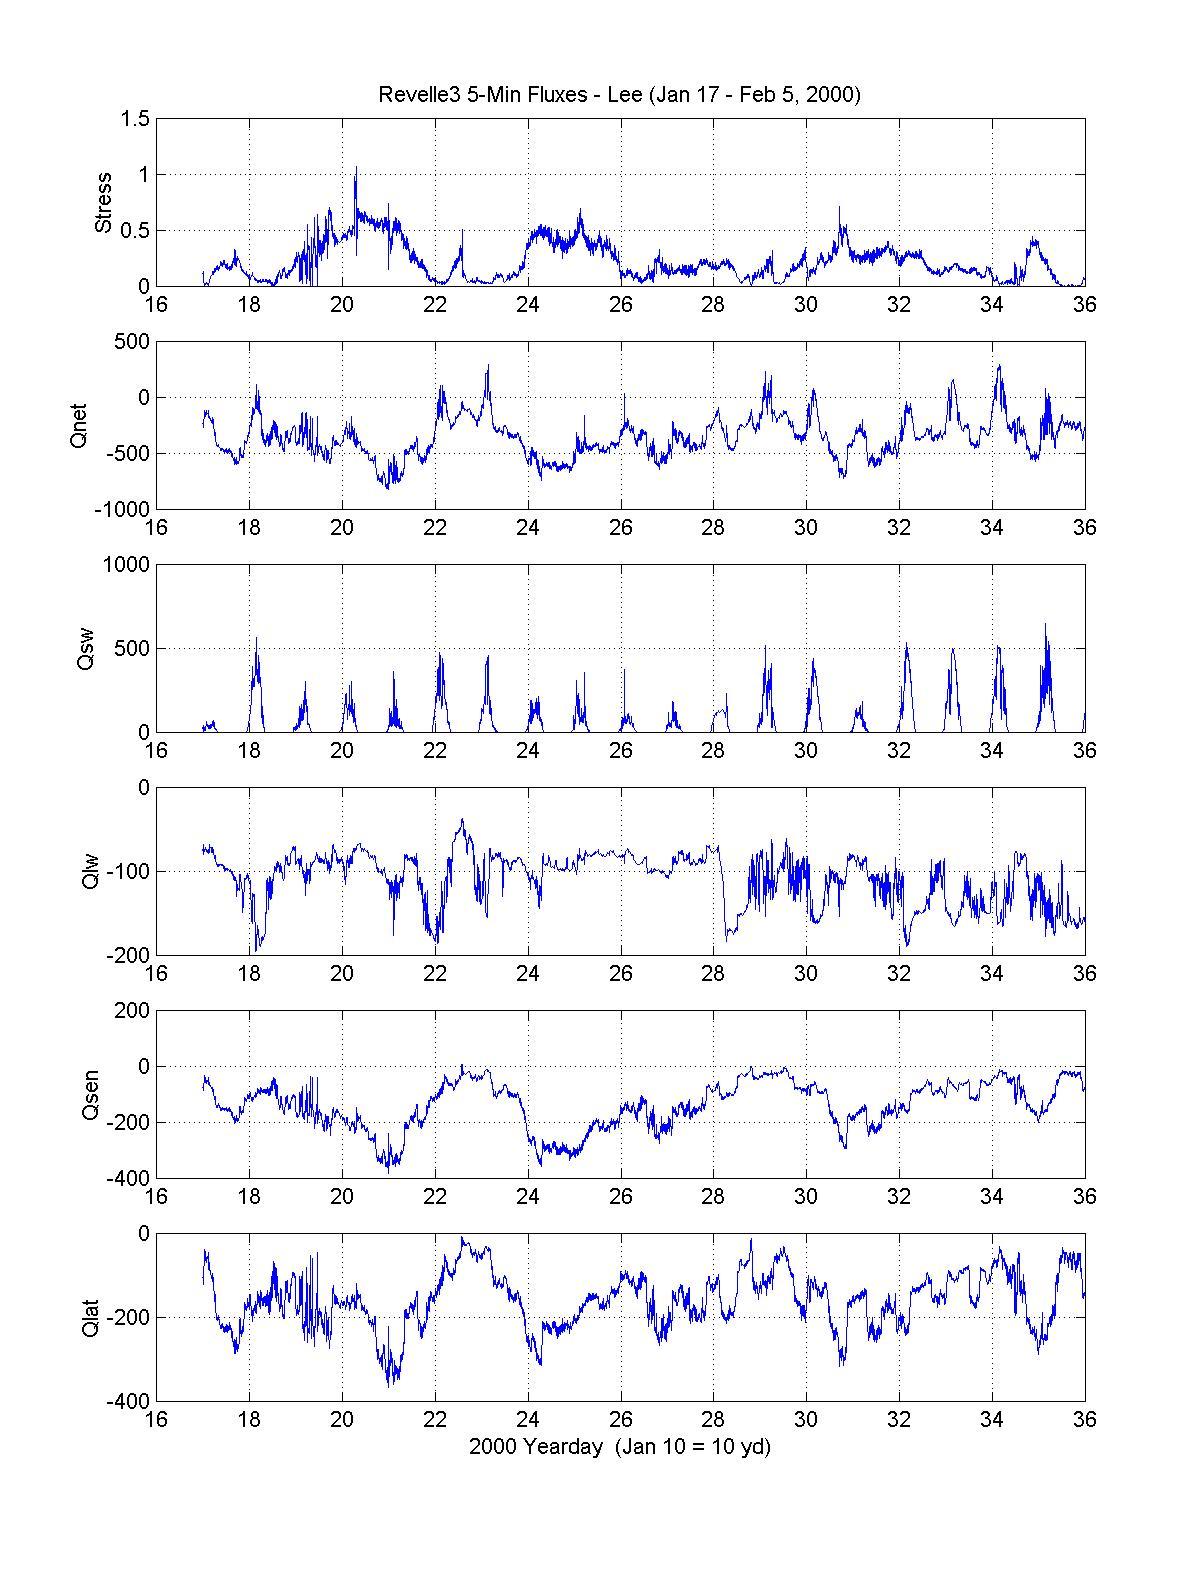
Figure
4. Surface fluxes during the Revelle winter cruise. From the top,
the panels show the wind stress magnitude (N/m2), the net heat
flux QNET, and the heat flux components QSW, QLW,
QSEN, and QLAT, all in W/m2. Positive
flux is heat transfer into the ocean.
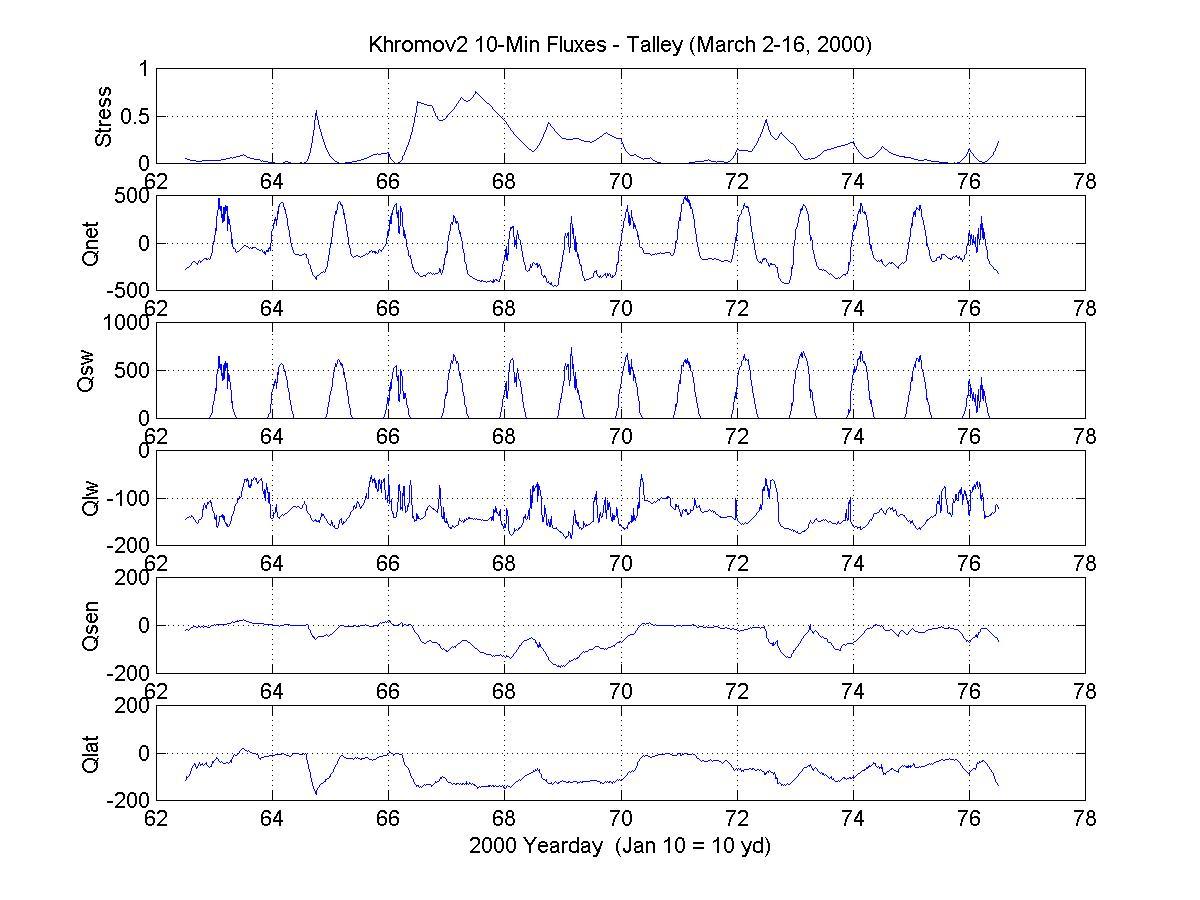
Figure
5. Surface fluxes during the Khromov winter cruise. From the top,
the panels show the wind stress magnitude (N/m2), the net heat
flux QNET, and the heat flux components QSW, QLW,
QSEN, and QLAT, all in W/m2. Positive
flux is heat transfer into the ocean.
The
mean net surface heat loss during the Revelle cruise was 353 W/m2,
with
84% due to the large sensible and latent losses (Table 2). The three cold
air outbreaks caused maximum sensible and latent losses of 300 W/m2
each, and sustained combined sensible and latent losses of 400 W/m2.
The tendency for increased cloudiness and reduced insolation during cold
air outbreaks was offset by reduced longwave heat loss, with the result
that the dominant variability in net heat flux was controlled by the combined
sensible and latent components.
Table
2. Mean conditions during the Revelle and Khromov cruises.
The record mean and standard deviation (in parenthesis) for each variable
are given.
|
|
|
|
|
|
|
|
|
|
|
|
|
|
|
|
|
|
|
|
|
|
|
|
|
|
|
|
|
|
|
|
|
|
|
|
|
|
|
|
|
|
|
|
|
|
|
Two
cold air outbreaks occurred during the Khromov cruise; OB4 (yd 66-71)
and OB5 (yd 72-75). The ship was sampling near the Russian coast north
of the subpolar front during OB4, so that while the air temperature drop
to -10 OC was similar to that during OB2, the ocean surface
temperature was within a degree of 0 OC, resulting in sensible
and latent heat losses during OB4 that were roughly one half that observed
during OB2. The Khromov cruise occurred later in the solar cycle,
with a significant increase in shortwave heat gain. The resulting mean
surface heat loss was only 84 W/m2, with the mean sensible
and latent loss roughly one half that found during the earlier Revelle
cruise.
BOUYANCY
FLUX COMPARISON
One
objective of the Revelle SeaSoar cruise was to obtain high-resolution
hydrographic measurements across the subpolar SST front during a cold air
outbreak. The SeaSoar was towed at roughly 4 m/s along a series of north-south
legs across the front (Figure 1). Turbulence data collected with the WHOI
sonic system on legs 12 and 14 allow a comparison of the buoyancy flux
computed using the bulk aerodynamic and direct covariance methods during
the end of outbreak OB2 (yd 27-28). On both legs the ship steamed northward
at night across the subpolar SST front into a relatively strong and steady
wind with little change in air temperature and relative humidity (Figure
6). The resulting net heat loss is controlled by the quick increase in
sensible and latent cooling and buoyancy loss due to the sharp increase
in SST across the front (in the southward downwind direction). The excellent
agreement in buoyancy fluxes computed using the two independent measurements
and approaches illustrates the rapid adjustment in the surface fluxes across
the SST front, and supports the use of the bulk aerodynamic method for
estimating air-sea fluxes during winter in the JES.
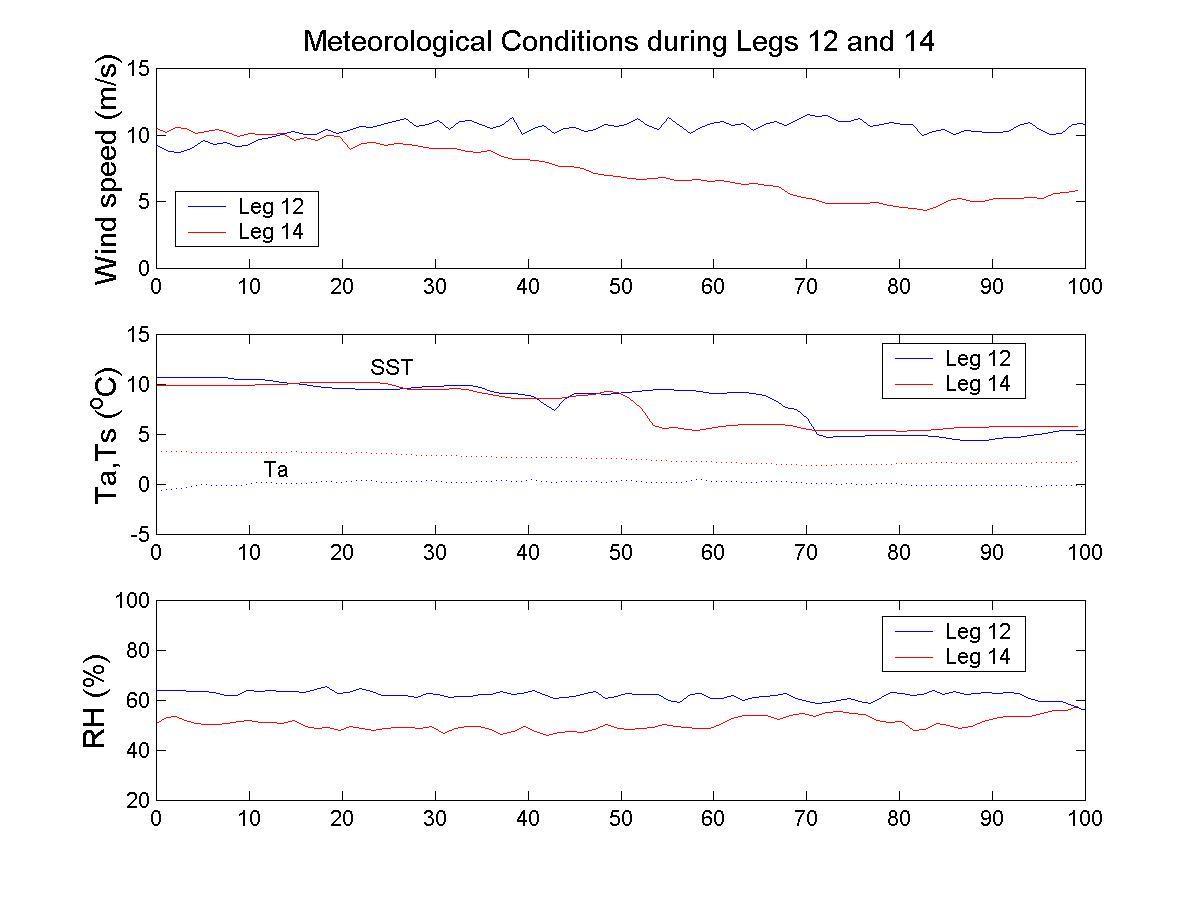
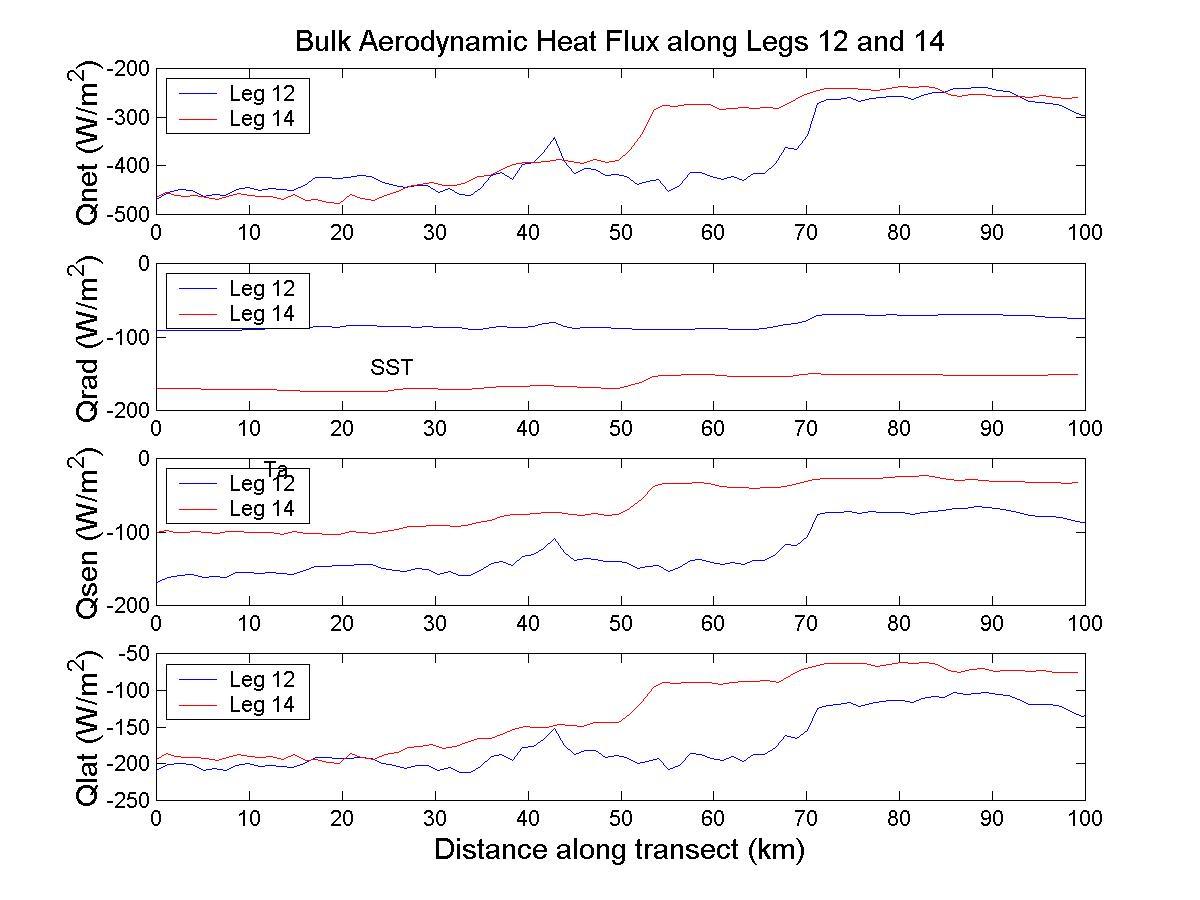
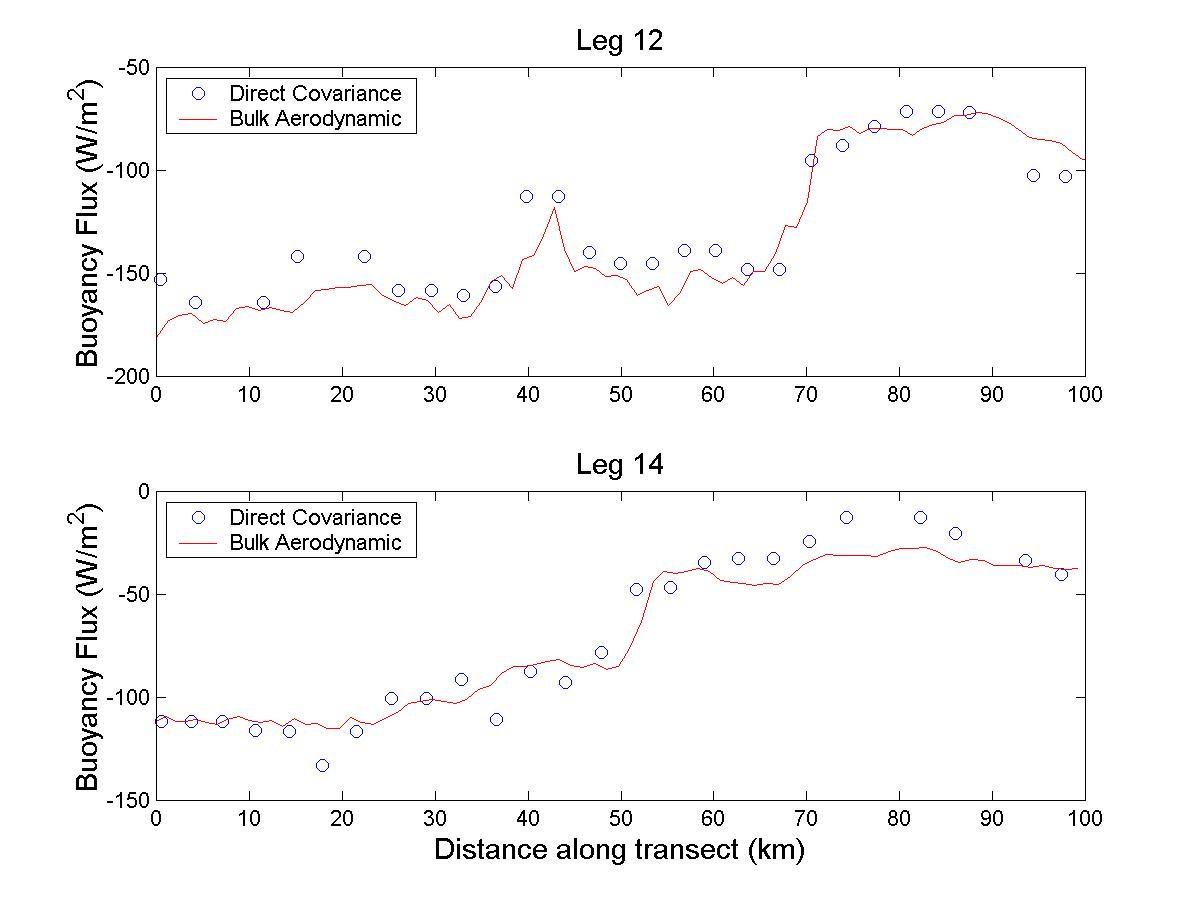
Figure 6. Meteorological conditions and surface fluxes during legs 12 and
14
on the Revelle cruise. The buoyancy flux was computed using a) the
basic meteorological data and the TOGA/COARE bulk aerodynamic formulation
and b) the sonic turbulence data and the direct covariance method.
SUMMARY
High
quality meteorological measurements were made on two oceanographic research
cruises in the Japan/East Sea during winter 2000. These measurements allow
estimation of the surface momentum and heat fluxes. Cold air outbreaks
can cause sensible and latent surface heat losses that increase in magnitude
on the warm (southern) side of the subpolar SST front due in part to the
enhanced air-sea temperature difference. A preliminary comparison of the
cross-front change in buoyancy flux computed using bulk aerodynamic and
direct covariance methods shows excellent agreement, demonstrating the
rapid change in surface fluxes on scales of a few km's across the front.
ACKNOWLEDGEMENTS
The
authors want to thank the captains and crews of the R/V Revelle
and R/V Khromov for their patience and skill in helping collect
meteorological data during the winter 2000 cruises. G. Allsup, D. Hosom,
B. Way, and R. Payne constructed the prototype ASIMET longwave radiometer
used in this program. D. Alden, W. Sutherland and his shipboard technical
support group, and J. Ware provided addition help with the instrumentation
and fieldwork, and R. Payne helped with initial data processing and sensor
evaluation. M. Caruso and A-M. Michael helped with poster presentation.
The Office of Naval Research funded this research.
References
Beardsley,
R., E. Dever, S. Lentz, and J. Dean, 1998. Surface heat flux variability
over the northern California shelf. J. Geophys. Res., 103, 21,553-21,586.
Edson,
J.B., A.A. Hinton, K.E. Prada, J.E. Hare, and C.W. Fairall, 1998. Direct
covariance flux estimates from mobile platforms at sea. J. Atmos. Oceanic
Tech., 15, 547-562.
Fairall,
C., E. Bradley, D. Rogers, J. Edson, and G. Young, 1996. Bulk parameterization
of air-sea fluxes for Tropical Ocean-Global Atmospheric Coupled Ocean-Atmospheric
Response Experiment. J. Geophys. Res., 101, 3747-3764.
Pawlowicz,
R., R. Beardsley, S. Lentz, E. Dever, and A. Anis, 2001. The Air-Sea Toolbox:
Boundary-layer parameterization for everyone. EOS, (in press).