Digital data description and access
Here we describe three digital data sources made available for community by this project activities, namely:
Observational hydrographic data
There are two types of these data: a) Gridded monthly T and S data interpolated (Reiniger and Ross, 1968; Levitus and Boyer, 1994 interpolation method) into 242x90x29 PIOMAS grid (grid coordinates are provided in the data archive) for each year of each period under investigation and b) mean climatology with statistical information about variability of T and S for the entire period of observations. “Standard” grid vertical levels are:
2.5, 7.5, 12.5, 17.5, 22.5, 27.5, 33.0, 39.5, 47.0, 55.5, 65.0, 75.715, 90.68, 113.665, 146.815, 192.645, 254.06, 334.31, 436.925, 565.705, 724.585, 917.485, 1148.085, 1419.7, 1737.065, 2108.895, 2542.395, 3041.73, 3613.145
The data format for both gridded data sets is:
I, J, NZ, Z, T1, T2, STD_T, NT , S1, S2, STD_S, NS
Where I, J, NZ – horizontal (I and G) and vertical (NZ) digital grid (indexes) coordinates. Z – grid level (meters); T1 mean water temperature; T2 – weighted water temperature; STD_T – water temperature standard deviation; NT – number of observations of water temperature; S1 mean water salinity; S2 – weighted water salinity; STD_S – water salinity standard deviation; NS – number of observations of water salinity.
Grid coordinates are provided in file “coordinates.dat” and code to read coordinates if provide in “README.doc” file.
Currents data
J3 ("july3.dat") is the most recent climatological summary from humankind's history of current meter, as well as more recent profiler, observations. J3 identifies 12597 distinct "climatological points" on the basis of observations of duration greater than two weeks. In total the compilation spans over 10,000 years of ocean current observations.
J3 combines results from 7593 points discussed in Holloway (2008) and 5814 points discussed in Scott et al. (2010). Both compilations have been further extended by their respective authors, in particular including the collection from Gregory (2004). In all, summaries at over 17,000 point were gathered. However this included extensive redundancies, "near redundancies", and partially overlapping observation periods. Data collected in adjacent years, sometimes continuously spanning several years, at the same location were collapsed to a single climatological point. In other cases where the same location was revisited after a span of several years or even decades, a separate "climatological point" was retained although these separated-in-time records could be collapsed for purpose of climatology. For climatological purposes, profiler records which can be quite dense in vertical were rebinned to a minimum of 20m, in some cases 50m, vertical separation.
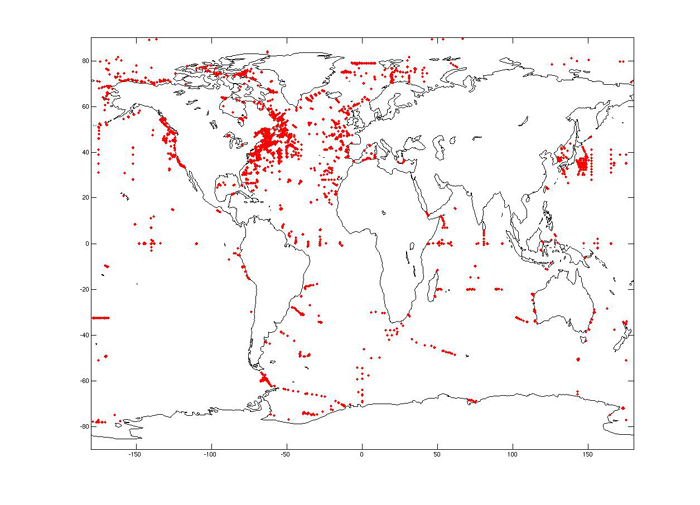
Figure 1. Locations of J3 observational sites
These efforts reduced the present number of points to 12597 which form J3 as given in "july3.txt", a plain text (ascii) file listing 12597x11 array with blanks as separators. The 11 columns are:
- an ID code for locating the originating data source
- latitude (degr, N=+)
- longitude (degr, E=+)
- instrument depth (m)
- year of initial deployment (-999 if unknown)
- number of months of deployment
- mean U (eastward, cm/s)
- mean V (northward, cm/s)
- std dev about U (cm/s, -9.99 if unknown)
- std dev about V (cm/s, -9.99 if unknown)
- nominal depth to the bottom (m, -999 if unknown)
References
Gregory, D.N., 2004: Ocean Data Inventory (ODI): A Database of Ocean Current, Temperature and Salinity Time Series for the Northwest Atlantic. DFO Can. Sci. Advis. Sec. Res. Doc. 2004/097
Holloway, G., 2008: Observing global ocean topostrophy. J. Geophys. Res., 113, C07054, doi:10.1029/2007JC004635
Scott, R. B., B. K. Arbic, E. P. Chassignet, A. C. Coward, M. Maltrud, W. J. Merryfield, A. Srinivasan, A. Varghese, 2010: Total kinetic energy in four global eddying ocean circulation models and over 5000 current meter records. Ocean Modelling, 32, 157-169, DOI: 10.1016/j.ocemod.2010.01.005.
Acknowledgements
Greg Holloway is employed by the Canadian Dept of Fisheries and Oceans. Rob Scott, employed by the University of Texas at Austin, acknowledges grants from the National Science Foundation and the King Abdullah University of Science and Technology.
Project results
Project results are provided at 3 different grids. These are “native” grids of PIOMAS and SIOM models (see above) and results in the common AOMIP grid with model parameters (T, S and currents) at standard levels (5, 10, 15, 20, 25, 30, 50, 75, 100, 150, 200, 250, 300, 400, 500, 750, 1000, and 1500m).
Project monthly data from PIOMAS model for 1978-2007 are available at PIOMAS web site http://psc.apl.washington.edu/IDAO/data_piomas.html.
Project monthly T, S, currents, sea surface heights and freshwater content data are available as monthly mean averaged for 1972-1978, 1989-1996 and 1997-2006 in both graphical and digital forms at [make link to this data here]. Data formats and reading instructions are provided in readme.doc files.
|