| Oil and Gas: Seismic Exploration
In 2003, a Canadian natural gas company began seismic exploration
in deep water 285 miles due east of Boston. Drilling was expected
to begin shortly thereafter. For more information see: Press
Release from Canadian Superior Energy, “Canadian Superior
Proceeding Full Steam Ahead with ‘Marquis’, ‘Mariner’
and ‘Mayflower’ Offshore Projects, June 16, 2003;
also Gene Laverty, “Natural Gas Drilling planned 285
miles off Boston Shore, The Providence Journal, June 22, 2003,
at F2. Regarding other exploration projects in the area, see:
R. Davis et al., “Environmental Assessment of Seismic
Exploration on the Scotian Shelf, a report prepared for submission
to the Canada/Nova Scotia Offshore Petroleum Board, August
5, 1998.
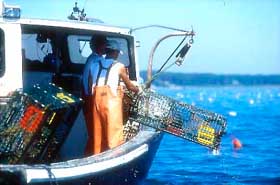
Fishing
This layer has been provided by Dr. David Wiley from the
International Wildlife Coalition and the Stellwagen Bank National
Marine Sanctuary, and Just Moller and Kristin Zilinskas of
the Stellwagen Bank National Marine Sanctuary. The points
represent fixed fishing gear sightings in the sanctuary. The
data were collected using 15 designated line transects across
Stellwagen Bank. The exact geographic coordinates of the fishing
gear was approximated using an estimated radial angle from
the ship’s heading, a time reading, and estimated distance.
The data is a compilation of a survey period from July 2001-June
2002. The sanctuary was surveyed every month: it took three
days to survey the entire sanctuary for each month’s
data collection.
 |
|
The fixed gear data gives an indication of the concentration
of fishing activity on Stellwagen Bank: where there is fixed
gear (primarily gillnet and traps) there will be noise from
the fishing vessel that tends the gear. It is difficult to
predict, however, how much noise is associated with fixed
gear because vessel activity at fixed gear locations is variable.
On average, gillnets are usually not left out for more than
one day because they can get tangled and cut. Traps are usually
tended daily during the summer, but every three to six days
during the spring and fall. At a minimum, in the northeast,
traps must be checked at least every 30 days as mandated by
the Atlantic
Large Whale Take Reduction Plan. This plan also requires
that when whales are sighted in an area fishing gear must
be removed, known as Dynamic Area Management and Seasonal
Area Management.
Dredging & Dumping Grounds
For information on dredging see: http://stellwagen.nos.noaa.gov/about/sitereport/dredge.html
Recreational Activities
Stellwagen Bank is a popular location for recreational boating,
fishing, and other activities. Although the location and intensity
of these activities are not presently well documented, they
could significantly contribute to ocean noise in the Sanctuary.
Consequently, the effects of recreational activities should
be considered when developing comprehensive measures to address
ocean noise.
Oceanographic Research
Stellwagen Bank is regularly used by several academic institutions
that conduct acoustic and oceanographic research. These include
Woods Hole Oceanographic Institution, University of Rhode
Island, University of Connecticut, University of Massachusetts
at Dartmouth, and Mass Maritime Academy.
Whale Watching
Whale watching is a popular recreational activity in Stellwagen
Bank National Marine Sanctuary—companies line the coast
from Provincetown to Newburyport. The whale-watching season
begins in April and ends in October for nearly all the companies
that operate in Stellwagen Bank.
Because the schedules of each whale watching company are
readily available, we were able to create a master calendar,
with resolution to the hour, of whale watching activity on
Stellwagen Bank. (Download data).
However, due to missing schedules, inclement weather and other
factors, the compilation should not be regarded as an exact
tally of the boats on the water during summer 2003, but rather
as an approximation and indicator of trends in whale watching
activity. The graph to the right shows the average number
of commercial whale watching boats on the water at any given
time (between 8AM to 8PM) for each month. Included in the
graph are the monthly means, standard deviations, minimums
and maximums. The maximum was calculated based on a hypothetical
scenario in which all whale watching companies sent all of
their fleet out at once. The maximum, therefore, shows how
much activity the current infrastructure allows.
The second graph shows the average daily number of boats
on the water, by hour of the day. The results were based on
an average taken over the season. The peak time for whale
watching cruises is around 2 PM.
Marine Mammals
The whale sighting data was compiled by Dr. David Wiley from
the International Wildlife Coalition, in conjunction with
Just Moller and Kristin Zilinskas of Stellwagen Bank National
Marine Sanctuary. The data were collected using 15 designated
line transects across Stellwagen Bank. The exact geographic
coordinates of the whales were approximated using an estimated
radial angle from the ship’s heading, a time reading,
and estimated distance. The data is a compilation of a survey
period from July 2001-June 2002. The sanctuary was surveyed
every month: it took three days to survey the entire sanctuary
for each month’s data collection.
For more information on the methods and results of Dr. Wiley’s
research, see “The Distribution and Density of Commercial
Fisheries and Baleen Whales within the Stellwagen
Bank National Marine Sanctuary”: July 2001-June
2002. MTS Journal, Vol. 37, No. 1, 35-53. More information
on the marine mammals present in the Sanctuary is available
at the SNMS website.
Territorial Seas
The current concept of the territorial sea was established
by the 1982
Law of the Sea Convention which stated that every “the
sovereignty of a coastal state extends beyond its land territory
to an adjacent belt of sea, described as the territorial sea.”
The territorial sea can be no farther than 12 nautical miles,
measured from baselines. Source: Art. 2 of the 1982 Law of
the Sea Convention.
State Submerged Lands
The state submerged land border is three miles seaward from
the mean low water line. This line divides oceanic jurisdiction
between federal and state authorities. A result of the Submerged
Lands Act, the border determines whether energy and mineral
resources are subject to state or federal control.
|


