EDDIES: MODIS
imagery (ICESS UCSB: D. Siegel & T. Westberry)
2004
Chl-a maps
[.fli] [.avi format]
for easy browsing
SST maps [
.fli] [.avi format] for
easy browsing
2005
Chl-a maps [.fli]
[.avi format]
for easy browsing
SST maps [
.fli] [.avi format] for
easy browsing
Note: mistakenly
year
2004 indicated instead of 2005
QuikScat Winds
daily maps of wind speed and wind direction, Ekman's vertical
velocity;
ascending/descending passes; ship's track
and current position overlayed
[.fli format]
2004
wind_ekman_vv [.fli]
[.avi format]
("large" domain) [75 : 45W, 28 : 38N]
wind_ekman_vv {.fli]
[.avi format]
("small" domain) [67 : 57W, 29 : 36N]
QuikScat winds projected onto eddy C1 trajectory
Digital data:
ascending/descending passes; from Feb 1, 2004 to Aug 30, 2004
[point #; u-comp; v-comp; wind amplitude], m/sec
ascii: qscat_c1_proj.dat
mat-file: qscat_c1_proj.mat
wind speed from
underway measurment (ship's athena data) with QuickScat winds
overlayed
wind speed from QuickScat
data and corresponding downward vertical velocity
(Martin & Richards, DSR II 48, 2001, 757-773)
net downward depression
of the
seasonal pycnocline
2005
wind_ekman_vv
[.fli] [.avi format] ("large"
domain) [75 : 45W, 28 : 38N]
wind_ekman_vv
[.fli] [.avi
format] ("small" domain) [71 : 61W, 28 : 35N]
QuikScat winds projected onto eddy A4 trajectory
wind_speed
[.png]
wind_vectors
[.png]
Digital data:
ascending/descending passes; from Sep 1, 2004 to Sep 25, 2005
[point #; u-comp; v-comp; wind amplitude], m/sec
ascii: qscat_a4_proj.dat
mat-file: qscat_a4_proj.mat
wind speed from
underway measurment (ship's athena data) with QuickScat winds
overlayed
wind speed from athena
and QuickScat data and corresponding upward vertical velocity
(Martin & Richards, DSR II 48, 2001, 757-773)
net upward lift of the
seasonal pycnocline
daily_winds
[.fli format]; [.avi
format] position of eddy's center is indicated as white
circle
Altimetry
EDDIES
backtracking (A1, C1, C2); 2004 field season
Nov_14_03 - Aug_31_04
[.fli animation ] [.avi animation]
A1 backtracking
C1 backtracking
C2
backtracking
A1 long track
C1
alternative tracking C2 long track
Trajectory backtracking: digital
data
C1 main path; in reverse order -- from August 30, 2004 to
February 1, 2004
[lon lat amplitude]; c1_04_main.mat
c1_04_main.dat
C1 alternative path: in reverse order -- from May 1, 2004 to October
26, 2003
[lon lat amplitude]; c1_04_altern.mat
c1_04_alterm.dat
Note: when backtracking C1, there was a
bifurcation point around June 1, 2004 found:
it's possible that C1 came up to this point from another
one path -- "alternative" one;
this alternative path could be tracked beginning from May 1, 2004;
so, there is a gap between June 1, 2004 and May 1, 2004 for the
alternative path;
to get the full C1 path in this case, it 's neccesary to connect
point corresponding to
June 1, 2004 on the "main"
path with that one corresponding to May 1, 2004 on the
"alternative" path.
Recently, this "alternative" track was recalculated using more
accurate Aviso data set.
In this case, it was possible to track the "alternative" path from May
1, 2004 until March 8, 2004.
We recommend to use trajectory backtracking from Aviso data.
[lon lat
amplitude]; c1_altern_aviso.mat c1_altern_aviso.dat
EDDIES backtracking (A4, A5, C3, C4, C5);
2005 field season
NRT Feb1_05-Jun10_05
[.fli animation] [.avi
animation] (CCAR data)
Nov 14, 2003 - August 30, 2005
[.fli animation] [.avi animation]
(AVISO data)
A4 backtracking
A5 backtracking
A4 & C5 backtracking
also, see .fli animation Aug 27, 2004 - May 14, 2005
C3 backtracking
or, .avi animation Aug 27, 2004 - May 14, 2005
C4 backtracking
Trajectory backtracking: digital data
A4 eddy; in reverse order -- from 25 September, 2005 to 1 September,
2004
[lon lat amplitude]; a4_05_btrack.mat
a4_05_btrack.dat
EDDIES backtracking (A4, A5, C3, C4, C5);
2005 field season
ADCP tracking (C1) from Optimal Interpolation (OI); 2004
field season
oc404-1 (NB)
oc404-4
(NB) [.fli animations]
oc404-1 (NB)
oc404-4
(NB) [.avi animations]
C1 center tracking
from ADCP and altimetry
C1_track.png
C1_track_specific.png
download .mat files: C1_nb1.mat C1_nb4.mat
or, ascii files: C1_nb1.dat
C1_nb4.dat
Note: [xdel, ydel, tdel --
from specific determinations of the eddy center]
ADCP
tracking ( A4
) from Optimal Interpolation (OI);
2005 field season
N/A
oc415-2
(OS) / avi
oc415-3 (OS)
/ avi
oc415-4
(OS) / avi
oc415-1 (NB)
/ avi N/A
oc415-3 (NB) / avi oc415-4 (NB) /
avi
A4 center
tracking from the ADCP and altimetry
A4 track.png
download .mat
files: A4_NB1.mat A4_OS2.mat
(triplets: yearday, lon,lat)
A4_OS3.mat A4_OS4.mat
or, ascii files: a4_nb1.dat
a4_os2.dat a4_os3.dat a4_os4.dat
C1 and A4 phase
speed (speed, eddies are moving in the southwest/northwest direction)
Phase speed was calculated using altimetry backtracking data
and data from OI adcp analysis.
Zonal component is distance between the initial and the final
eddy center positions (in latitude),
devided by the corresponding time period. Meridional component is the
same but projected onto
the longitude. All digital data are taken from this website.
Eddy/Phase speed
|
zonal/merid/module
|
C1 (altim)
|
-4.0
0.4 4.05
|
C1 (OI adcp)
|
-2.25
0.9 2.43
|
A4 (altim)
|
-4.0
-1.8 4.40
|
A4 (OI adcp)
|
-4.7
-1.95 5.09
|
Below is adcp (processed) data (.mat files):
cruise oc415-1:
N/A
vectors (nb150)
cruise oc415-2: vect_comp navig_depth (os2)
N/A
cruise oc415-3: vect_comp navig_depth (os3),
or
vectors
(nb150)
cruise oc415-4: vect_comp navig_depth (os4),
or
vectors
(nb150)
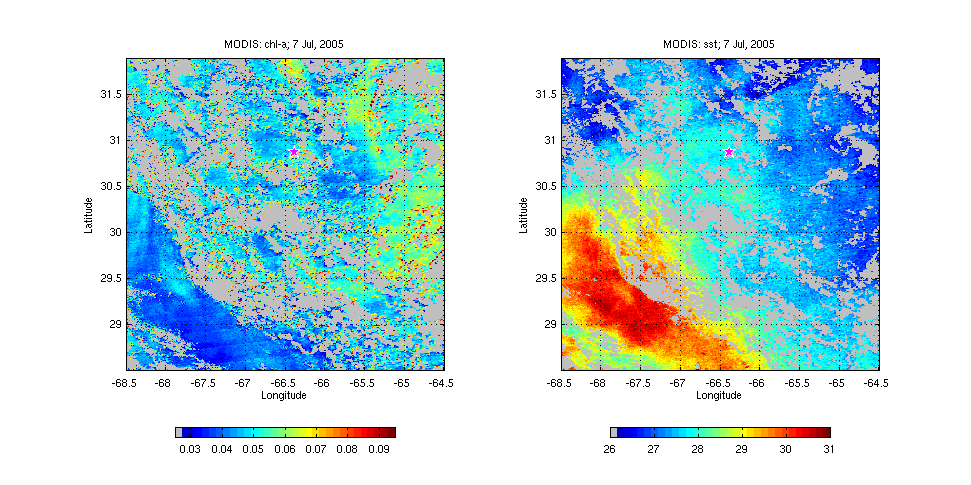
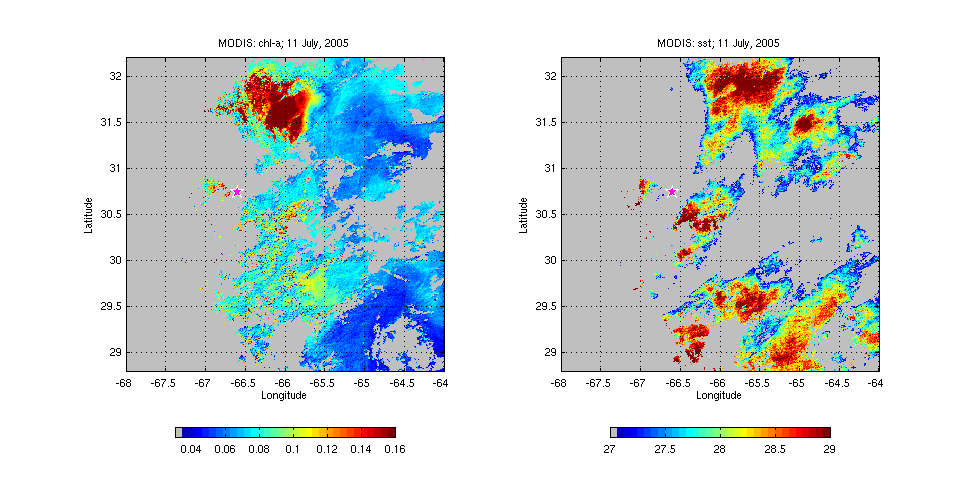
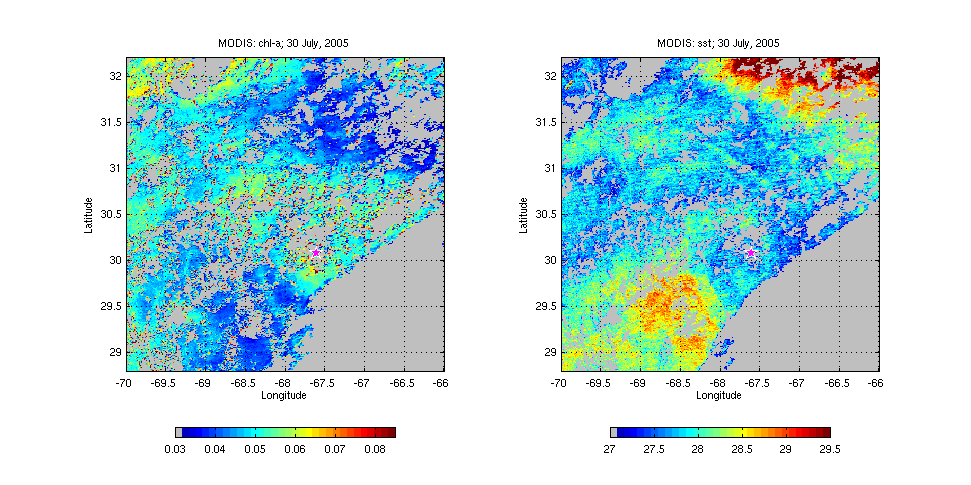
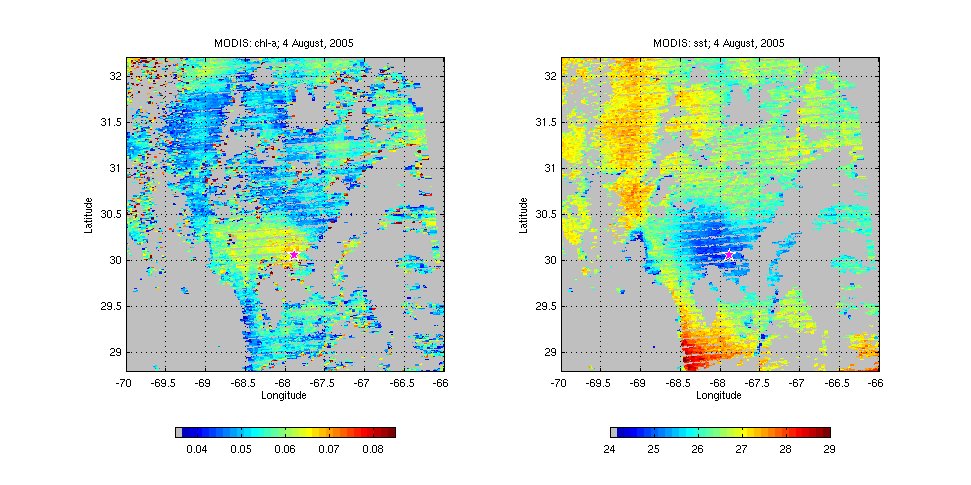
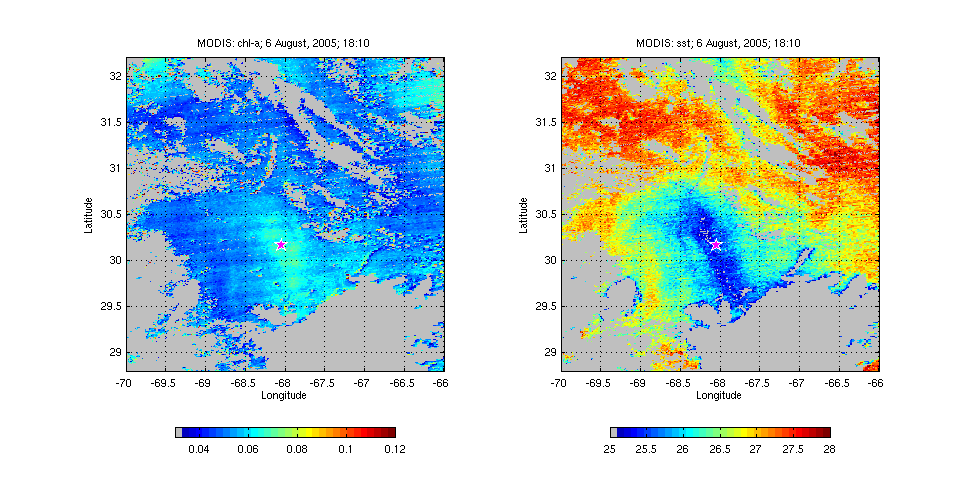
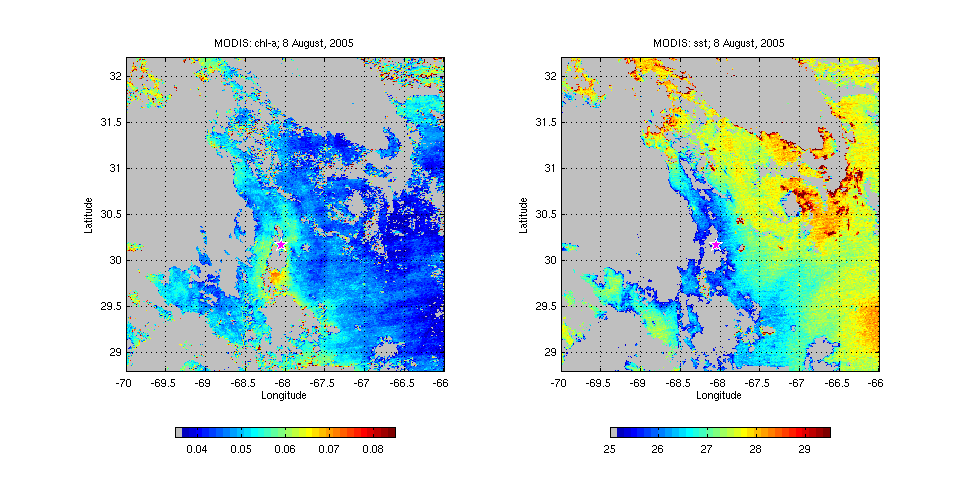
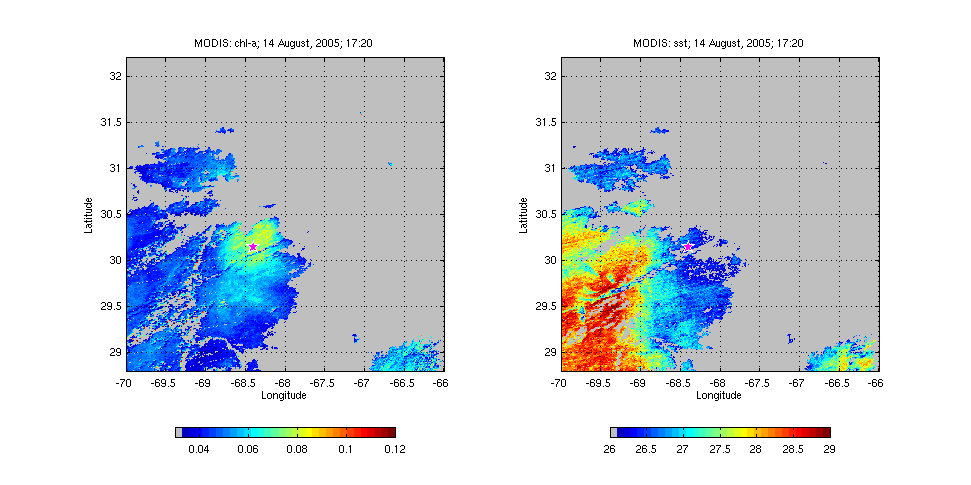
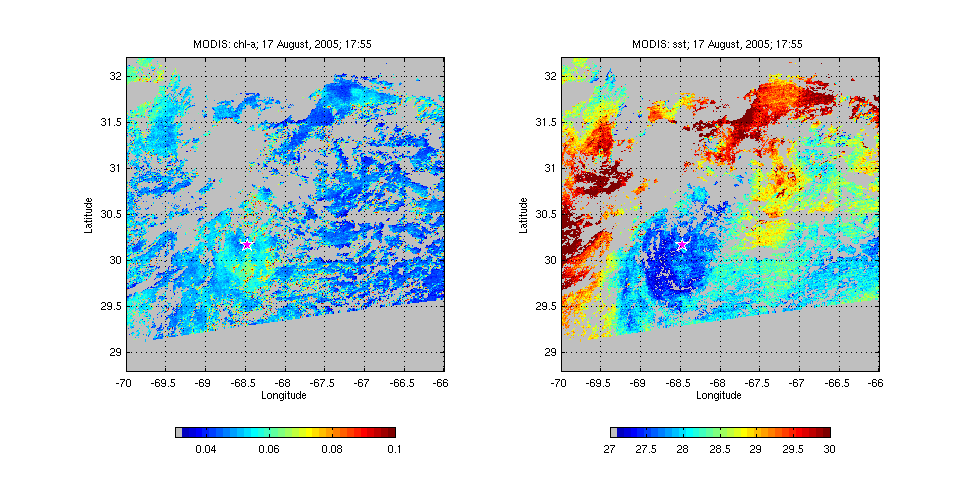
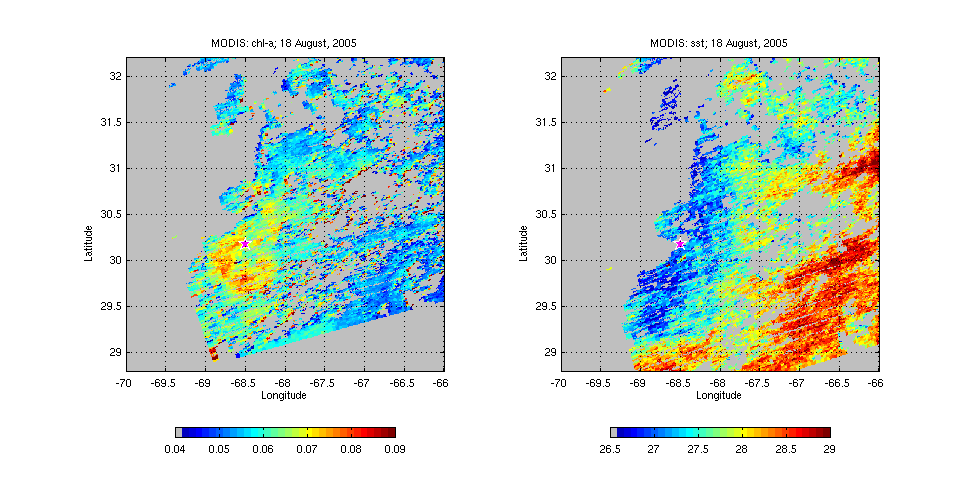
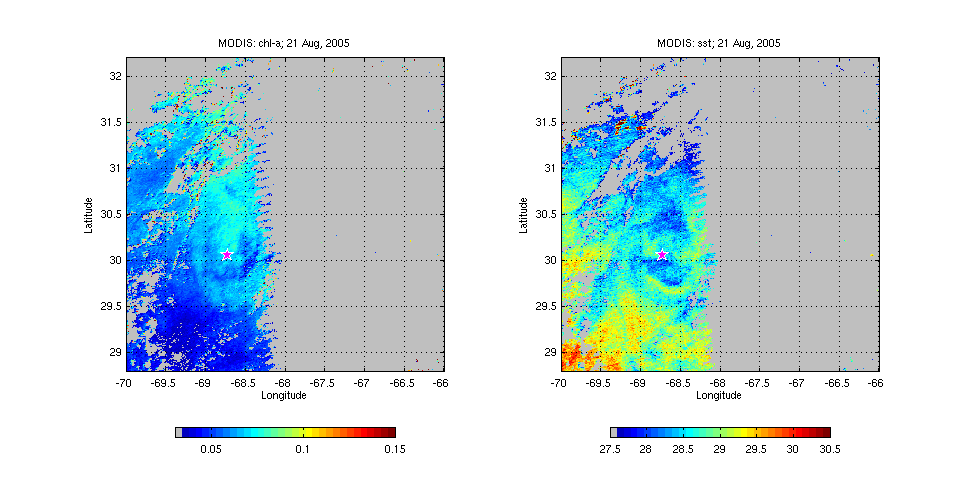
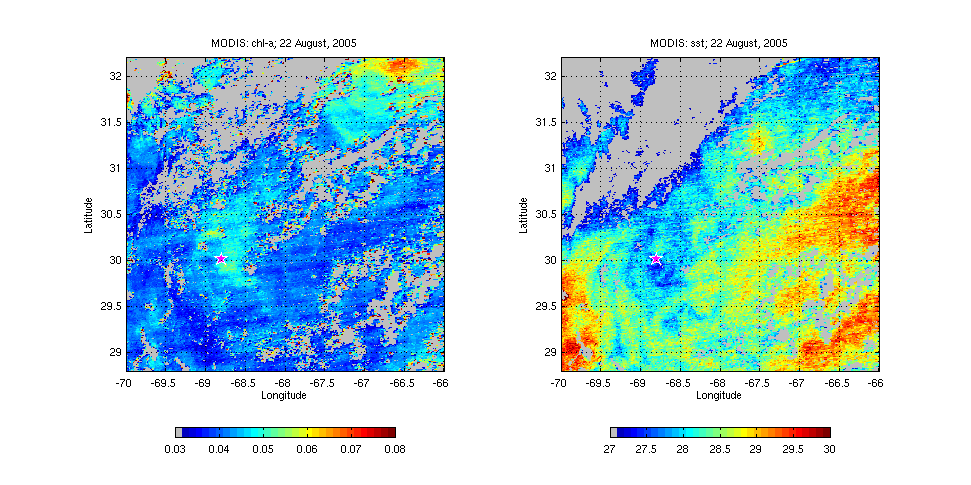
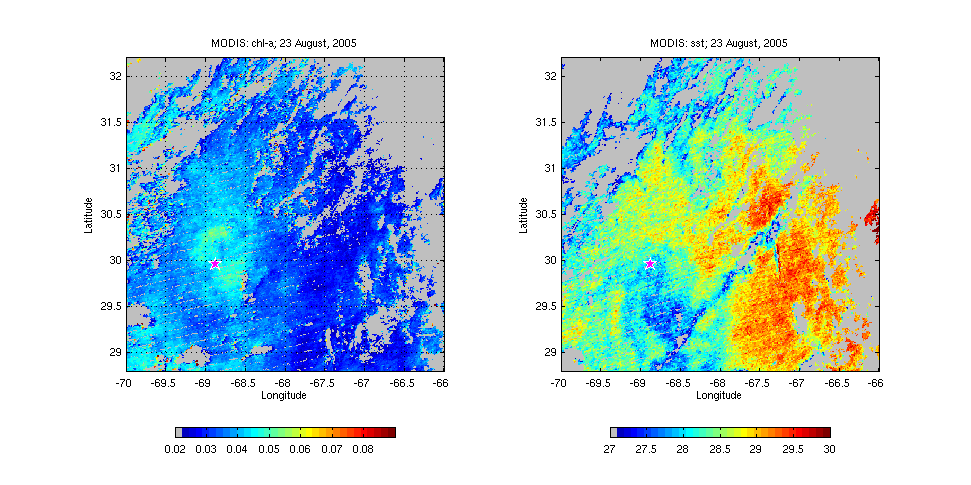
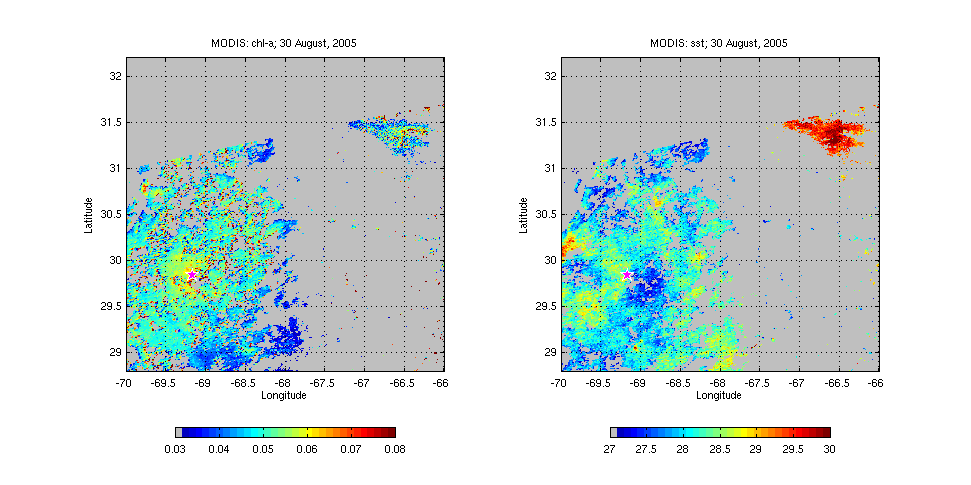
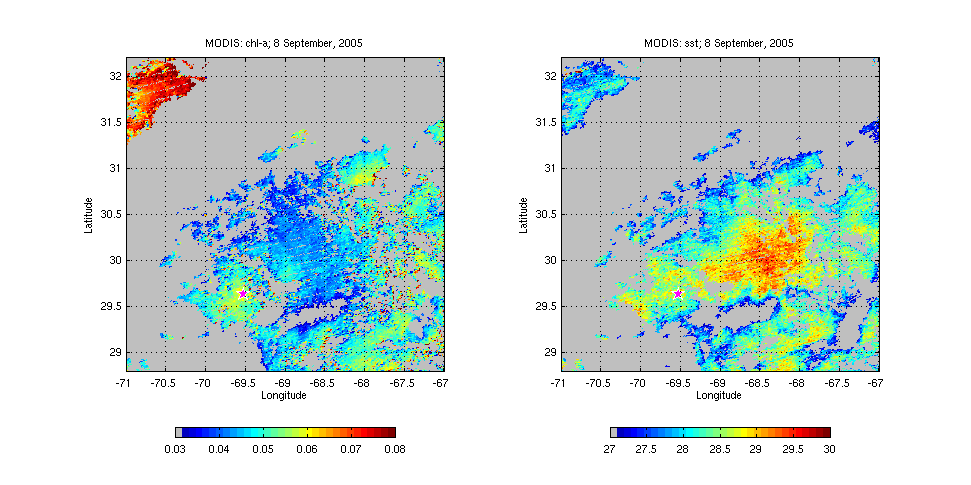
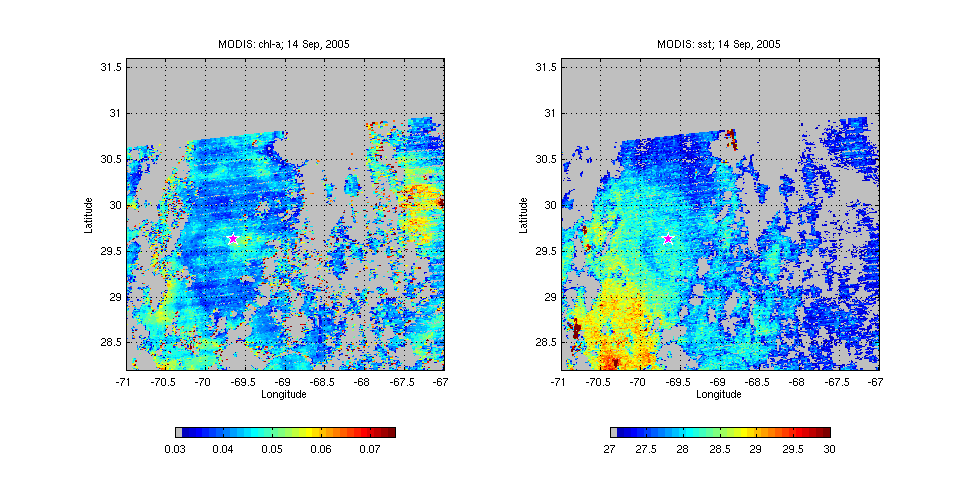
A4 Eddy: Chl-a and SST from MODIS imagery, 2005
Observations of Chl-a concentration in anticyclonic eddy A4
VPR, cruise oc415-3 chl-a as a function of
distance from A4 center
splitted in 40 m layers
see plot
splitted in 10 m layes
see
plot
SeaHorse,
cruise oc415-4 chl-a concentration derived from vertical
profiles
within 20 km of eddy core
see plot
VPR
oc415-1/4
Map of vpr tracks during oc404-1/4
cruises with the trajectory of eddy C1 overlayed
final position:
period 6 days
period 7.5 days
rotated file
rotated file
oc415-1/3
Map of vpr tracks during oc415-1/3
cruises with the trajectory of eddy A4 overlayed
vpr_rotated [.fli format]
vpr_rotated
[.avi format]
final position:
period 4.7 day
period 6 days period 7.5 days
Drifters
drifter
trajectories during 2005 field campain with the position
of the
anticyclonic eddy A4 center overlayed a4center_dft.png
see info
about drifters Table 1
Summary plot of all SALP drifter trajectories
(D.Fratantoni)
SALP dfts
CTD .log files
A
distance from eddy center (C1 in 2004, and A4 in 2005) is added to the
CTD
log files. See original log files at
http://ocb.whoi.edu/jg/dir/OCB/EDDIES/
S1_2004
Survey 1
(OC404-1/WB0409) S2_2004
Survey 2 (OC404-4/ WB0413)
distance from eddy center: see
note on line 70 of this file
S1_2005
Survey 1
(OC415-1/WB0506) S2_2005
Survey 2 (OC415-3/WB0508)
T1_2005
Tracer 1
(OC415-2)
T2_2005
Tracer 2 (OC415-4)