Efim Pelinovsky and Tatjana Talipova
Department of Applied Hydrodynamics and Nonlinear Acoustics,
Institute of Applied Physics, Russian Academy of Sciences,
Nizhny Novgorod, Russia
Justin Small
Defence Evaluation Research Agency,
Winfrith, Dorset , UK
1. Introduction
The SESAME experiment (Small et al, this workshop) at the Malin shelf-edge provided a number of observed examples of internal bore evolution both over the continental slope and on the shelf. This process is important to understand as a generator of internal solitons. Further, knowledge of the evolution of bores and waves may allow prediction forward from observations at a fixed point to distant points. Here the observations have been numerically simulated with the extended Korteweg-de-Vries type equations. Results indicate close agreement in the cases studied for single sources.
2. Observations of bore evolution
On the 13th August 1996 during the Shelf Edge Study Acoustic Measurement Experiment (SESAME) a number of ship tows across the Malin shelf-edge were conducted. The ship towed a thermistor chain and carried a hull-mounted ADCP. The thermistor chain resolved the internal waves well, with a 20 second sub-sampling from the original 1 Hz sampling, but the ADCP, averaging over 2 minutes, often smoothed out the high frequency waves. Figure 1 illustrates a set of four thermistor chain surveys which clearly show the evolution of an internal bore (marked ?A?) in the first survey into a set of large amplitude (~30 m ) internal waves during the last two surveys. The bore was seen to move on-shelf with a phase speed close to that of the linear first mode phase speed of 0.3 ms-1. The following sections interpret the evolution in terms of the extended Korteweg-de-Vries equation.
3. Theoretical Model
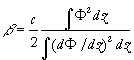
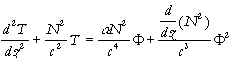
Taking into account the large amplitude of the internal waves and the relatively short period of the waves (compared with the tidal period) the extended Korteweg - de Vries equation incorporating quadratic and cubic nonlinear terms (Lamb &Yan, 1996; Talipova et al, 1997; Holloway et al, 1998) was chosen as the basic model for numerical simulation of the evolution of the internal bore. This equation has a form
![]() ,
(1)
,
(1)
where h (x,t) is the wave profile function, which in the small amplitude, long-wave limit, gives the maximum vertical isopycnal displacement for the first mode, x is a horizontal co-ordinate and t is time. All coefficients of the extended Korteweg - de Vries equation are
 ,
, 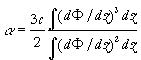 ,
(2)
,
(2)
 ,
(3)
,
(3)
where T(z) is a solution of the ordinary differential equation
 ,
(4)
,
(4)![]()
and the linear modal structure of the internal wave is described by
![]() (5)
(5)
with the zero boundary conditions for both equations. With the needed accuracy the vertical displacement is presented as
![]() .
(6)
.
(6)
The normalised condition ![]() ,
where
,
where ![]() is used so that the
wave function h (x,t) describes the maximal
vertical isopycnal displacement, or more exactly, the displacement in the
maximum of the linear mode. The extended equation (1) is an integrable
model like the Korteweg - de Vries equation. It posses steady-state solutions
in the form of the solitary wave (soliton) and dissipativeless shock waves
(kinks) which interact between them elasticity. The dynamics of the large-amplitude
solitons in the frame of the extended Korteweg - de Vries equation recently
was studied by Pelinovsky & Slunayev (1998).
is used so that the
wave function h (x,t) describes the maximal
vertical isopycnal displacement, or more exactly, the displacement in the
maximum of the linear mode. The extended equation (1) is an integrable
model like the Korteweg - de Vries equation. It posses steady-state solutions
in the form of the solitary wave (soliton) and dissipativeless shock waves
(kinks) which interact between them elasticity. The dynamics of the large-amplitude
solitons in the frame of the extended Korteweg - de Vries equation recently
was studied by Pelinovsky & Slunayev (1998).
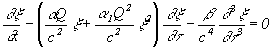
The effect of variable depth and the horizontal variability of the density stratification at the Malin Shelf Edge can be included also in the model. The next modification of the equation (1) should be used if the horizontal variability is slow:(Pelinovsky et al, 1994; Zhou & Grimshaw, 1989; Holloway et al, 1998).
 ,
(7)
,
(7)
where
![]() ,
, ![]() ,
(8)
,
(8)
 (9)
(9)
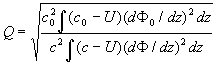
and values with index "0" are the values at any fixed point x0 (it usually corresponds to the deepest water station). Equation (7) is solved by finite difference.
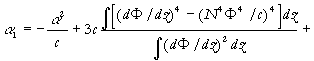
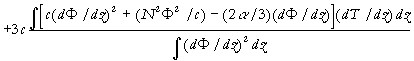
The coefficients of the variable-coefficient extended Korteweg - de Vries equation (7), c, b , a , a 1, Q, for the conditions of the Malin Shelf Edge were calculated for the four locations where internal waves were registered, they are presented in Table 1. Parameter Q is constant practically. Averaged values and standard deviations of the coefficients of the generalised Korteweg - de Vries equation are given in the last row of Table 1. These values of the coefficients of the basic model may be used to estimate the possible soliton parameters for conditions at the Malin Shelf Edge. As it is known, the exact soliton solution of the extended Korteweg - de Vries equation is (Kakutani, Yamasaki, 1978: Miles, 1981; Pelinovsky & Slunyaev, 1998)
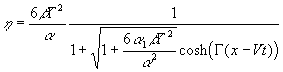 ,
, ![]() .
(10)
.
(10)
Here G --1 is a parameter characterised the effective width of the solitary wave, which varies from zero to
 .
(11)
.
(11)
The soliton polarity is negative. Spatial structure of the solitary wave profiles for different values of the parameter G are shown in Figure. 2. As it can be seen, the characteristic length of the solitary wave depends on the soliton amplitude and it varies from 1 km (for the wave amplitude 10 m) to 2 km and more for the wave amplitude close to the limiting value (30.8 m).
4. Numerical simulation
Data from the temperature time series for eight depths of the thermistor chain tow with the Doppler shift removed were transformed into time series of the vertical isopycnal displacement using the mean temperature gradient. Assuming that wave displacements are of the first mode only, the formula (6) can be used to calculate the vertical displacement in the maximum of linear mode h . Accuracy of this procedure for the point of 160 m is demonstrated by Fig. 3, where the mean value of h (t) and its deviation calculated from data in eight depths are presented. Vertical displacement in the maximum of the linear mode h (t) is an input for the numerical simulation of the internal wave evolution. Results of comparison between computing and observations for each point are shown in Fig. 4. It can be seen that the model explains the observed leading solitary wave (amplitude and form) very well for every point in its formation and development. The agreement between the computed and the observed following large-amplitude waves is not so good in amplitude (but relatively good in phase), and the model predicts weaker waves than the observed ones. Possibly, this disagreement is related with some inaccuracy in the calculation of the vertical displacement from the thermistor chain data (averaged temperature gradient may change action of strongly nonlinear waves). Further, the calculation of the waveform assumes a constant speed across ground for each survey, to remove the Doppler shift, and this assumption does not include the possibility of different waves having different phase speeds, as expected from non-linear theory.
It is important to note that the amplitude of the largest solitary wave reaches approximately 30 m. Because this amplitude is comparable with the limited value for the soliton amplitude (30.8 m), the role of the cubic nonlinear term should be significant. To demonstrate this, the same process was performed with no cubic nonlinearity in the frame of the "classic" Korteweg - de Vries equation. In this simplified variant, the amplitude of the leading soliton is higher (approximately 38 m). Therefore, the cubic nonlinearity is important for the internal waves at the Malin Edge Shelf, and it leads to limit for the soliton amplitude.
5. Conclusion
The evolution of an internal bore at the Malin Shelf Edge has been simulated with a numerical Korteweg - de Vries model which deals with quadratic (first order) and cubic (second order) nonlinearity. The simulations were done for the conditions of the 13th August 1996 during SESAME II. Using measured buoyancy profiles at the Malin Shelf Edge, the coefficients of the generalised Korteweg - de Vries equation have been calculated and interpolated onto intermediate points. Real thermistor chain data for 13th August 1996 have been transformed into vertical displacements at each depth, and then the wave displacement at the maximum of the linear mode has been calculated, using the assumption of a linear modal vertical structure. These data were used for numerical simulation and interpretation of the observed data. Calculations have confirmed the observed picture of the bore transformation into a group of solitary waves: the model correctly predicts the 30 m amplitudes of the leading large-amplitude solitary waves, but underpredicts the amplitudes of the following waves which were observed between 20 and 30 m. The 30 m amplitude coincides with the theoretical limited value of the soliton amplitude (30.8 m), and therefore, the cubic nonlinearity is important for the description of the nonlinear internal wave evolution at the Malin Shelf Edge. Model simulations without cubic non-linearity (i.e. the basic Korteweg - de Vries equation) showed larger amplitudes than observed.
References
Holloway, P.E, Pelinovsky, E., Talipova, T., and Barnes, B. A nonlinear model of internal tide transformation on the Australian North West Shelf. J. Phys. Oceanogr., 1997, v. 27, No. 6, 871 - 896.
Holloway, P.E., Pelinovsky, E., and Talipova T., A generalised Korteweg - de Vries model of internal tide transformation in the coastal zone. J. Geophys. Res., 1998, submitted.
Kakutani, T., and Yamasaki, N., Solitary waves on a two-layer fluid. J. Phys. Soc. Japan, 1978, v. 45, 674 - 679.
Lamb, K., and Yan, L., The evolution of internal wave undular bores: comparisons of a fully nonlinear numerical model with weakly nonlinear theory. J. Phys. Oceanogr., 1996, v. 26, No. 12, 2712 - 2734.
Miles, J.W., On internal solitary waves. II. Tellus, 1981, v. 33, 397 - 401.
Pelinovsky, E., Stepanyants, Yu., and Talipova, T., Modelling of the propagation of nonlinear internal waves in horisontally inhomogeneous ocean. . Izvestiua, Atmos. Oceanic Physics, 1994, v. 30, 79 - 85.
Pelinovsky, E., and Slunyaev, A., Generation and interaction of the solitary waves of large amplitudes. JETP Letters, 1998, 67, N. 9, 655 - 661
Small. J., Sawyer, T., and Scott, J., The evolution of an internal bore at the Malin shelf edge, Annales Geophysicae, 1998, accepted
Small, J., Internal solitons in the ocean: prediction from SAR, this Workshop Proceedings.
Talipova, T., Pelinovsky, E., Lamb, K., Grimshaw, R., and Holloway, P,. Effects of cubic nonlinearity on the dynamics of internal waves. Transactions of Russian Academy of Sciences, Earth Section (accepted); Annales Geophysicae, 1997, v. 15, Suppl. 2, Pt. 2, C575.
Zhou, X., and Grimshaw, R.,The effect of variable currents on internal
solitary waves. Dynamics Atm. Oceans, 1989, v. 14, 17 - 39.
Table 1.
Coefficients of the basic equation for conditions of
the Malin Shelf Edge
|
|
|
|
|
|
|
|
|
|
|
|
|
|
|
|
|
|
|
|
|
|
|
|
|
|
|
|
|
|
|
|
|
|
|
|
154± 4 |
|
|
|
|
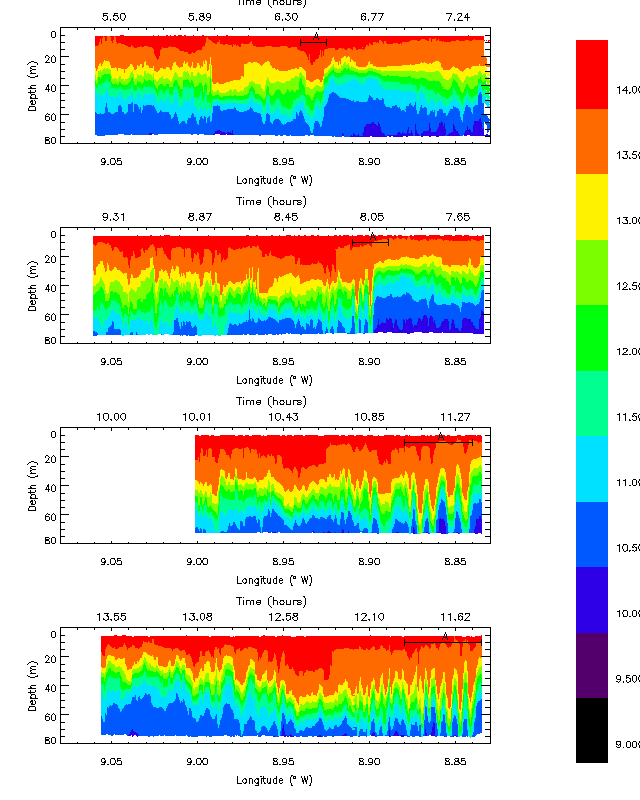
Figure 1. Temperature ( °
C) vertical cross-sections from thermistor chain, 13th August 1996. The
four plots show four surveys across the shelf edge, with the time in hours
at the top, and longitude at bottom, of the plot. The internal bore feature
marked ?A? in each plot can be seen to move eastwards (on-shelf) between
each plot, and evolve into internal waves.
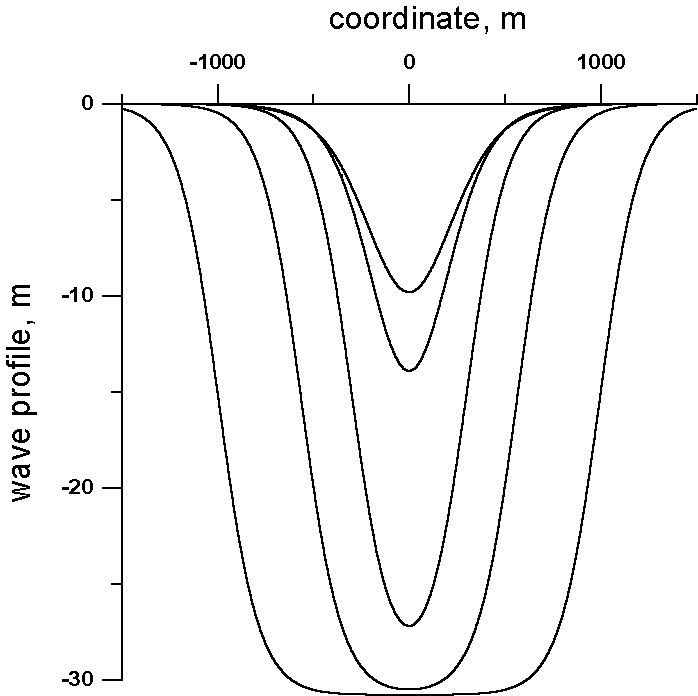
Figure. 2. Spatial structure of the soliton
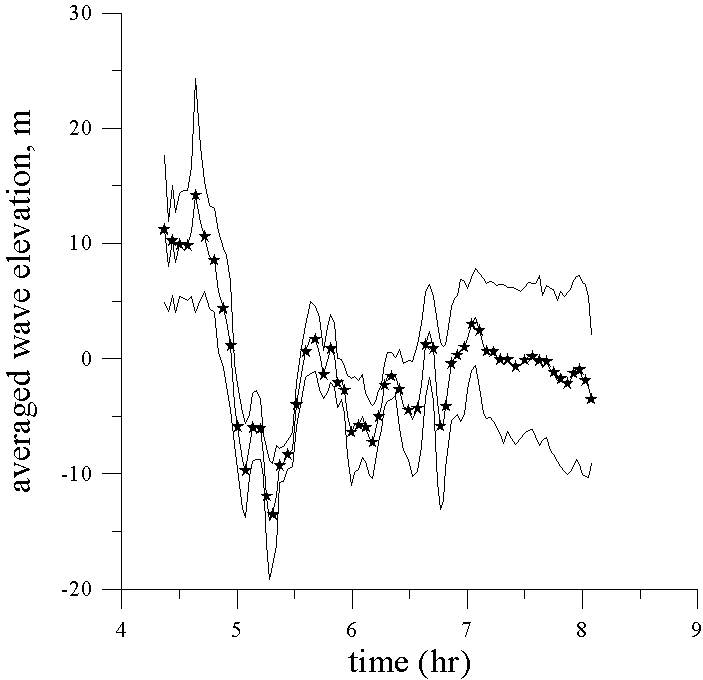
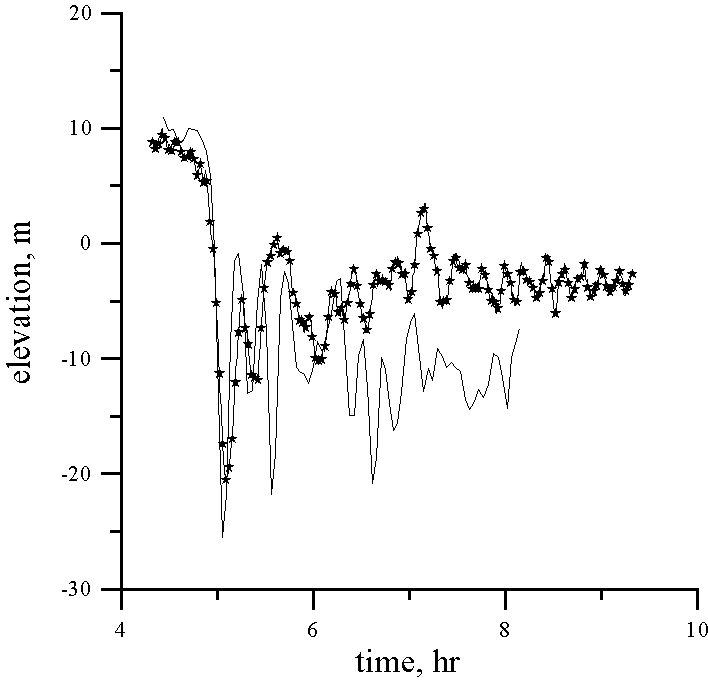
Figure 4. Comparison of the computed (solid line with
symbols) and observed wave records. Depth 156 m.
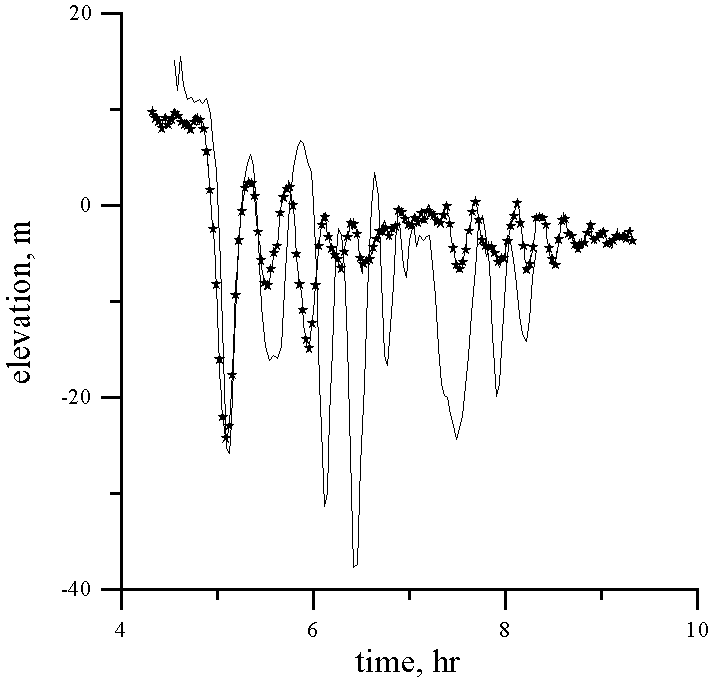
Figure 4 (continued). Depth 151 m
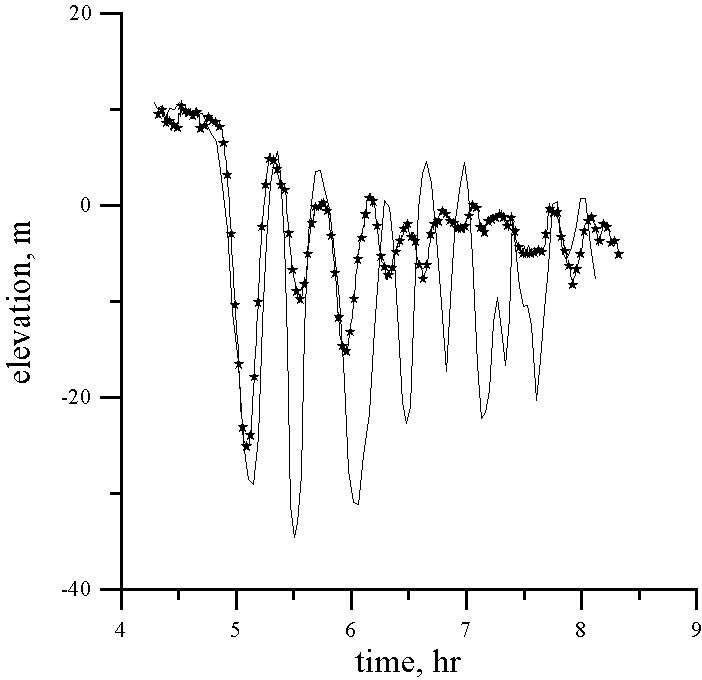
Figure 4 (continued). Depth 150 m